Financial Performance Analysis: Tesco and Sainsbury Report
VerifiedAdded on 2023/01/05
|20
|3892
|75
Report
AI Summary
This report delves into managerial finance, focusing on a comparative financial analysis of Tesco and Sainsbury, two major players in the UK supermarket sector. The first portfolio employs financial ratio analysis to assess their performance, examining ratios such as current, quick, net profit, gross profit, gearing, P/E, earnings per share, return on capital employed, stock turnover, and dividend payout. The report analyzes these ratios from 2018 to 2019, providing a detailed comparison of the two companies' financial health and performance. The second portfolio explores investment appraisal techniques, discussing their relevance and limitations in making informed investment decisions. The report concludes with a comparative analysis, highlighting the strengths and weaknesses of each company, and offering insights into their financial strategies and performance.
MANAGERIAL
FINANCE
FINANCE
Paraphrase This Document
Need a fresh take? Get an instant paraphrase of this document with our AI Paraphraser
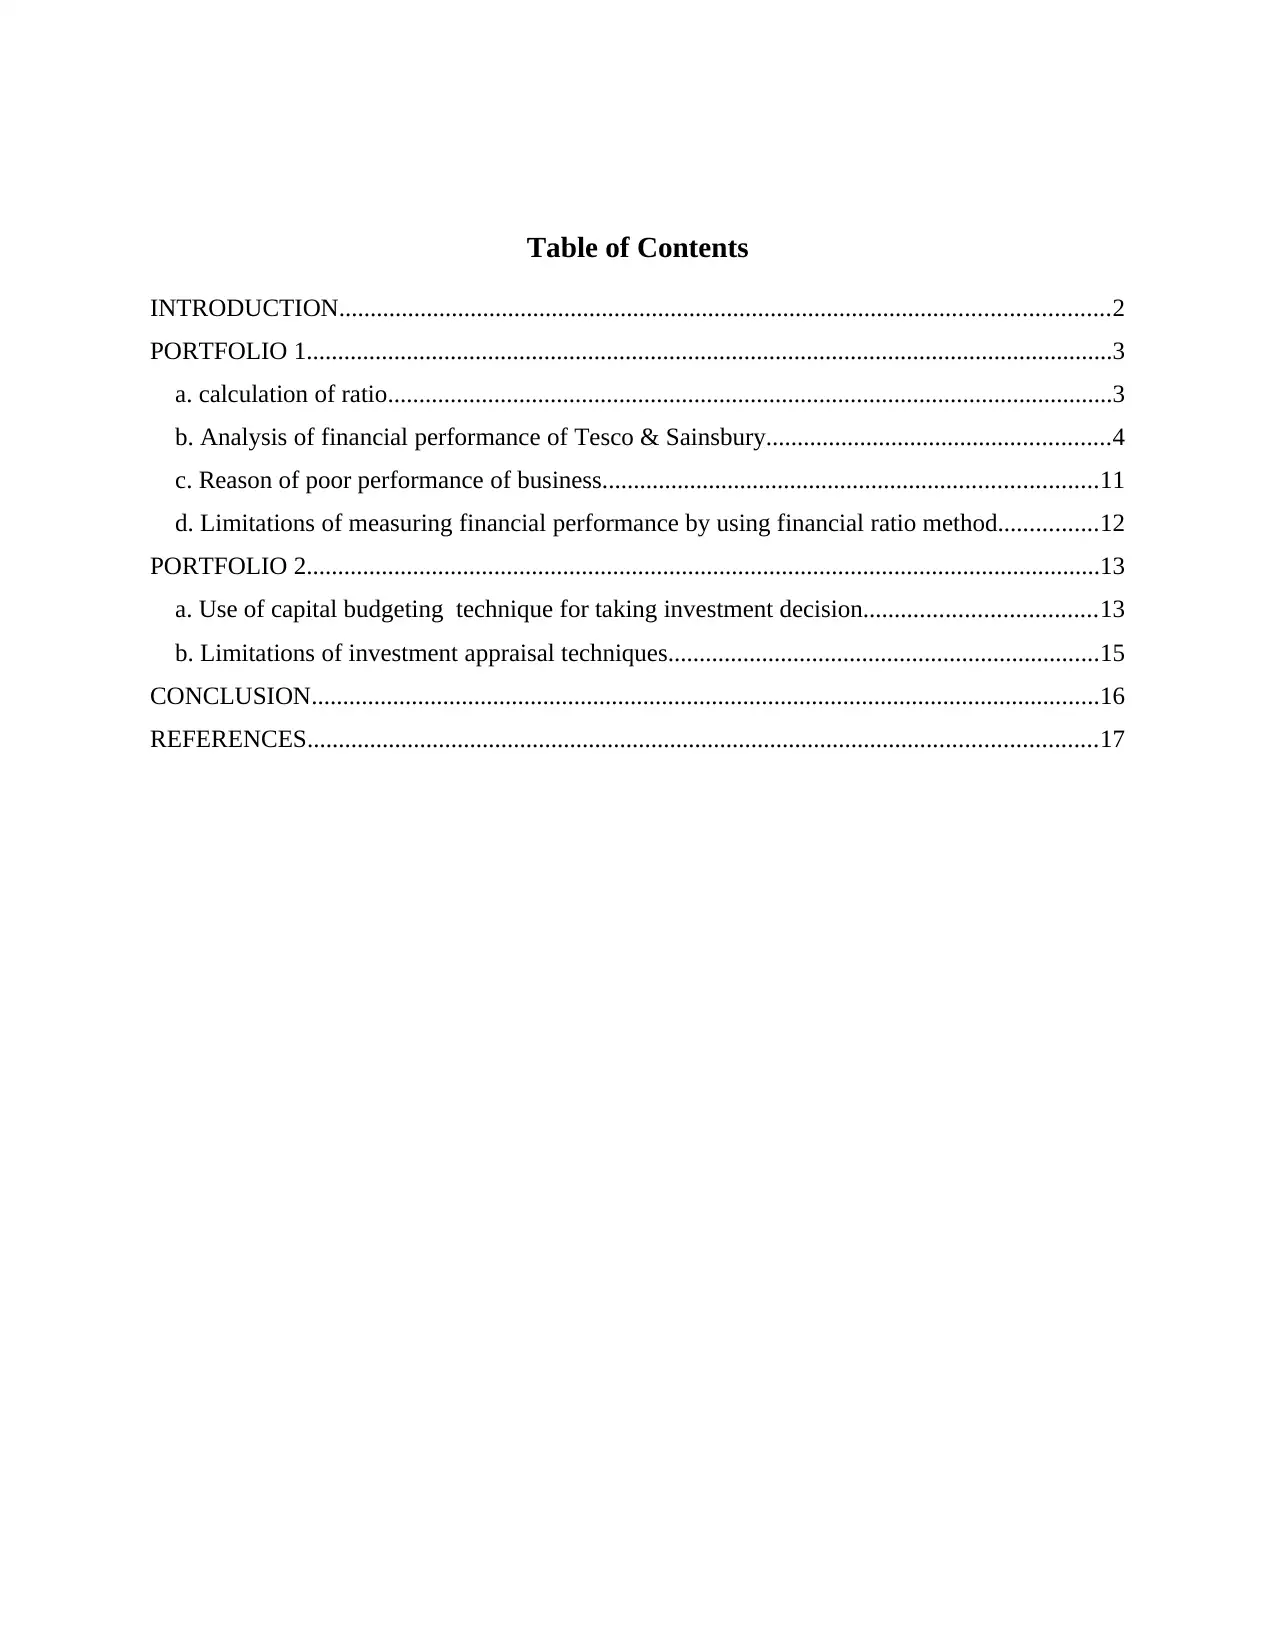
Table of Contents
INTRODUCTION...........................................................................................................................2
PORTFOLIO 1.................................................................................................................................3
a. calculation of ratio....................................................................................................................3
b. Analysis of financial performance of Tesco & Sainsbury.......................................................4
c. Reason of poor performance of business...............................................................................11
d. Limitations of measuring financial performance by using financial ratio method................12
PORTFOLIO 2...............................................................................................................................13
a. Use of capital budgeting technique for taking investment decision.....................................13
b. Limitations of investment appraisal techniques.....................................................................15
CONCLUSION..............................................................................................................................16
REFERENCES..............................................................................................................................17
INTRODUCTION
Managerial finance is consider as branch of finance, which managers use to
systematically collect and allocate their financial resource for systematic run business activities.
This will useful in create value for the organization. To understand this concept this report has
been formulate. It divided in two part. This first portfolio is related with measuring financial
performance of Sainsbury and Tesco, by using financial ratio. Tesco and Sainsbury both run their
business in super market sector. This report define which organization is beneficial for investors
for investment purpose. In second portfolio relevance and limitations of investment appraisal
technique has been define in systematic manner.
PORTFOLIO 1
a. calculation of ratio
Ratio analysis: This is consider as tool of financial management which is used by
organizations for measure their financial performance. The term ratio define relationship
between two elements . Managers apply this tool for recognizing relation of specific item of
financial statement. This will useful for measure the performance in effective way. Tesco and
Sainsbury both are well established organization of UK. They are rival companies. With the use
of ratio manager can easily identify which organization gives satisfactory work performance as
compare to other (Bontempo, 2019).
Particular Formula Sainsbury
2018 2019
Tesco
2018 2019
Current ratio Current
assets /
Current
liabilities
7857/ 10302 =
0.76
7581 / 11417
= 0.66
13600/ 19233
=0.71
12570/20980
=0.61
Quick ratio Quick assets/
Current
6047/ 10302 =
0.59
5652/11417 =
0.50
11336/ 19233
= 0.57
9953/ 20680 =
0.48
⊘ This is a preview!⊘
Do you want full access?
Subscribe today to unlock all pages.
Trusted by 1+ million students worldwide
liabilities
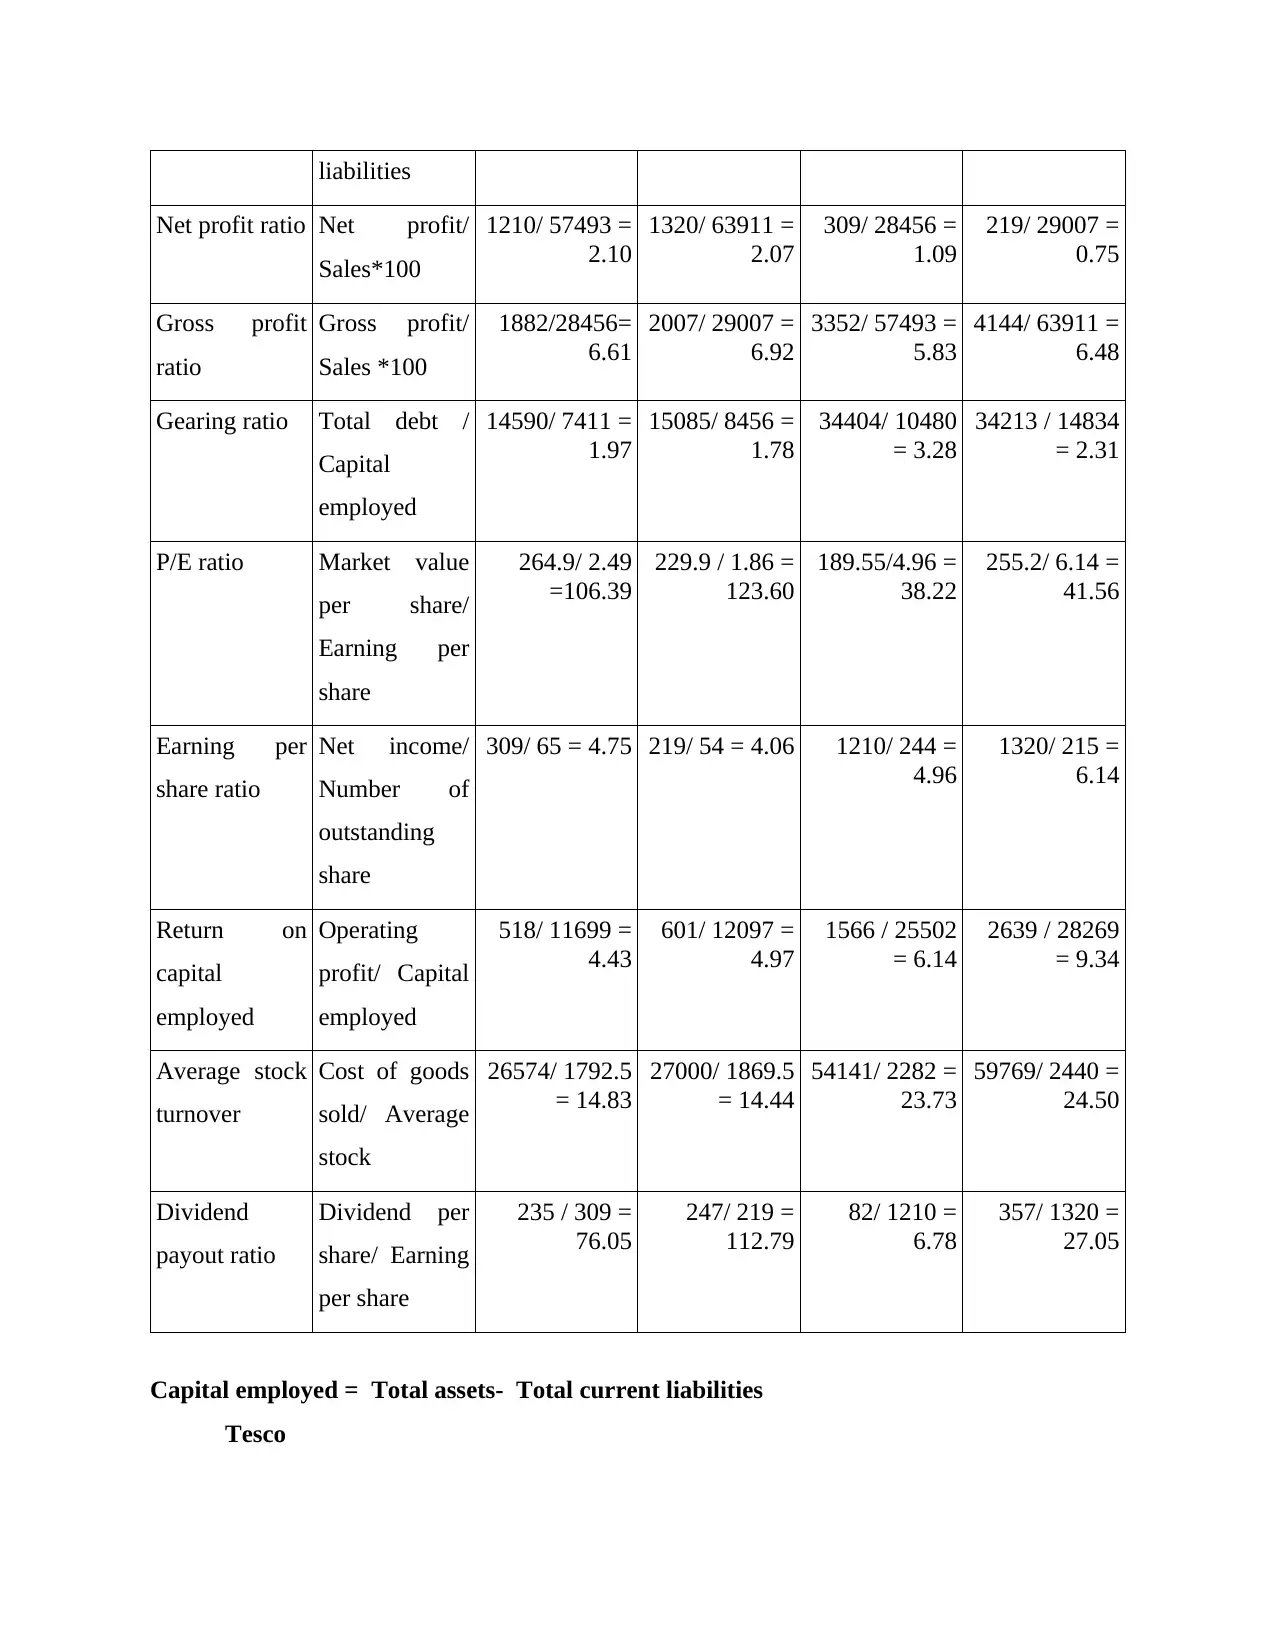
Net profit ratio Net profit/
Sales*100
1210/ 57493 =
2.10
1320/ 63911 =
2.07
309/ 28456 =
1.09
219/ 29007 =
0.75
Gross profit
ratio
Gross profit/
Sales *100
1882/28456=
6.61
2007/ 29007 =
6.92
3352/ 57493 =
5.83
4144/ 63911 =
6.48
Gearing ratio Total debt /
Capital
employed
14590/ 7411 =
1.97
15085/ 8456 =
1.78
34404/ 10480
= 3.28
34213 / 14834
= 2.31
P/E ratio Market value
per share/
Earning per
share
264.9/ 2.49
=106.39
229.9 / 1.86 =
123.60
189.55/4.96 =
38.22
255.2/ 6.14 =
41.56
Earning per
share ratio
Net income/
Number of
outstanding
share
309/ 65 = 4.75 219/ 54 = 4.06 1210/ 244 =
4.96
1320/ 215 =
6.14
Return on
capital
employed
Operating
profit/ Capital
employed
518/ 11699 =
4.43
601/ 12097 =
4.97
1566 / 25502
= 6.14
2639 / 28269
= 9.34
Average stock
turnover
Cost of goods
sold/ Average
stock
26574/ 1792.5
= 14.83
27000/ 1869.5
= 14.44
54141/ 2282 =
23.73
59769/ 2440 =
24.50
Dividend
payout ratio
Dividend per
share/ Earning
per share
235 / 309 =
76.05
247/ 219 =
112.79
82/ 1210 =
6.78
357/ 1320 =
27.05
Capital employed = Total assets- Total current liabilities
Tesco
Paraphrase This Document
Need a fresh take? Get an instant paraphrase of this document with our AI Paraphraser
2018 2019
44735 – 19233 = 25502 48949 – 20680 = 28269
Sainsbury
2018 2019
22001 – 10302 = 11699 23514 – 11417 = 12097
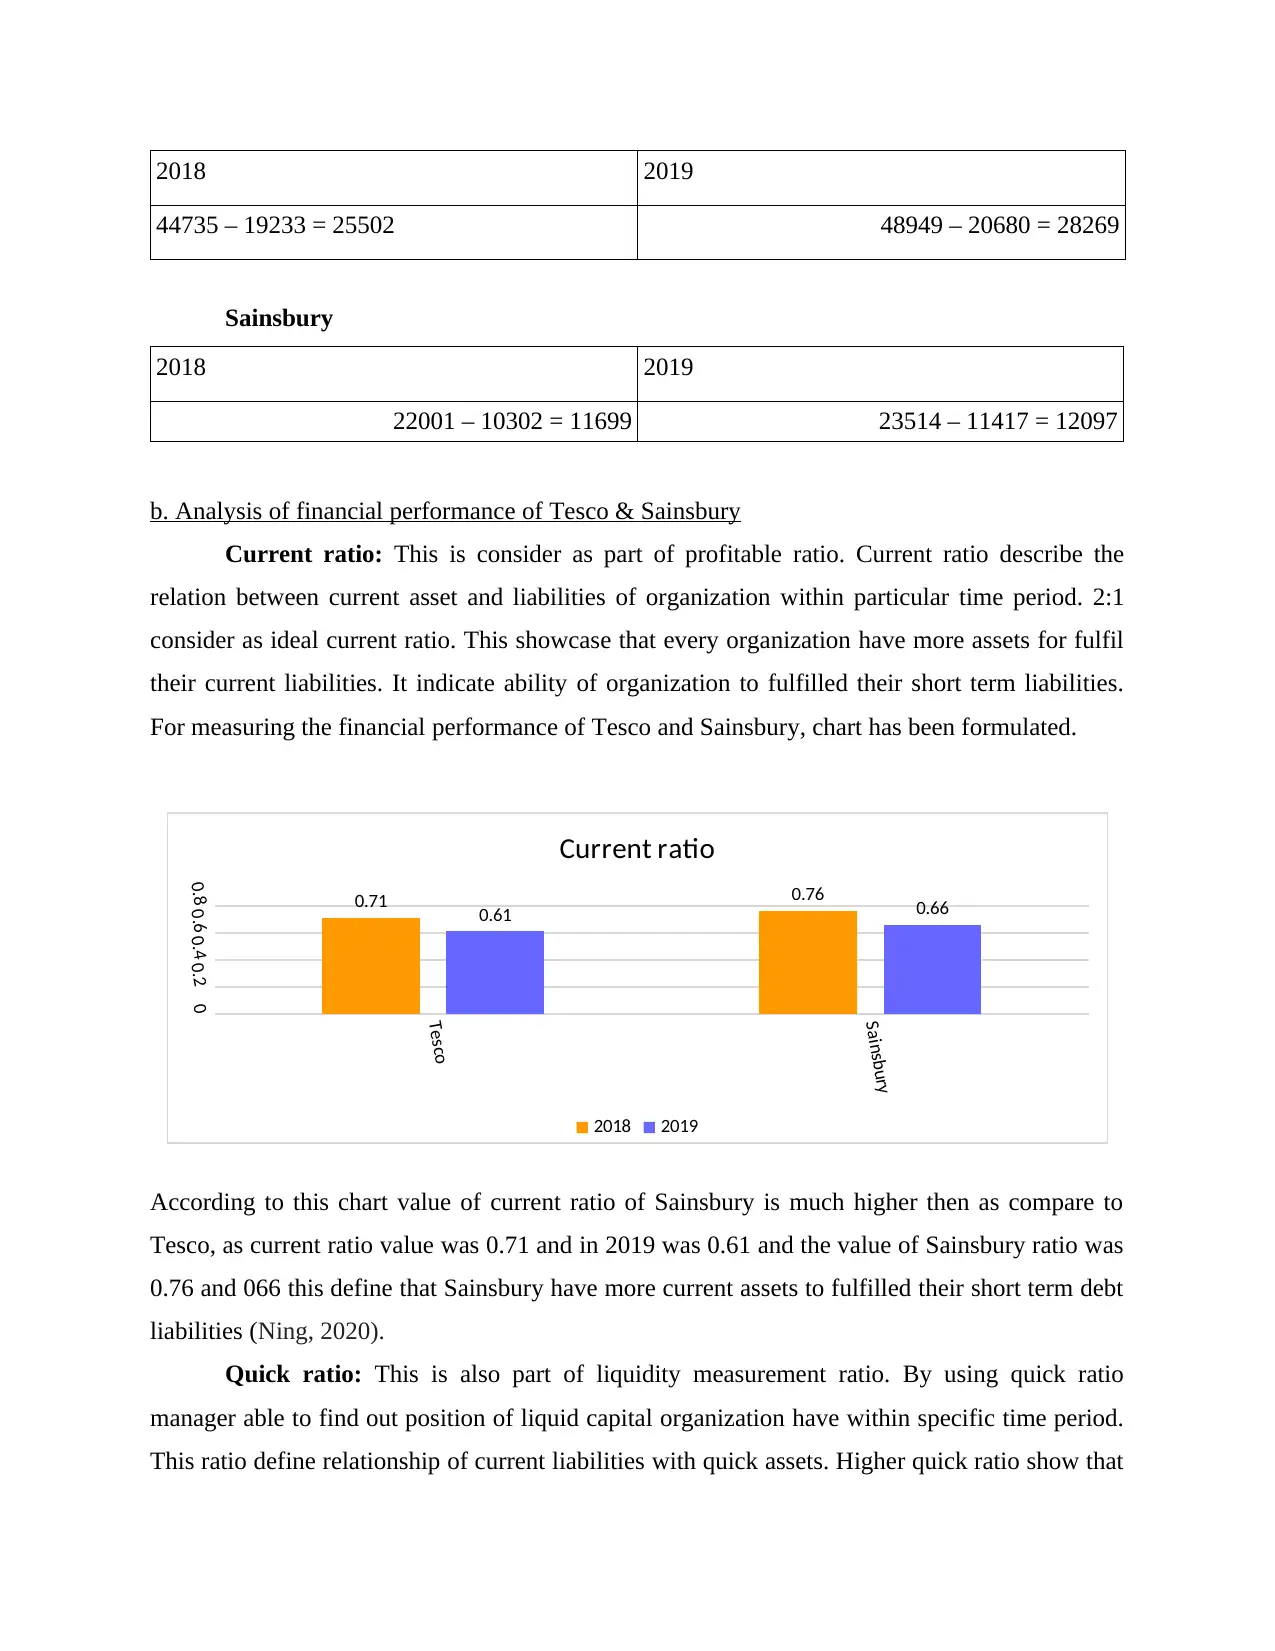
b. Analysis of financial performance of Tesco & Sainsbury
Current ratio: This is consider as part of profitable ratio. Current ratio describe the
relation between current asset and liabilities of organization within particular time period. 2:1
consider as ideal current ratio. This showcase that every organization have more assets for fulfil
their current liabilities. It indicate ability of organization to fulfilled their short term liabilities.
For measuring the financial performance of Tesco and Sainsbury, chart has been formulated.
According to this chart value of current ratio of Sainsbury is much higher then as compare to
Tesco, as current ratio value was 0.71 and in 2019 was 0.61 and the value of Sainsbury ratio was
0.76 and 066 this define that Sainsbury have more current assets to fulfilled their short term debt
liabilities (Ning, 2020).
Quick ratio: This is also part of liquidity measurement ratio. By using quick ratio
manager able to find out position of liquid capital organization have within specific time period.
This ratio define relationship of current liabilities with quick assets. Higher quick ratio show that
Tesco
Sainsbury
00.20.40.60.8 0.71 0.76
0.61 0.66
Current ratio
2018 2019
44735 – 19233 = 25502 48949 – 20680 = 28269
Sainsbury
2018 2019
22001 – 10302 = 11699 23514 – 11417 = 12097
b. Analysis of financial performance of Tesco & Sainsbury
Current ratio: This is consider as part of profitable ratio. Current ratio describe the
relation between current asset and liabilities of organization within particular time period. 2:1
consider as ideal current ratio. This showcase that every organization have more assets for fulfil
their current liabilities. It indicate ability of organization to fulfilled their short term liabilities.
For measuring the financial performance of Tesco and Sainsbury, chart has been formulated.
According to this chart value of current ratio of Sainsbury is much higher then as compare to
Tesco, as current ratio value was 0.71 and in 2019 was 0.61 and the value of Sainsbury ratio was
0.76 and 066 this define that Sainsbury have more current assets to fulfilled their short term debt
liabilities (Ning, 2020).
Quick ratio: This is also part of liquidity measurement ratio. By using quick ratio
manager able to find out position of liquid capital organization have within specific time period.
This ratio define relationship of current liabilities with quick assets. Higher quick ratio show that
Tesco
Sainsbury
00.20.40.60.8 0.71 0.76
0.61 0.66
Current ratio
2018 2019
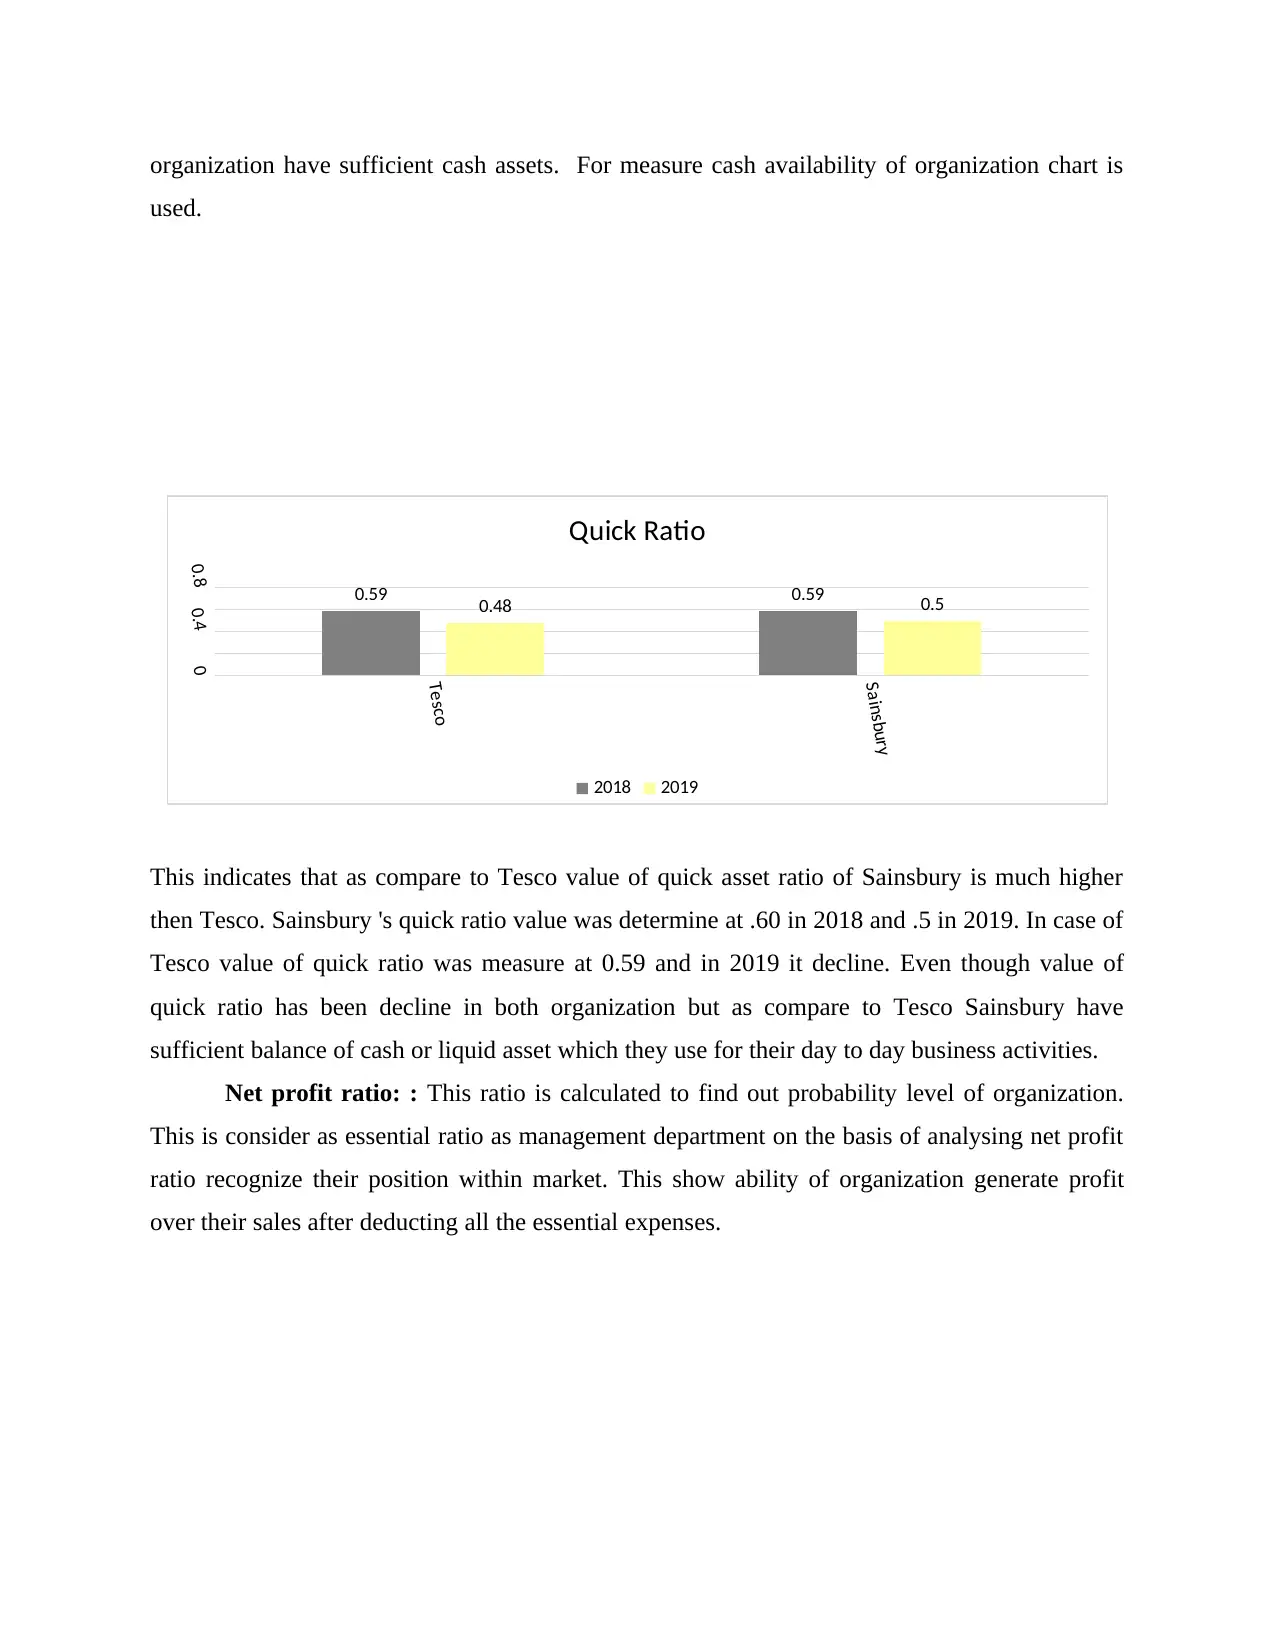
organization have sufficient cash assets. For measure cash availability of organization chart is
used.
This indicates that as compare to Tesco value of quick asset ratio of Sainsbury is much higher
then Tesco. Sainsbury 's quick ratio value was determine at .60 in 2018 and .5 in 2019. In case of
Tesco value of quick ratio was measure at 0.59 and in 2019 it decline. Even though value of
quick ratio has been decline in both organization but as compare to Tesco Sainsbury have
sufficient balance of cash or liquid asset which they use for their day to day business activities.
Net profit ratio: : This ratio is calculated to find out probability level of organization.
This is consider as essential ratio as management department on the basis of analysing net profit
ratio recognize their position within market. This show ability of organization generate profit
over their sales after deducting all the essential expenses.
Tesco
Sainsbury
00.40.8 0.59 0.59
0.48 0.5
Quick Ratio
2018 2019
⊘ This is a preview!⊘
Do you want full access?
Subscribe today to unlock all pages.
Trusted by 1+ million students worldwide
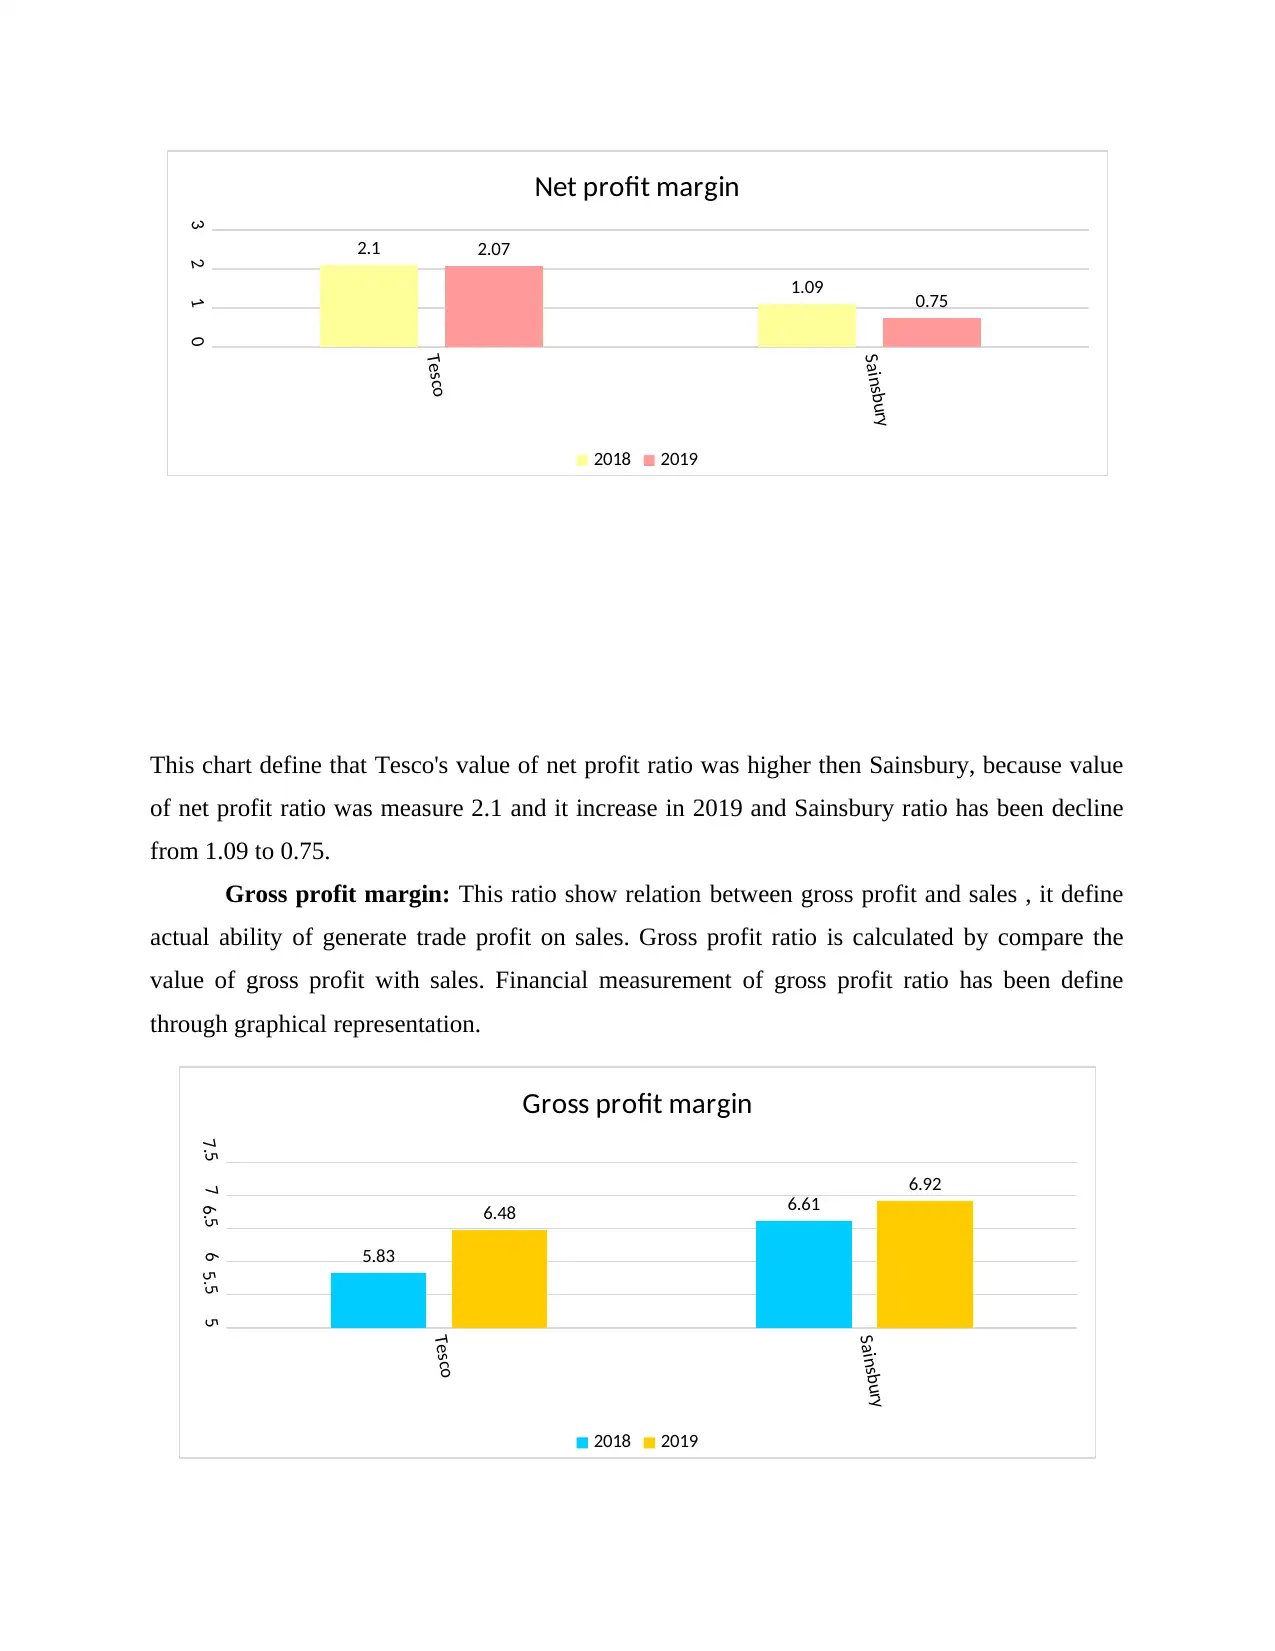
This chart define that Tesco's value of net profit ratio was higher then Sainsbury, because value
of net profit ratio was measure 2.1 and it increase in 2019 and Sainsbury ratio has been decline
from 1.09 to 0.75.
Gross profit margin: This ratio show relation between gross profit and sales , it define
actual ability of generate trade profit on sales. Gross profit ratio is calculated by compare the
value of gross profit with sales. Financial measurement of gross profit ratio has been define
through graphical representation.
Tesco
Sainsbury
0123
2.1
1.09
2.07
0.75
Net profit margin
2018 2019
Tesco
Sainsbury
55.566.577.5
5.83
6.616.48
6.92
Gross profit margin
2018 2019
Paraphrase This Document
Need a fresh take? Get an instant paraphrase of this document with our AI Paraphraser
The value of gross profit ratio of Sainsbury is as much better then Tesco. This indicates
that Sainsbury generate more gross profit as compare to Tesco.
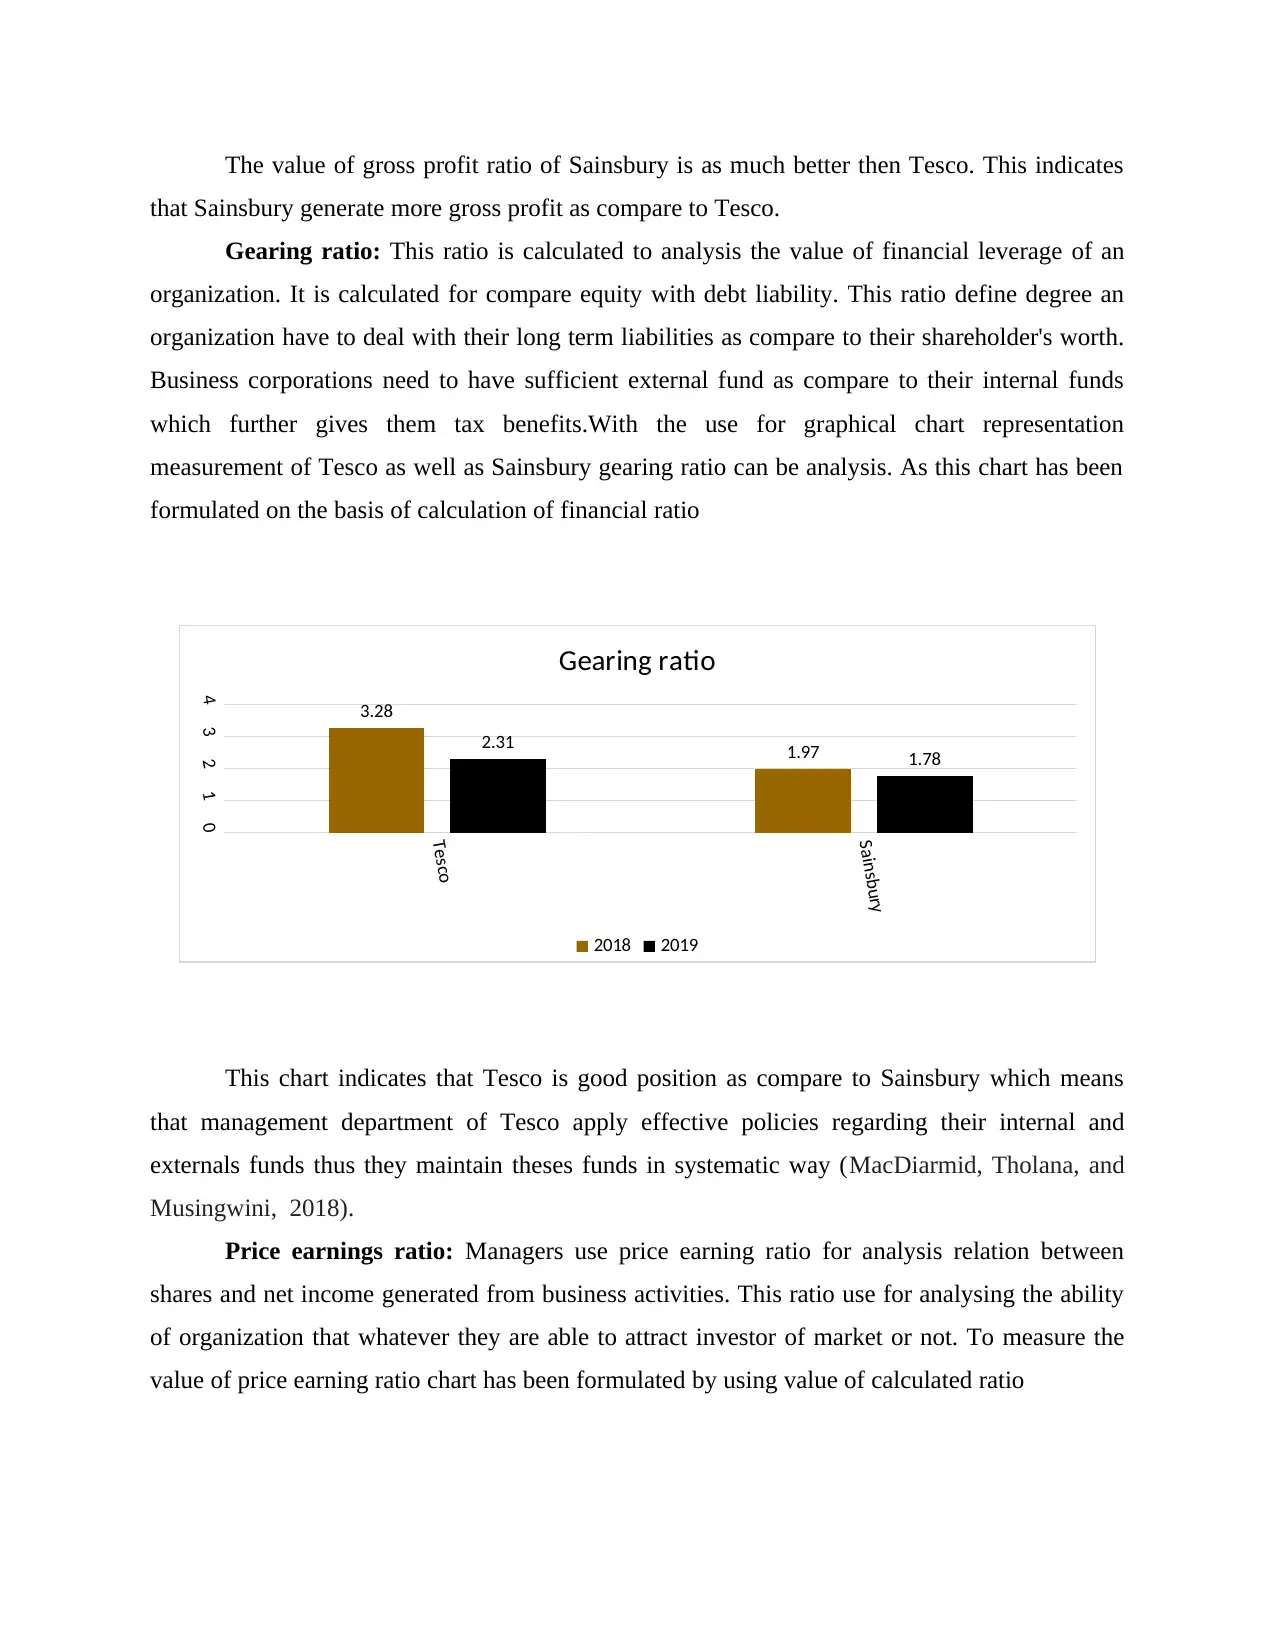
Gearing ratio: This ratio is calculated to analysis the value of financial leverage of an
organization. It is calculated for compare equity with debt liability. This ratio define degree an
organization have to deal with their long term liabilities as compare to their shareholder's worth.
Business corporations need to have sufficient external fund as compare to their internal funds
which further gives them tax benefits.With the use for graphical chart representation
measurement of Tesco as well as Sainsbury gearing ratio can be analysis. As this chart has been
formulated on the basis of calculation of financial ratio
This chart indicates that Tesco is good position as compare to Sainsbury which means
that management department of Tesco apply effective policies regarding their internal and
externals funds thus they maintain theses funds in systematic way (MacDiarmid, Tholana, and
Musingwini, 2018).
Price earnings ratio: Managers use price earning ratio for analysis relation between
shares and net income generated from business activities. This ratio use for analysing the ability
of organization that whatever they are able to attract investor of market or not. To measure the
value of price earning ratio chart has been formulated by using value of calculated ratio
Tesco
Sainsbury
01234 3.28
1.97
2.31 1.78
Gearing ratio
2018 2019
that Sainsbury generate more gross profit as compare to Tesco.
Gearing ratio: This ratio is calculated to analysis the value of financial leverage of an
organization. It is calculated for compare equity with debt liability. This ratio define degree an
organization have to deal with their long term liabilities as compare to their shareholder's worth.
Business corporations need to have sufficient external fund as compare to their internal funds
which further gives them tax benefits.With the use for graphical chart representation
measurement of Tesco as well as Sainsbury gearing ratio can be analysis. As this chart has been
formulated on the basis of calculation of financial ratio
This chart indicates that Tesco is good position as compare to Sainsbury which means
that management department of Tesco apply effective policies regarding their internal and
externals funds thus they maintain theses funds in systematic way (MacDiarmid, Tholana, and
Musingwini, 2018).
Price earnings ratio: Managers use price earning ratio for analysis relation between
shares and net income generated from business activities. This ratio use for analysing the ability
of organization that whatever they are able to attract investor of market or not. To measure the
value of price earning ratio chart has been formulated by using value of calculated ratio
Tesco
Sainsbury
01234 3.28
1.97
2.31 1.78
Gearing ratio
2018 2019
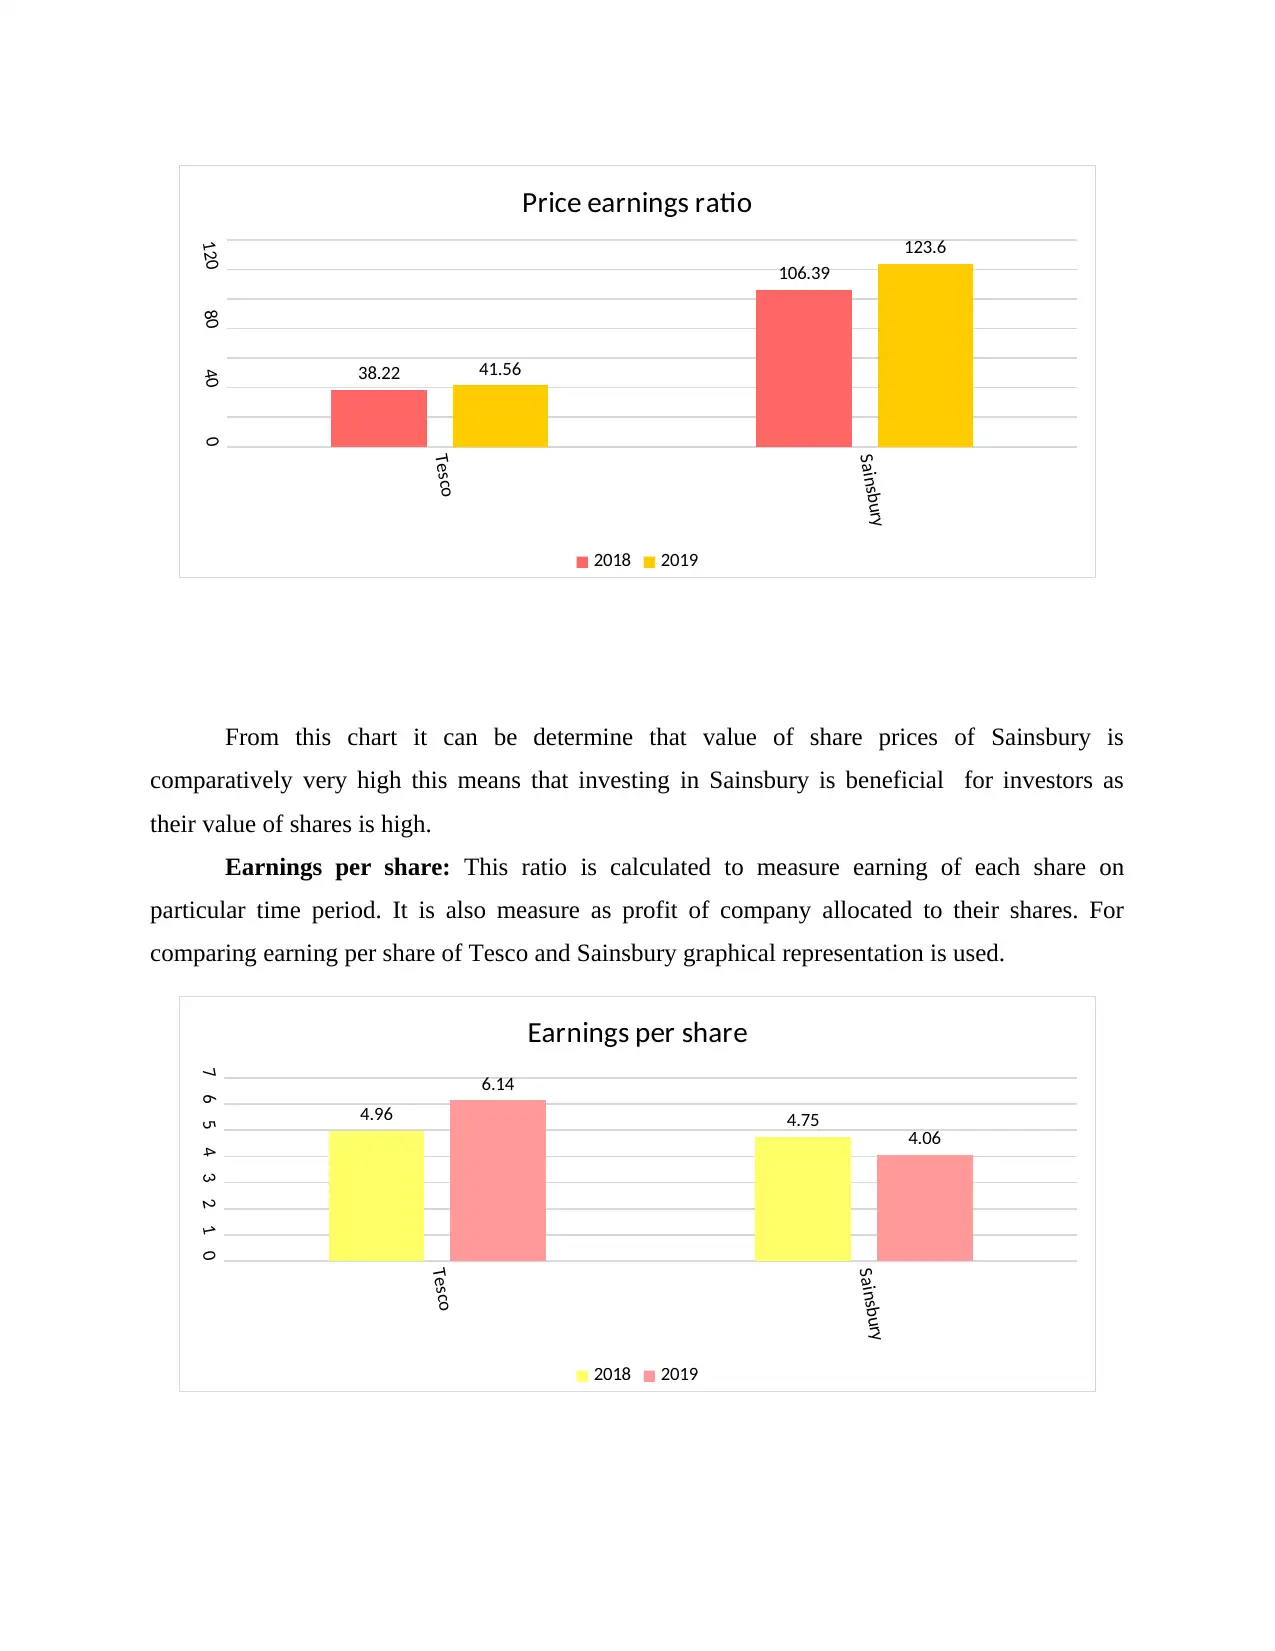
From this chart it can be determine that value of share prices of Sainsbury is
comparatively very high this means that investing in Sainsbury is beneficial for investors as
their value of shares is high.
Earnings per share: This ratio is calculated to measure earning of each share on
particular time period. It is also measure as profit of company allocated to their shares. For
comparing earning per share of Tesco and Sainsbury graphical representation is used.
Tesco
Sainsbury
0
40
80
120
38.22
106.39
41.56
123.6
Price earnings ratio
2018 2019
Tesco
Sainsbury
01234567
4.96 4.75
6.14
4.06
Earnings per share
2018 2019
⊘ This is a preview!⊘
Do you want full access?
Subscribe today to unlock all pages.
Trusted by 1+ million students worldwide
Value of Tesco 's earning per share was 4.96 in 2018 and 6.14 in 2019 and Sainsbury was
calculated 4.75 in 2018 and 4.06 in 2019. Which means that Tesco is at better position and their
share have more worth then as compare to its rival organization.
Return on capital employed: Managers calculated this ratio for measure the ability of
using capital to generate profits. This is part of profitability ratio., and it showcase relationship
between capital employed with profits. To measure the value of this ratio chart is formulated
According to this representation it is identify that value of capital employed of Tesco is
much higher then Sainsbury. Which means that Tesco operate their organization activities in
comparatively more systematic manner. Even though the rate on capital employed is increases in
both corporations how ever for comparison purpose Tesco is much better condition.
Stock turnover ratio: This ratio indicates time organization take for converting their raw
material into finished goods and sale them in market. It is used to measure the time stock has
been sold out. Higher ratio show that organization take more time to convert their inventories.
Tesco
Sainsbury
012345678910
6.14
4.43
9.34
4.97
Return on capital employed
2018 2019
Paraphrase This Document
Need a fresh take? Get an instant paraphrase of this document with our AI Paraphraser
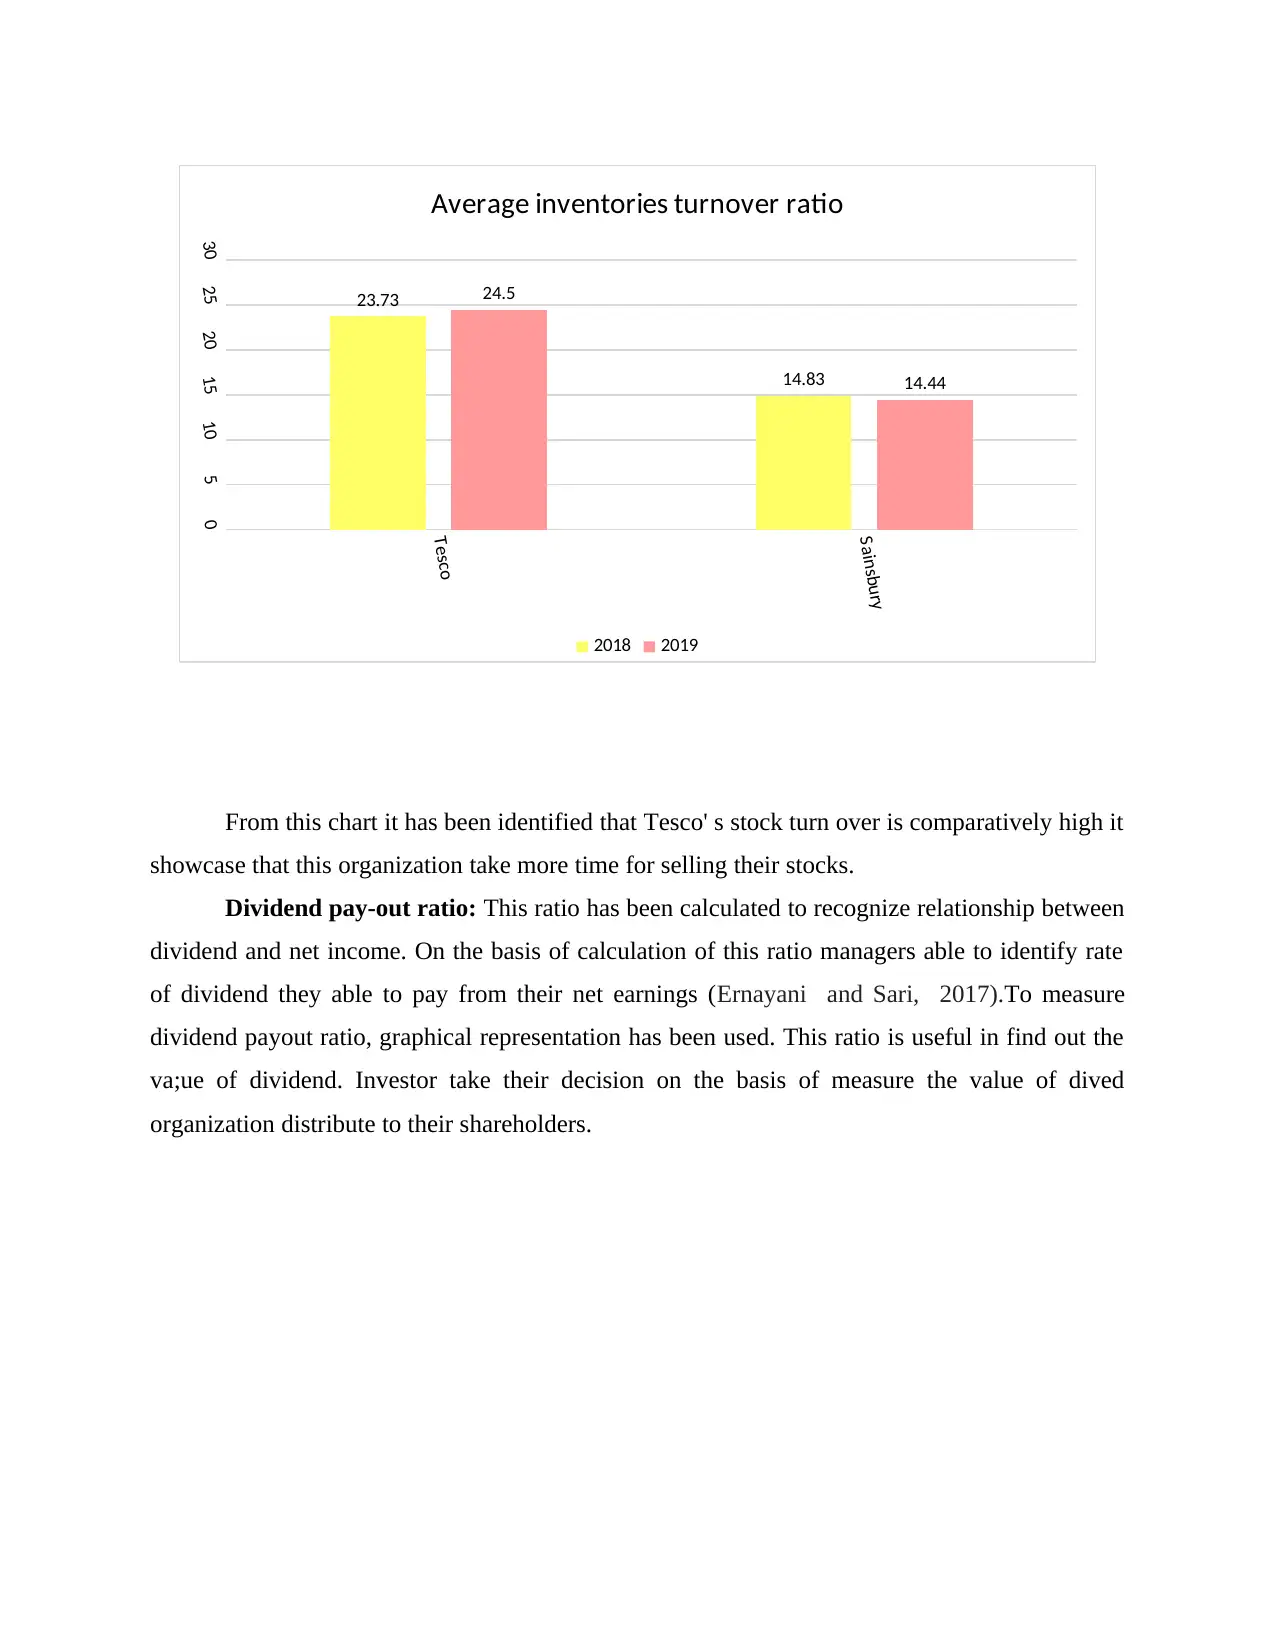
From this chart it has been identified that Tesco' s stock turn over is comparatively high it
showcase that this organization take more time for selling their stocks.
Dividend pay-out ratio: This ratio has been calculated to recognize relationship between
dividend and net income. On the basis of calculation of this ratio managers able to identify rate
of dividend they able to pay from their net earnings (Ernayani and Sari, 2017).To measure
dividend payout ratio, graphical representation has been used. This ratio is useful in find out the
va;ue of dividend. Investor take their decision on the basis of measure the value of dived
organization distribute to their shareholders.
Tesco
Sainsbury
051015202530
23.73
14.83
24.5
14.44
Average inventories turnover ratio
2018 2019
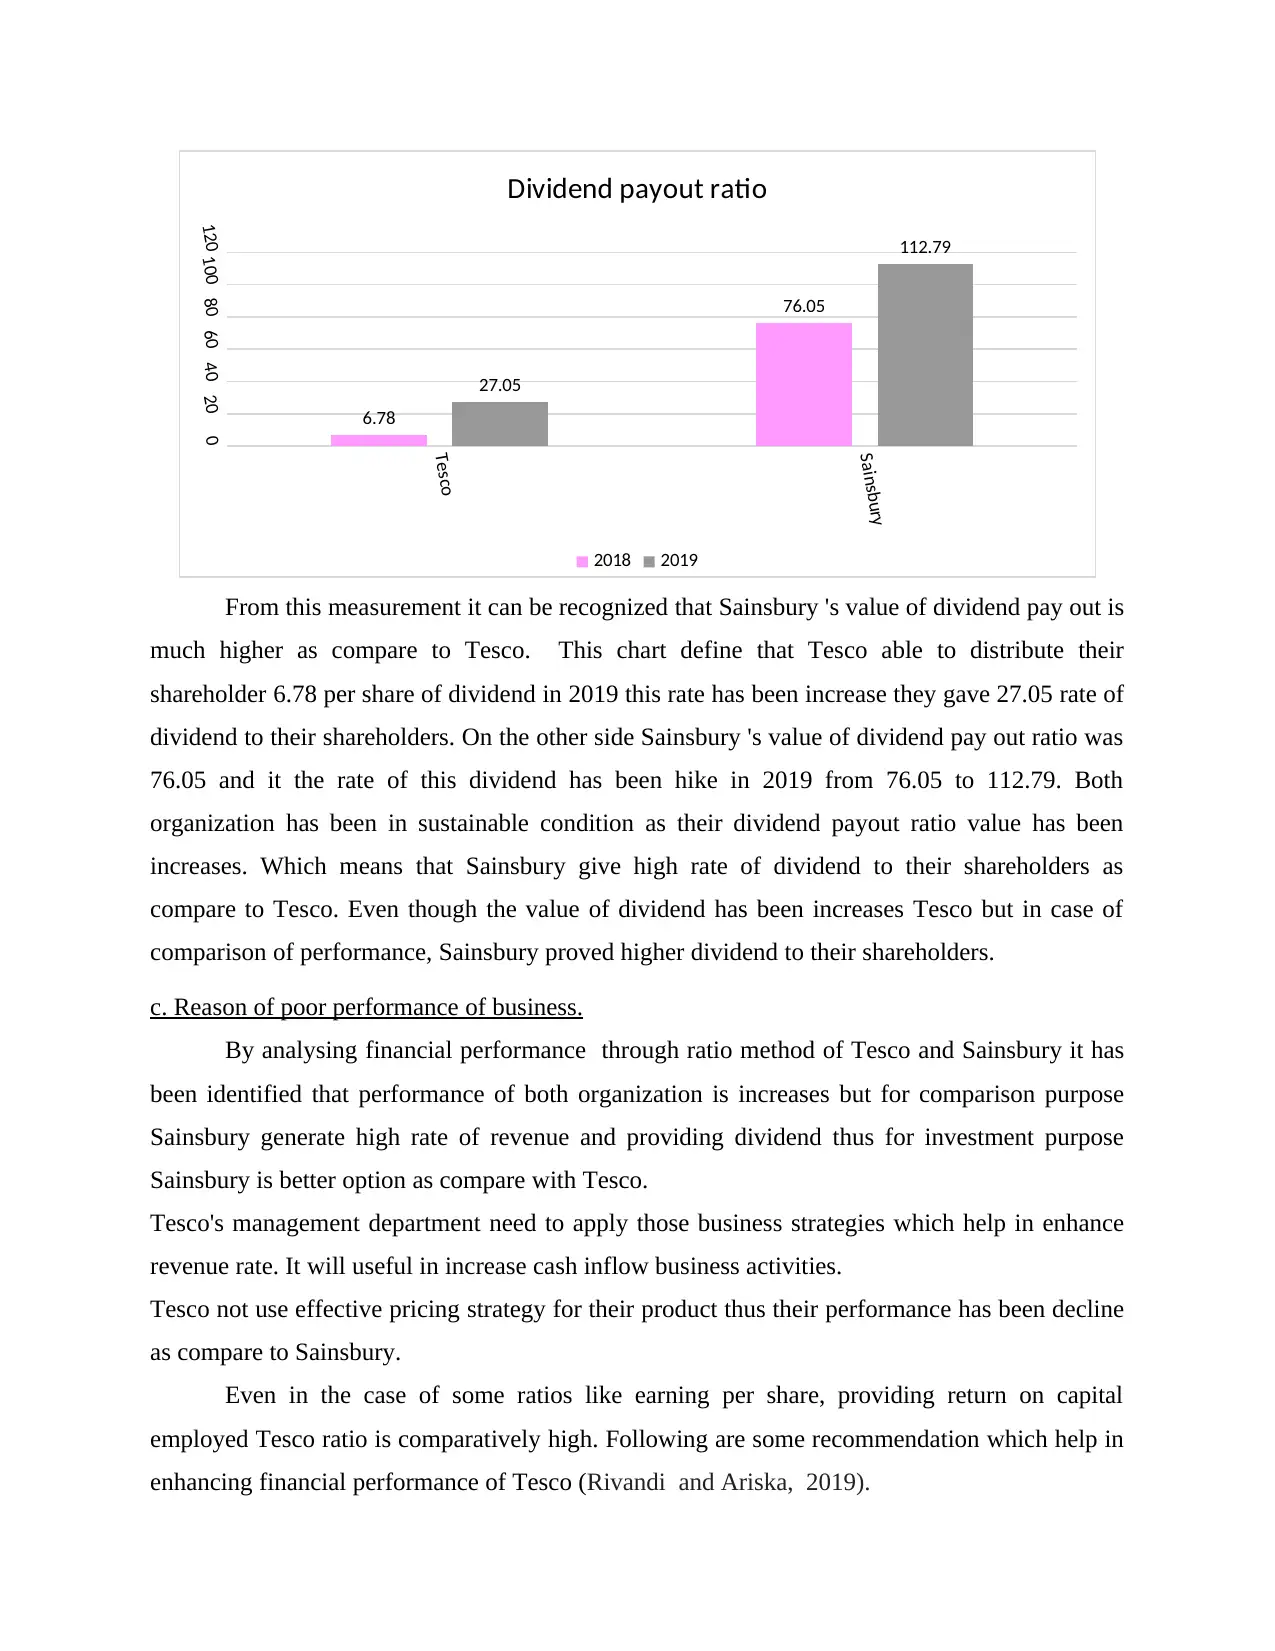
From this measurement it can be recognized that Sainsbury 's value of dividend pay out is
much higher as compare to Tesco. This chart define that Tesco able to distribute their
shareholder 6.78 per share of dividend in 2019 this rate has been increase they gave 27.05 rate of
dividend to their shareholders. On the other side Sainsbury 's value of dividend pay out ratio was
76.05 and it the rate of this dividend has been hike in 2019 from 76.05 to 112.79. Both
organization has been in sustainable condition as their dividend payout ratio value has been
increases. Which means that Sainsbury give high rate of dividend to their shareholders as
compare to Tesco. Even though the value of dividend has been increases Tesco but in case of
comparison of performance, Sainsbury proved higher dividend to their shareholders.
c. Reason of poor performance of business.
By analysing financial performance through ratio method of Tesco and Sainsbury it has
been identified that performance of both organization is increases but for comparison purpose
Sainsbury generate high rate of revenue and providing dividend thus for investment purpose
Sainsbury is better option as compare with Tesco.
Tesco's management department need to apply those business strategies which help in enhance
revenue rate. It will useful in increase cash inflow business activities.
Tesco not use effective pricing strategy for their product thus their performance has been decline
as compare to Sainsbury.
Even in the case of some ratios like earning per share, providing return on capital
employed Tesco ratio is comparatively high. Following are some recommendation which help in
enhancing financial performance of Tesco (Rivandi and Ariska, 2019).
Tesco
Sainsbury
020406080100120
6.78
76.05
27.05
112.79
Dividend payout ratio
2018 2019
⊘ This is a preview!⊘
Do you want full access?
Subscribe today to unlock all pages.
Trusted by 1+ million students worldwide
1 out of 20
Related Documents


Your All-in-One AI-Powered Toolkit for Academic Success.
+13062052269
info@desklib.com
Available 24*7 on WhatsApp / Email
![[object Object]](/_next/static/media/star-bottom.7253800d.svg)
Unlock your academic potential
Copyright © 2020–2026 A2Z Services. All Rights Reserved. Developed and managed by ZUCOL.