Managerial Finance Report: Financial Analysis and Investment Appraisal
VerifiedAdded on 2022/12/30
|19
|3832
|83
Report
AI Summary
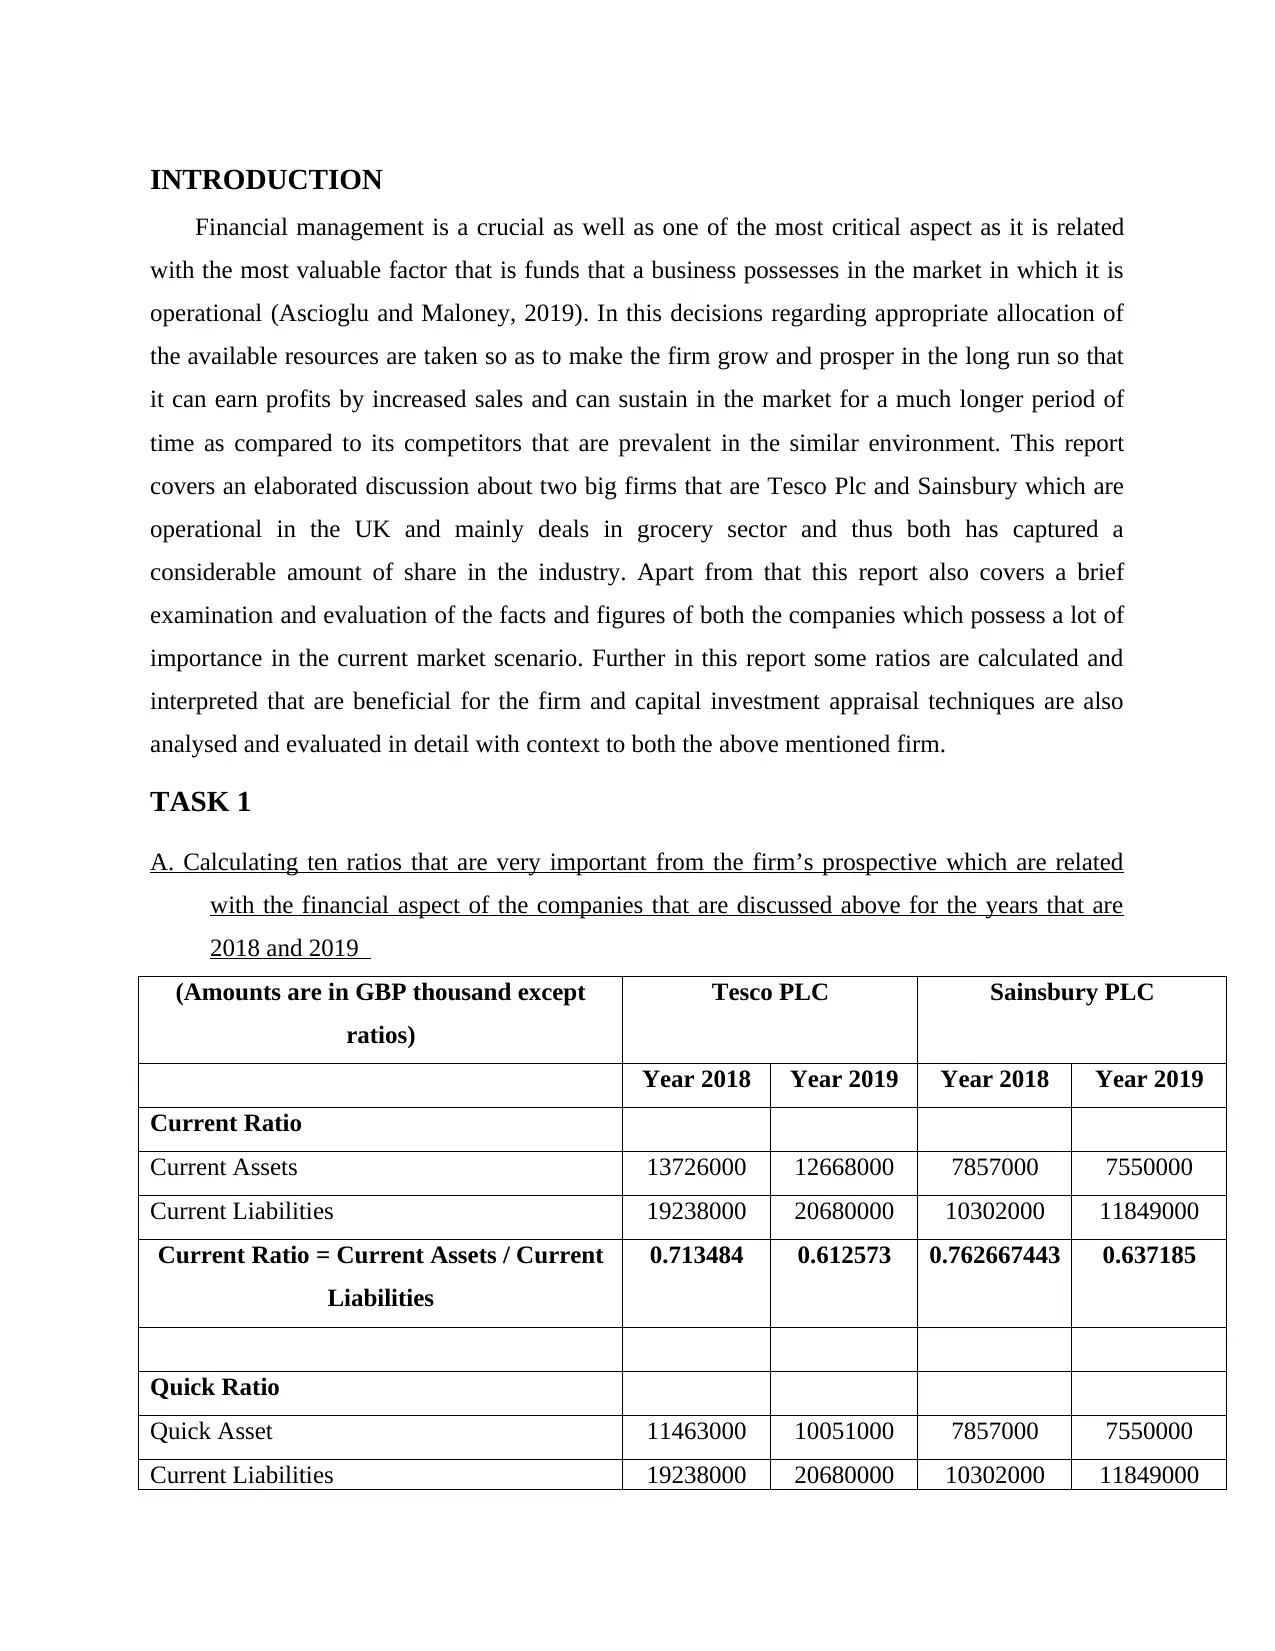
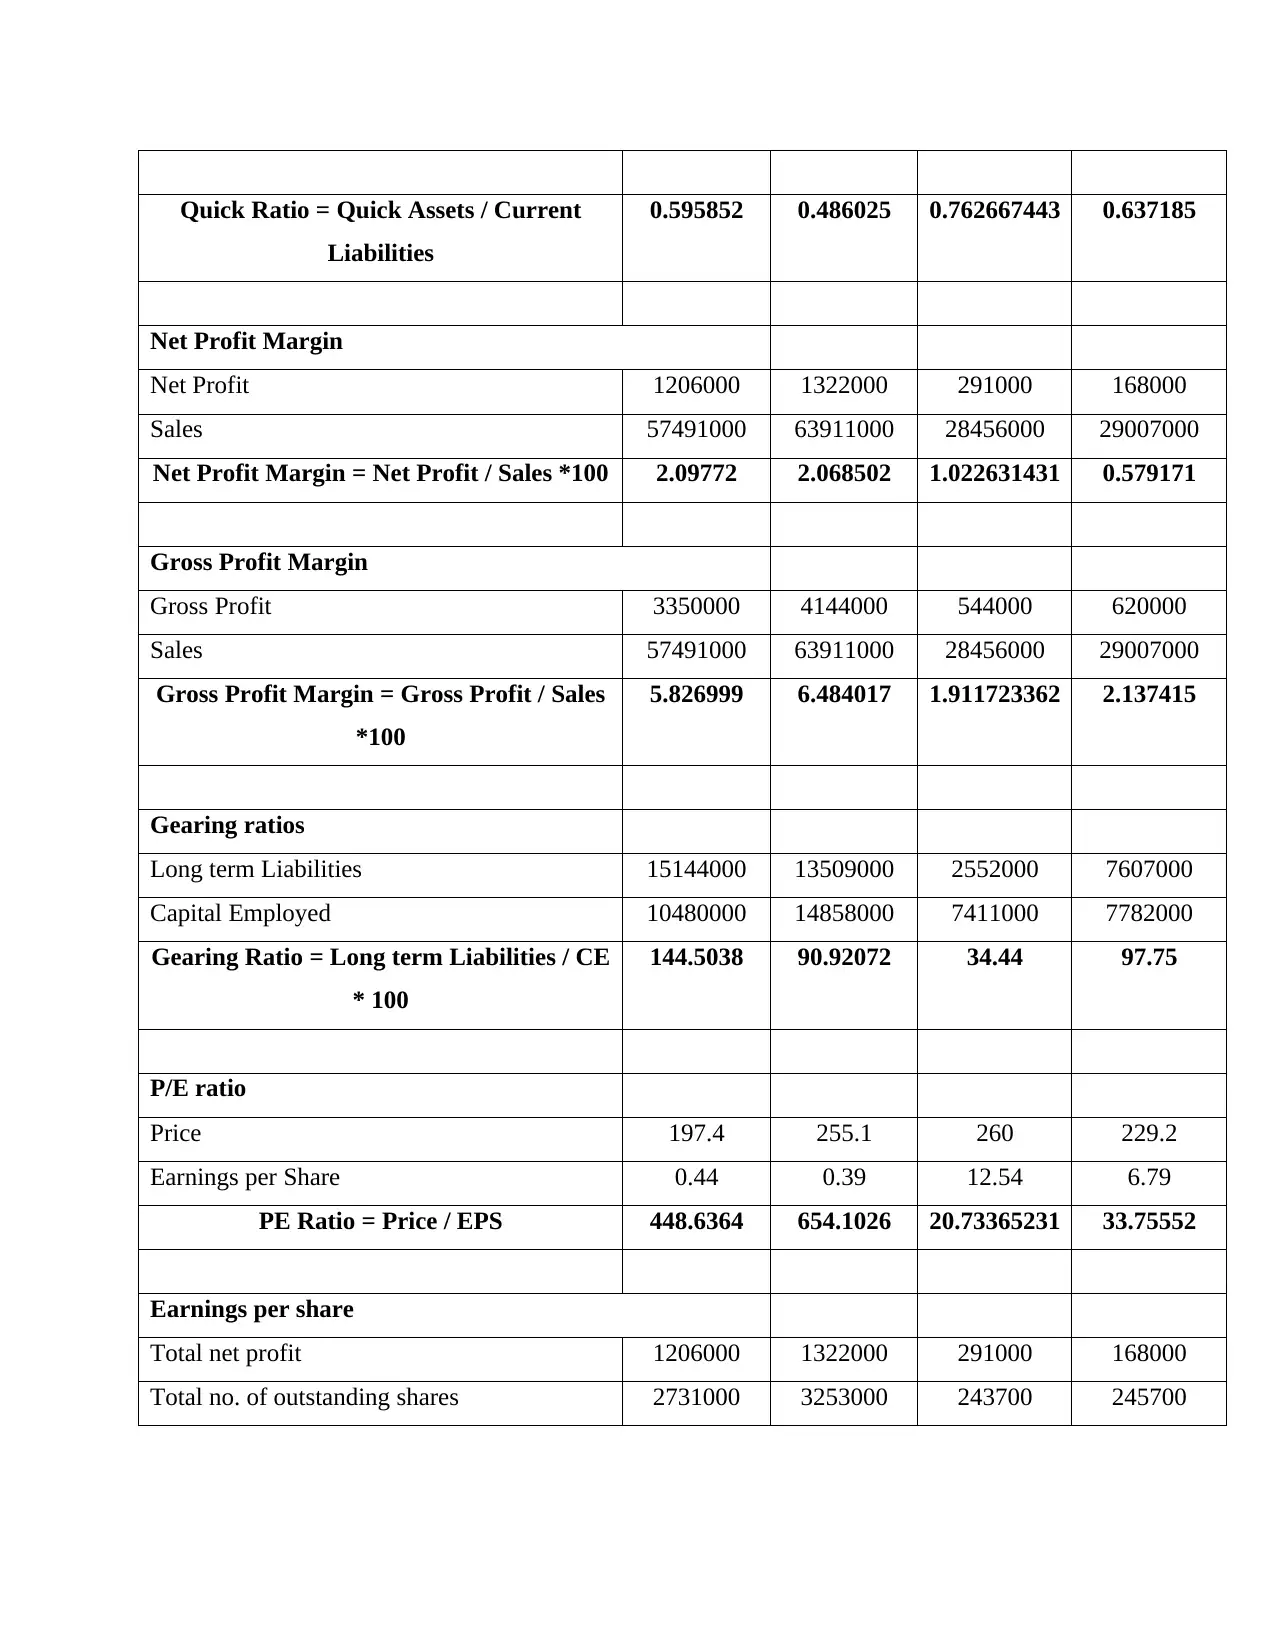
This report provides a comprehensive financial analysis of Tesco PLC and Sainsbury PLC, two major players in the UK grocery sector. It begins with an introduction to financial management and its importance in business decision-making. The core of the report involves calculating and interpreting ten key financial ratios for both companies for the years 2018 and 2019, including current ratio, quick ratio, net profit margin, gross profit margin, gearing ratio, P/E ratio, EPS, ROCE, average inventory turnover period, and dividend payout ratio. The analysis compares the financial performance of the two companies across these ratios, highlighting their strengths and weaknesses. Furthermore, the report delves into investment appraisal techniques, examining their calculation and limitations, particularly in long-term decision-making. Recommendations are provided for both Tesco and Sainsbury based on the financial analysis, along with a discussion of the limitations of relying solely on financial ratios. The report concludes with a summary of the key findings and insights.

Managerial finance
Paraphrase This Document
Need a fresh take? Get an instant paraphrase of this document with our AI Paraphraser

Contents
Contents...........................................................................................................................................2
INTRODUCTION...........................................................................................................................1
TASK 1............................................................................................................................................1
A. Calculating ten ratios that are very important from the firm’s prospective which are related
with the financial aspect of the companies that are discussed above for the years that are 2018
and 2019.......................................................................................................................................1
B. Detailed identification and examination of the facts and figures that are analysed above so
as to see a true and fair view of the financial position and their potential to invest in the market
.....................................................................................................................................................3
C. Necessary recommendations after evaluating the above facts and figures and their
interpretation................................................................................................................................9
D. Identification and examination of the limitations of relying on to ratios which are calculated
above and are related with the financial part of the company...................................................10
TASK 2..........................................................................................................................................10
A. Calculation and examination of investment appraisal techniques........................................10
B. Examination of the limitations of the investment appraisal techniques that are mentioned
above with context to decisions that are of long term in nature................................................13
CONCLUSION..............................................................................................................................14
REFERENCES..............................................................................................................................15

⊘ This is a preview!⊘
Do you want full access?
Subscribe today to unlock all pages.

Trusted by 1+ million students worldwide

INTRODUCTION
Financial management is a crucial as well as one of the most critical aspect as it is related
with the most valuable factor that is funds that a business possesses in the market in which it is
operational (Ascioglu and Maloney, 2019). In this decisions regarding appropriate allocation of
the available resources are taken so as to make the firm grow and prosper in the long run so that
it can earn profits by increased sales and can sustain in the market for a much longer period of
time as compared to its competitors that are prevalent in the similar environment. This report
covers an elaborated discussion about two big firms that are Tesco Plc and Sainsbury which are
operational in the UK and mainly deals in grocery sector and thus both has captured a
considerable amount of share in the industry. Apart from that this report also covers a brief
examination and evaluation of the facts and figures of both the companies which possess a lot of
importance in the current market scenario. Further in this report some ratios are calculated and
interpreted that are beneficial for the firm and capital investment appraisal techniques are also
analysed and evaluated in detail with context to both the above mentioned firm.
TASK 1
A. Calculating ten ratios that are very important from the firm’s prospective which are related
with the financial aspect of the companies that are discussed above for the years that are
2018 and 2019
(Amounts are in GBP thousand except
ratios)
Tesco PLC Sainsbury PLC
Year 2018 Year 2019 Year 2018 Year 2019
Current Ratio
Current Assets 13726000 12668000 7857000 7550000
Current Liabilities 19238000 20680000 10302000 11849000
Current Ratio = Current Assets / Current
Liabilities
0.713484 0.612573 0.762667443 0.637185
Quick Ratio
Quick Asset 11463000 10051000 7857000 7550000
Current Liabilities 19238000 20680000 10302000 11849000
Paraphrase This Document
Need a fresh take? Get an instant paraphrase of this document with our AI Paraphraser

Quick Ratio = Quick Assets / Current
Liabilities
0.595852 0.486025 0.762667443 0.637185
Net Profit Margin
Net Profit 1206000 1322000 291000 168000
Sales 57491000 63911000 28456000 29007000
Net Profit Margin = Net Profit / Sales *100 2.09772 2.068502 1.022631431 0.579171
Gross Profit Margin
Gross Profit 3350000 4144000 544000 620000
Sales 57491000 63911000 28456000 29007000
Gross Profit Margin = Gross Profit / Sales
*100
5.826999 6.484017 1.911723362 2.137415
Gearing ratios
Long term Liabilities 15144000 13509000 2552000 7607000
Capital Employed 10480000 14858000 7411000 7782000
Gearing Ratio = Long term Liabilities / CE
* 100
144.5038 90.92072 34.44 97.75
P/E ratio
Price 197.4 255.1 260 229.2
Earnings per Share 0.44 0.39 12.54 6.79
PE Ratio = Price / EPS 448.6364 654.1026 20.73365231 33.75552
Earnings per share
Total net profit 1206000 1322000 291000 168000
Total no. of outstanding shares 2731000 3253000 243700 245700

EPS = Net Profit / Total no. outstanding
shares
0.441596 0.406394 1.194091096 0.683761
Return on capital employed
EBIT 1564000 2077000 544000 620000
CE 10480000 14858000 7411000 7782000
ROCE = EBIT / CE 14.92366 13.979 7.340439887 7.967104
Average inventories turnover period
Net Sales 57491000 63911000 28456000 29007000
Average inventories 2282000 2440000 1792500 1869500
Average inventories turnover period = Net
Sales / Average Inventory
25.19325 26.19303 15.87503487 15.51591
Dividend pay-out ratio
DPS 0.03 0.11 9.7 10.2
EPS 0.44 0.39 12.54 6.79
Dividend pay-out ratio = DPS / EPS 0.068182 0.282051 0.773524721 1.502209
⊘ This is a preview!⊘
Do you want full access?
Subscribe today to unlock all pages.

Trusted by 1+ million students worldwide

B. Detailed identification and examination of the facts and figures that are analysed above so as
to see a true and fair view of the financial position and their potential to invest in the
market
Current Ratio- It is a ratio that helps in analysing and determining the paying potential
of the firm with the help of current assets by comparing it with current liabilities of the company.
It is ideal if the ratio is 2:1 that is if a business has two times current assets as compared to its
current liabilities. As from the above it can be clearly seen that both the firms are somewhat
equal in this regard as Tesco has 0.71 and 0.61 in 2018 and 2019 respectively while Sainsbury
have 0.76 and 0.64 in 2018 and 2019 respectively. Still it can be said that Tesco was a little
ahead in 2018, whereas Sainsbury surpassed from Tesco in 2019 (Biktimirov, 2016).
Paraphrase This Document
Need a fresh take? Get an instant paraphrase of this document with our AI Paraphraser

Quick Ratio- In this ratio aspects that are related to liquidity of the firm and that too of
short nature is analysed and evaluated in detail so that it can help in adding to the value of the
company in the long run. It can be seen from the above that this ratio of Tesco was 0.60 and 0.49
in 2018 and 2019, while Sainsbury’s ratio was 0.59 and 0.47 in 2018 and 2019 respectively.
Thus it can be said that there is a very little difference in this ratio but still Tesco has taken a lead
in it, though it is very minimal in quantity (Bouteska, 2019).

Net Profit Margin- In this ratio profit margin of the organisation is evaluated so that it
can help in determining the performance of the company so as to take necessary measures to
improve it. Tesco and Sainsbury’s net profit margin was 2.10, 1.02 and 2.07, 0.58 for the year
2018 and 2019 respectively and thus by this it can be concluded that Tesco is performing
exceptionally well in this regard and has surpassed the latter firm by a great margin (Cumming
and Johan, 2017).
Gross Profit Ratio- It is a ratio that helps in determining the profit margin in gross
amount so that all the prospects can be analysed in detail. In this aspect too Tesco has maintained
a considerable amount of margin and has surpassed Sainsbury by a good margin as in 2018 the
ratio was 5.83 and 1.91 respectively while it was 6.48 and 2.14 in 2019 respectively for both the
firms and Tesco is performing in an effective was that helped it in increased its profitability level
(Koutsokostas and Papathanasiou, 2017).
⊘ This is a preview!⊘
Do you want full access?
Subscribe today to unlock all pages.

Trusted by 1+ million students worldwide

Gearing ratio- Long term debt of the company with reference to the capital that has been
employed in the business is examined in this ratio and thus possesses a lot of value in the current
scenario. From the above it can be seen that in the year 2018 Tesco was performing pretty well
as its ratio was 144.50 as compared to 34.44 of Sainsbury’s, but in 2019 Sainsbury drastically
managed to increase it to 97.75 while Tesco’s gearing ratio decreased to 90.92. Thus it can be
said that in 2018 Tesco was performing well but in the year 2019 Sainsbury edged ahead of it
(Wasiuzzaman and Lim, 2017).
Paraphrase This Document
Need a fresh take? Get an instant paraphrase of this document with our AI Paraphraser

PE ratio- In this ratio price is evaluated on the basis of earning per share of the company
and Tesco does not able to perform well in this aspect too as in 2018 the ratio was 448.64 while
it was 20.73 for Sainsbury, whereas for the year 2019 it was 654.10 and 33.76 for Tesco and
Sainsbury respectively and thus it can be concluded that Sainsbury provides good as well as
regular return to its stakeholders as compared to Tesco (Potter, 2016).
EPS- In this ratio determination of the earnings that a shareholder is getting per share is
evaluated in detail. As it can be seen from the above that Sainsbury is performing well in this
aspect as its ratio in 2018 was 1.1941 as compared to 0.4416 to that of Tesco and in 2019 too it
was 0.6838 as compared with Tesco’s 0.4064 and thus it can be said that Sainsbury is giving
higher and constant returns to its stakeholders as compared to Tesco which is lacking in this
(Canil and Rosser, 2018).

Return on Capital Employed- Tesco’s capital that has been employed in the business if
fetching higher returns from that of Sainsbury as in was 14.92 and 13.98 for 2018 and 2019,
while it was 7.34 and 7.97 for 2018 and 2019 respectively (Chandrasekaran and Acharya, 2019).
Average stock turnover period- It is an important ratio as it helps in analysing number
of days for which the amount of the company was struck with its debtors and it is preferable for a
firm to keep it as low as possible so that it does not harm the supply chain. From the above it can
⊘ This is a preview!⊘
Do you want full access?
Subscribe today to unlock all pages.

Trusted by 1+ million students worldwide
1 out of 19
Related Documents

Your All-in-One AI-Powered Toolkit for Academic Success.
+13062052269
info@desklib.com
Available 24*7 on WhatsApp / Email
Unlock your academic potential
Copyright © 2020–2025 A2Z Services. All Rights Reserved. Developed and managed by ZUCOL.