Financial Analysis Report: Tesco and Sainsbury's, Investment Appraisal
VerifiedAdded on 2023/01/06
|20
|4047
|57
Report
AI Summary
This report, created for a Managerial Finance assessment, analyzes the financial performance of Tesco plc and Sainsbury's plc through ratio analysis and investment appraisal techniques. Portfolio 1 focuses on ratio analysis, examining current ratio, quick ratio, net profit margin, gross profit margin, gearing ratio, P/E ratio, earnings per share, return on capital employed, inventory turnover, and dividend payout ratio for both companies over two years. The report evaluates their liquidity, profitability, and efficiency, highlighting strengths and weaknesses. Portfolio 2 discusses investment appraisal techniques, which are crucial for making sound investment decisions. The report concludes with recommendations for improvement and limitations of ratio analysis.
Finance
Paraphrase This Document
Need a fresh take? Get an instant paraphrase of this document with our AI Paraphraser
INTRODUCTION.......................................................................................................................................3
PORTFOLIO 1............................................................................................................................................3
Ratio analysis..........................................................................................................................................3
PORTFOLIO 2..........................................................................................................................................14
Investment appraisal techniques............................................................................................................14
CONCLUSION.........................................................................................................................................18
INTRODUCTION
Money is the foundation of each business and to decide valid and reasonable situation of
budgetary circumstance of each business is as fundamental as bread for an individual. In this
unique circumstance (Enyi, 2019), there are different devices and strategies those can be utilized
as a method of deciding the budgetary situation of a business. This activity is vital so that in the
wake of examining into budgetary situation of that firm, productive key arranging should be
possible for future game-plan. This report is isolated into two portfolios. Initial segment is
focusing on examination of budgetary situation of Tesco plc and Sainsbury's plc through device
of proportion investigation. Abundance reliance of money related proportions is likewise not a
decent technique in since quite a while ago run and it is additionally clarified in this report.
Moreover, second portfolio is discussing significance of venture evaluation procedures which are
utilized to decide and recognize right and proper speculation choice for an organization.
PORTFOLIO 1
Ratio analysis
Tesco plc
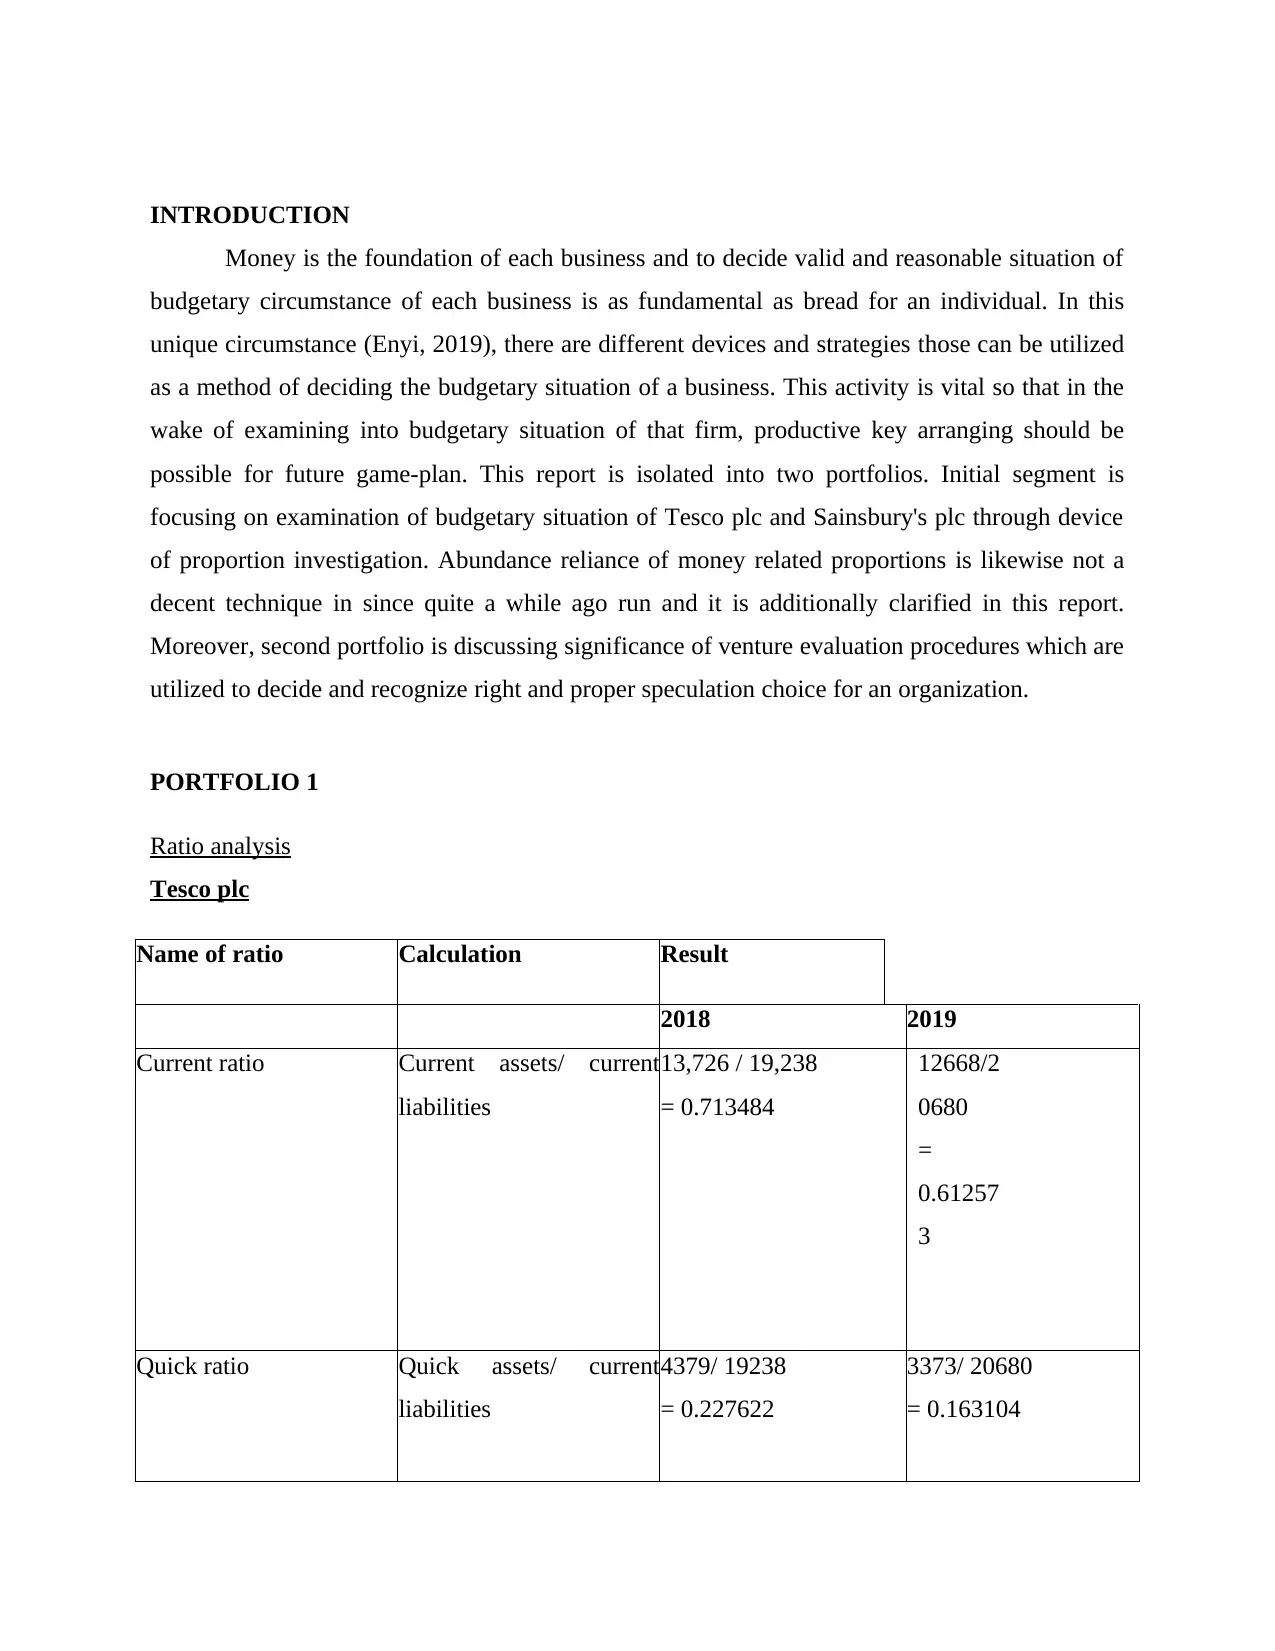
Name of ratio Calculation Result
2018 2019
Current ratio Current assets/ current
liabilities
13,726 / 19,238
= 0.713484
12668/2
0680
=
0.61257
3
Quick ratio Quick assets/ current
liabilities
4379/ 19238
= 0.227622
3373/ 20680
= 0.163104
Money is the foundation of each business and to decide valid and reasonable situation of
budgetary circumstance of each business is as fundamental as bread for an individual. In this
unique circumstance (Enyi, 2019), there are different devices and strategies those can be utilized
as a method of deciding the budgetary situation of a business. This activity is vital so that in the
wake of examining into budgetary situation of that firm, productive key arranging should be
possible for future game-plan. This report is isolated into two portfolios. Initial segment is
focusing on examination of budgetary situation of Tesco plc and Sainsbury's plc through device
of proportion investigation. Abundance reliance of money related proportions is likewise not a
decent technique in since quite a while ago run and it is additionally clarified in this report.
Moreover, second portfolio is discussing significance of venture evaluation procedures which are
utilized to decide and recognize right and proper speculation choice for an organization.
PORTFOLIO 1
Ratio analysis
Tesco plc
Name of ratio Calculation Result
2018 2019
Current ratio Current assets/ current
liabilities
13,726 / 19,238
= 0.713484
12668/2
0680
=
0.61257
3
Quick ratio Quick assets/ current
liabilities
4379/ 19238
= 0.227622
3373/ 20680
= 0.163104
⊘ This is a preview!⊘
Do you want full access?
Subscribe today to unlock all pages.
Trusted by 1+ million students worldwide
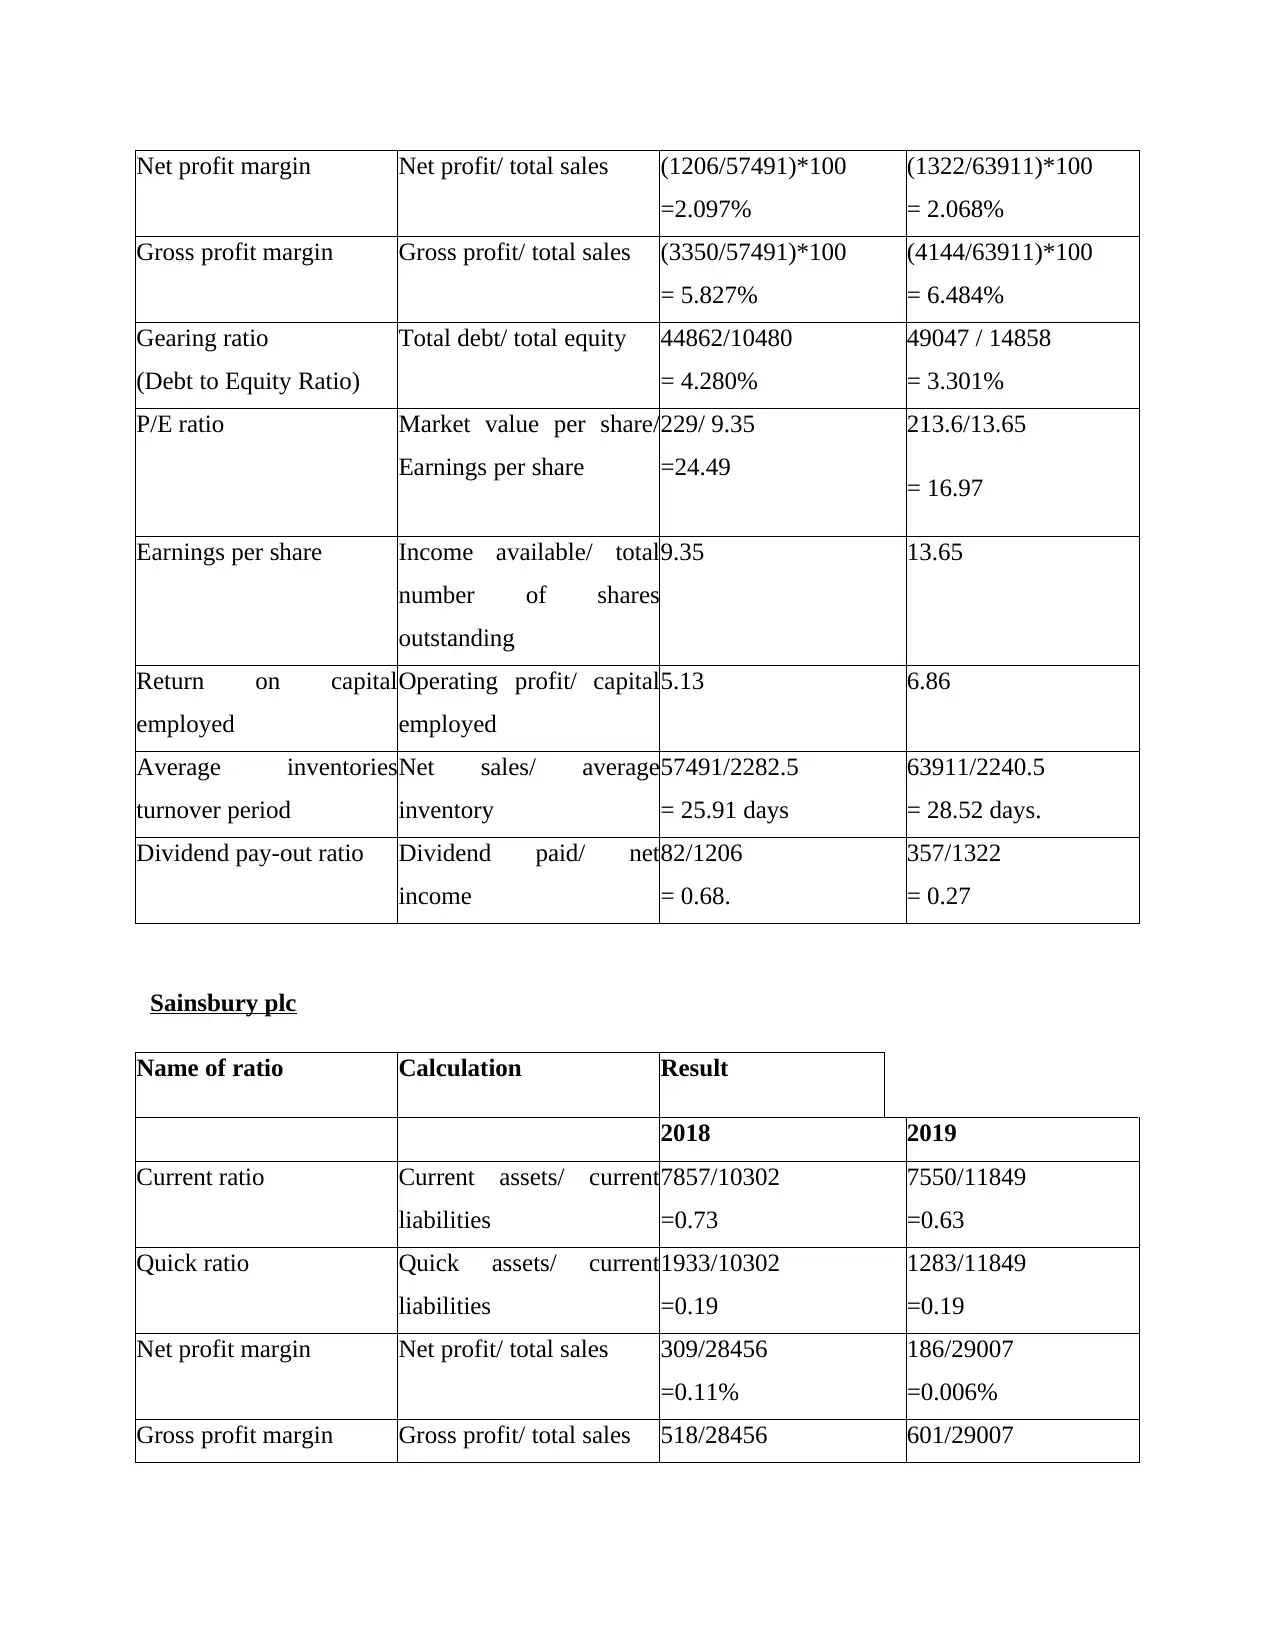
Net profit margin Net profit/ total sales (1206/57491)*100
=2.097%
(1322/63911)*100
= 2.068%
Gross profit margin Gross profit/ total sales (3350/57491)*100
= 5.827%
(4144/63911)*100
= 6.484%
Gearing ratio
(Debt to Equity Ratio)
Total debt/ total equity 44862/10480
= 4.280%
49047 / 14858
= 3.301%
P/E ratio Market value per share/
Earnings per share
229/ 9.35
=24.49
213.6/13.65
= 16.97
Earnings per share Income available/ total
number of shares
outstanding
9.35 13.65
Return on capital
employed
Operating profit/ capital
employed
5.13 6.86
Average inventories
turnover period
Net sales/ average
inventory
57491/2282.5
= 25.91 days
63911/2240.5
= 28.52 days.
Dividend pay-out ratio Dividend paid/ net
income
82/1206
= 0.68.
357/1322
= 0.27
Sainsbury plc
Name of ratio Calculation Result
2018 2019
Current ratio Current assets/ current
liabilities
7857/10302
=0.73
7550/11849
=0.63
Quick ratio Quick assets/ current
liabilities
1933/10302
=0.19
1283/11849
=0.19
Net profit margin Net profit/ total sales 309/28456
=0.11%
186/29007
=0.006%
Gross profit margin Gross profit/ total sales 518/28456 601/29007
Paraphrase This Document
Need a fresh take? Get an instant paraphrase of this document with our AI Paraphraser
=0.018% =0.02%
Gearing ratio
(Debt to Equity Ratio)
Total debt/ total equity 34.44 97.75
P/E ratio Market value per share/
Earnings per share
238.80/0.22
=10.85
213.40/46
=4.64
Earnings per share Income available/ total
number of shares
outstanding
22 46
Return on capital
employed
Operating profit/ capital
employed
4.65 3.84
Average inventories
turnover period
Net sales/ average
inventory
28456/1792.5
=15.87 days.
29007/1869.5
=15.51 days.
Dividend pay-out ratio Dividend paid/ net
income
235/309
=0.76
247/186
=1.33
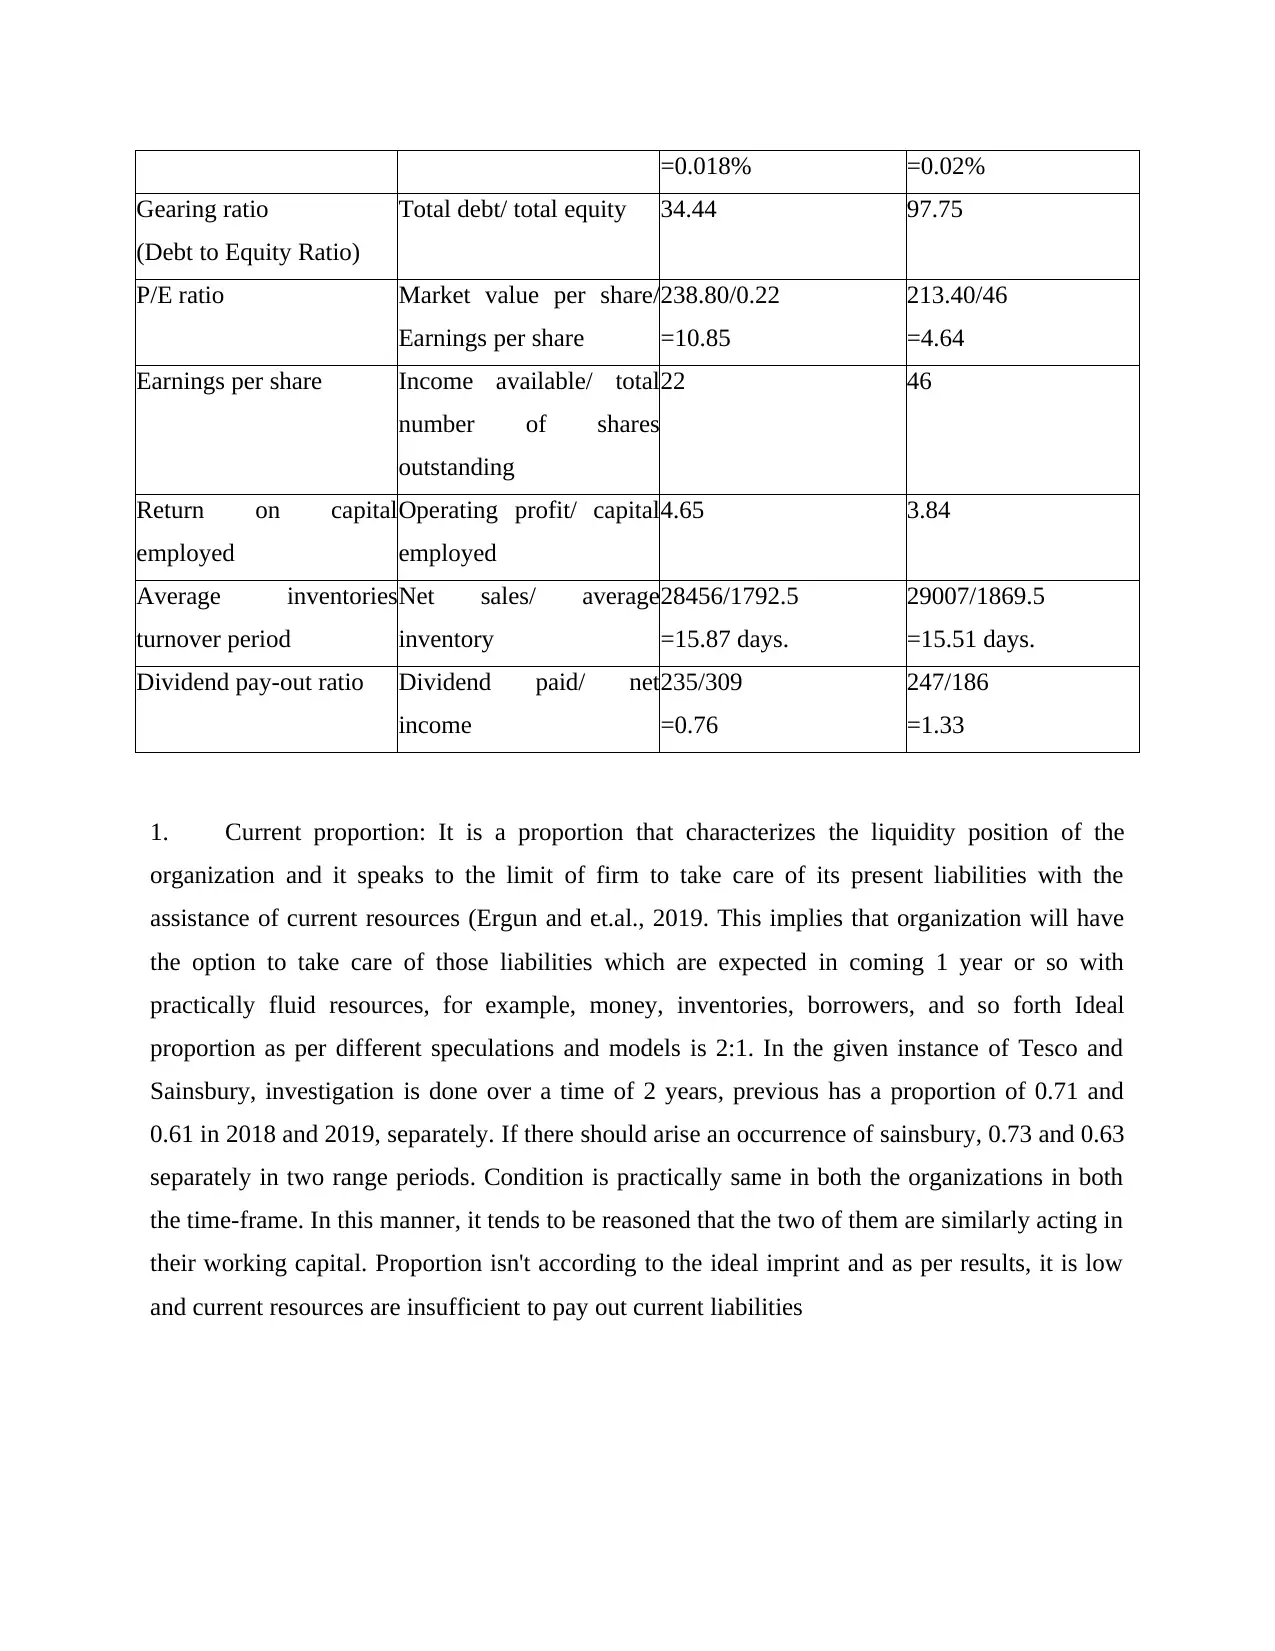
1. Current proportion: It is a proportion that characterizes the liquidity position of the
organization and it speaks to the limit of firm to take care of its present liabilities with the
assistance of current resources (Ergun and et.al., 2019. This implies that organization will have
the option to take care of those liabilities which are expected in coming 1 year or so with
practically fluid resources, for example, money, inventories, borrowers, and so forth Ideal
proportion as per different speculations and models is 2:1. In the given instance of Tesco and
Sainsbury, investigation is done over a time of 2 years, previous has a proportion of 0.71 and
0.61 in 2018 and 2019, separately. If there should arise an occurrence of sainsbury, 0.73 and 0.63
separately in two range periods. Condition is practically same in both the organizations in both
the time-frame. In this manner, it tends to be reasoned that the two of them are similarly acting in
their working capital. Proportion isn't according to the ideal imprint and as per results, it is low
and current resources are insufficient to pay out current liabilities
Gearing ratio
(Debt to Equity Ratio)
Total debt/ total equity 34.44 97.75
P/E ratio Market value per share/
Earnings per share
238.80/0.22
=10.85
213.40/46
=4.64
Earnings per share Income available/ total
number of shares
outstanding
22 46
Return on capital
employed
Operating profit/ capital
employed
4.65 3.84
Average inventories
turnover period
Net sales/ average
inventory
28456/1792.5
=15.87 days.
29007/1869.5
=15.51 days.
Dividend pay-out ratio Dividend paid/ net
income
235/309
=0.76
247/186
=1.33
1. Current proportion: It is a proportion that characterizes the liquidity position of the
organization and it speaks to the limit of firm to take care of its present liabilities with the
assistance of current resources (Ergun and et.al., 2019. This implies that organization will have
the option to take care of those liabilities which are expected in coming 1 year or so with
practically fluid resources, for example, money, inventories, borrowers, and so forth Ideal
proportion as per different speculations and models is 2:1. In the given instance of Tesco and
Sainsbury, investigation is done over a time of 2 years, previous has a proportion of 0.71 and
0.61 in 2018 and 2019, separately. If there should arise an occurrence of sainsbury, 0.73 and 0.63
separately in two range periods. Condition is practically same in both the organizations in both
the time-frame. In this manner, it tends to be reasoned that the two of them are similarly acting in
their working capital. Proportion isn't according to the ideal imprint and as per results, it is low
and current resources are insufficient to pay out current liabilities
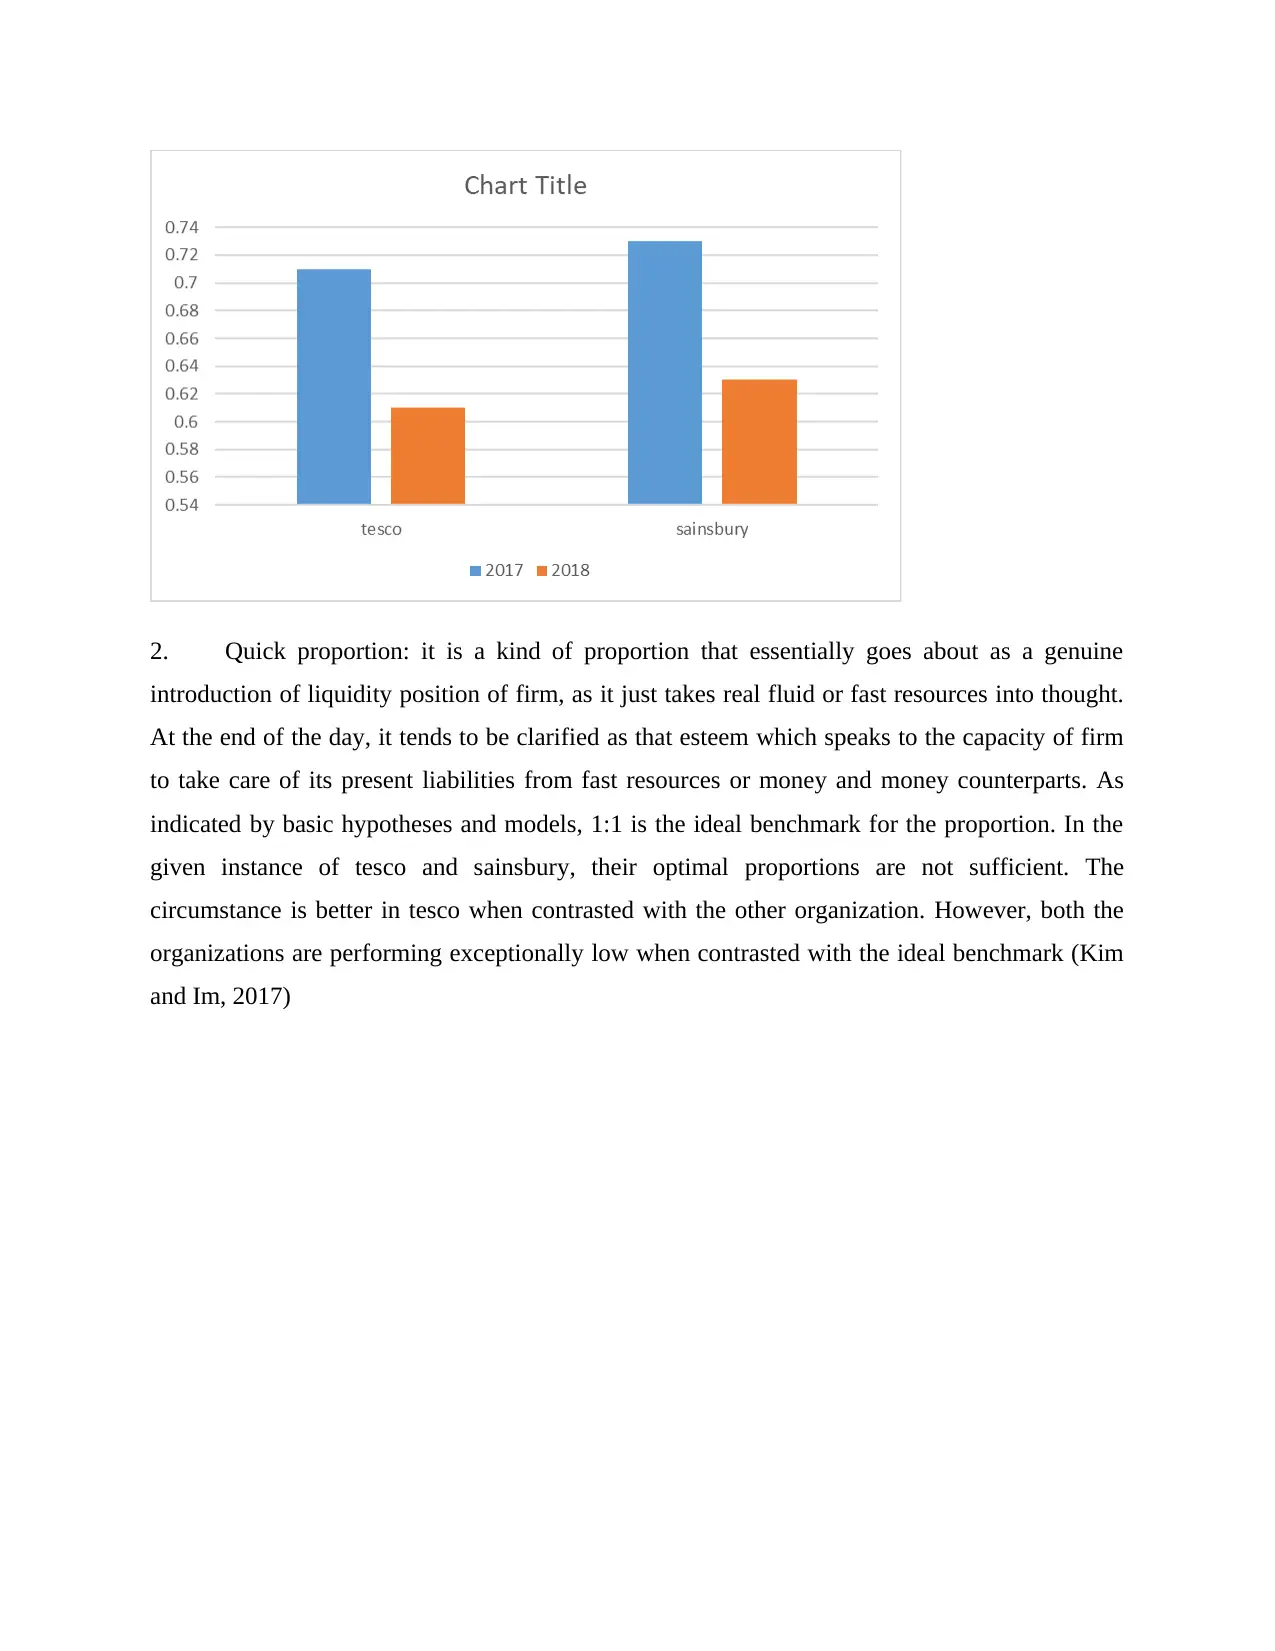
2. Quick proportion: it is a kind of proportion that essentially goes about as a genuine
introduction of liquidity position of firm, as it just takes real fluid or fast resources into thought.
At the end of the day, it tends to be clarified as that esteem which speaks to the capacity of firm
to take care of its present liabilities from fast resources or money and money counterparts. As
indicated by basic hypotheses and models, 1:1 is the ideal benchmark for the proportion. In the
given instance of tesco and sainsbury, their optimal proportions are not sufficient. The
circumstance is better in tesco when contrasted with the other organization. However, both the
organizations are performing exceptionally low when contrasted with the ideal benchmark (Kim
and Im, 2017)
⊘ This is a preview!⊘
Do you want full access?
Subscribe today to unlock all pages.
Trusted by 1+ million students worldwide
.
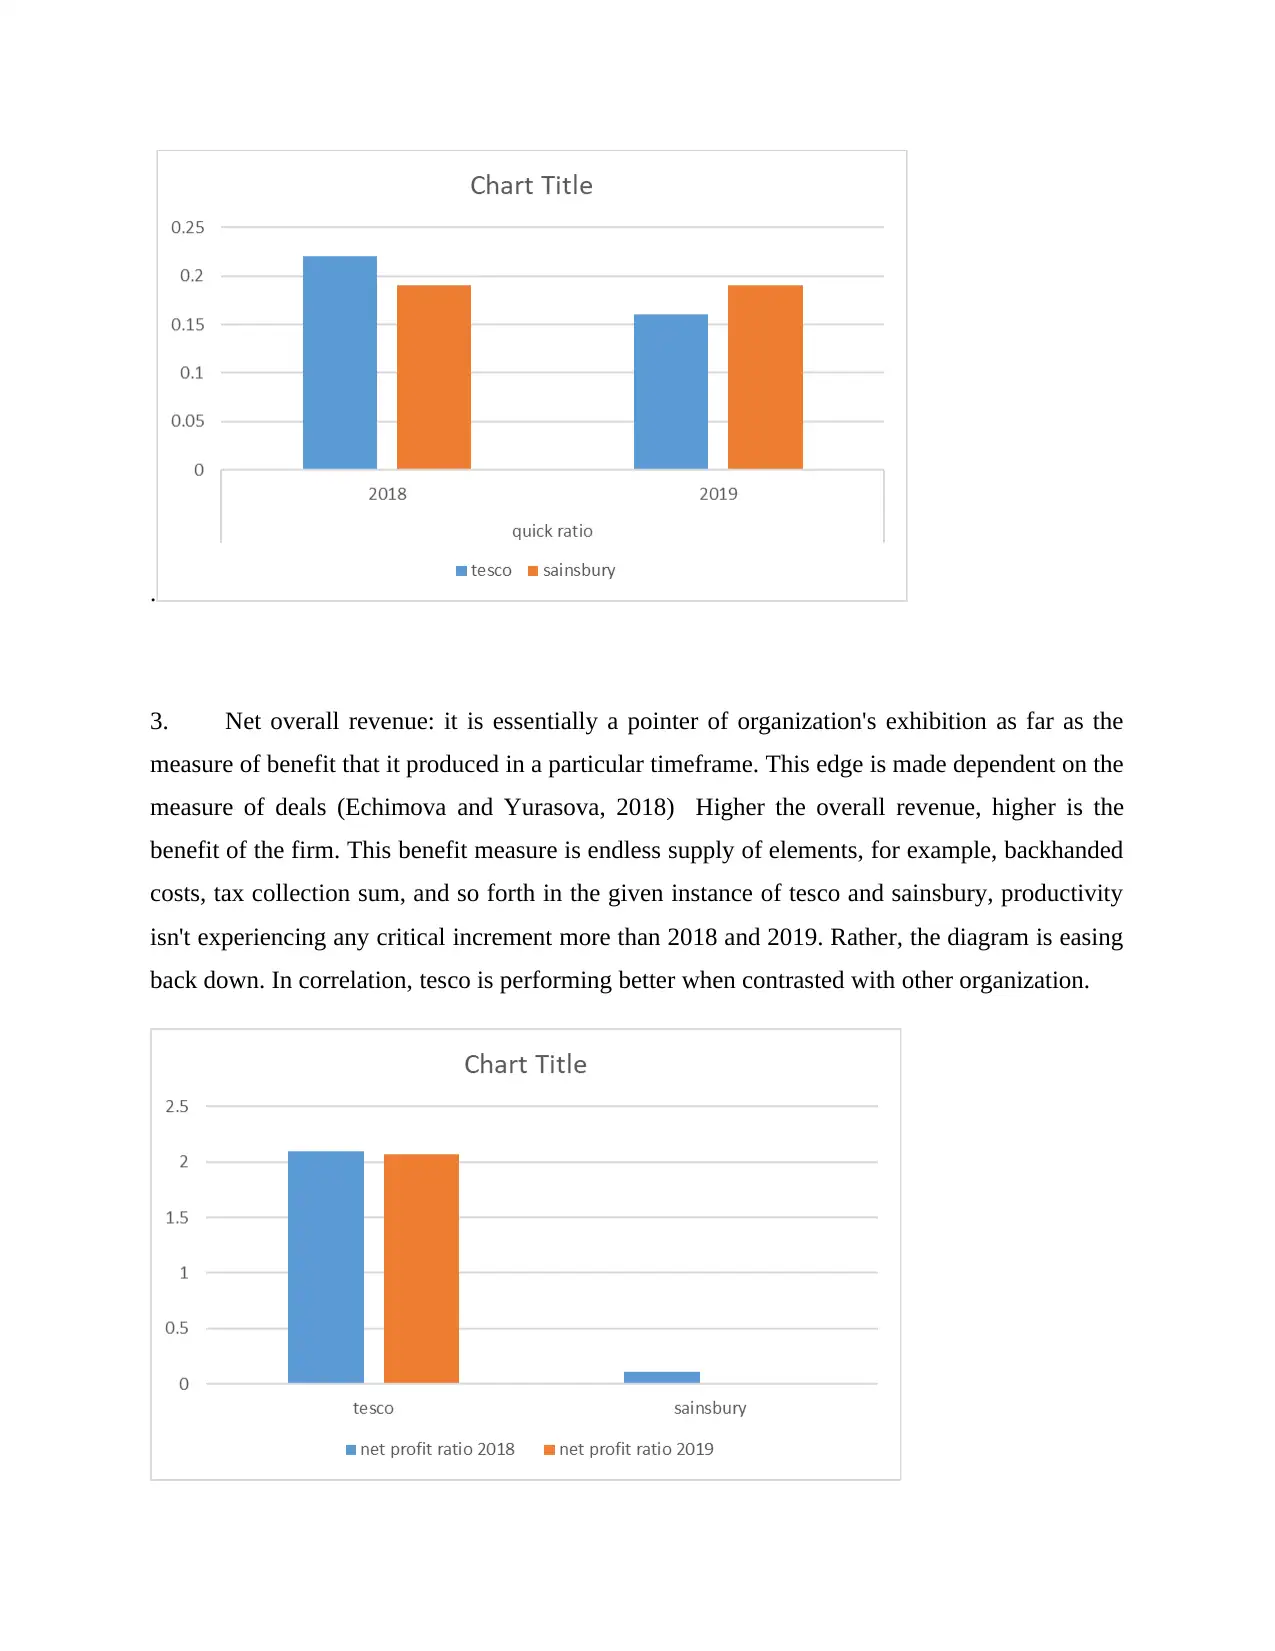
3. Net overall revenue: it is essentially a pointer of organization's exhibition as far as the
measure of benefit that it produced in a particular timeframe. This edge is made dependent on the
measure of deals (Echimova and Yurasova, 2018) Higher the overall revenue, higher is the
benefit of the firm. This benefit measure is endless supply of elements, for example, backhanded
costs, tax collection sum, and so forth in the given instance of tesco and sainsbury, productivity
isn't experiencing any critical increment more than 2018 and 2019. Rather, the diagram is easing
back down. In correlation, tesco is performing better when contrasted with other organization.
Paraphrase This Document
Need a fresh take? Get an instant paraphrase of this document with our AI Paraphraser
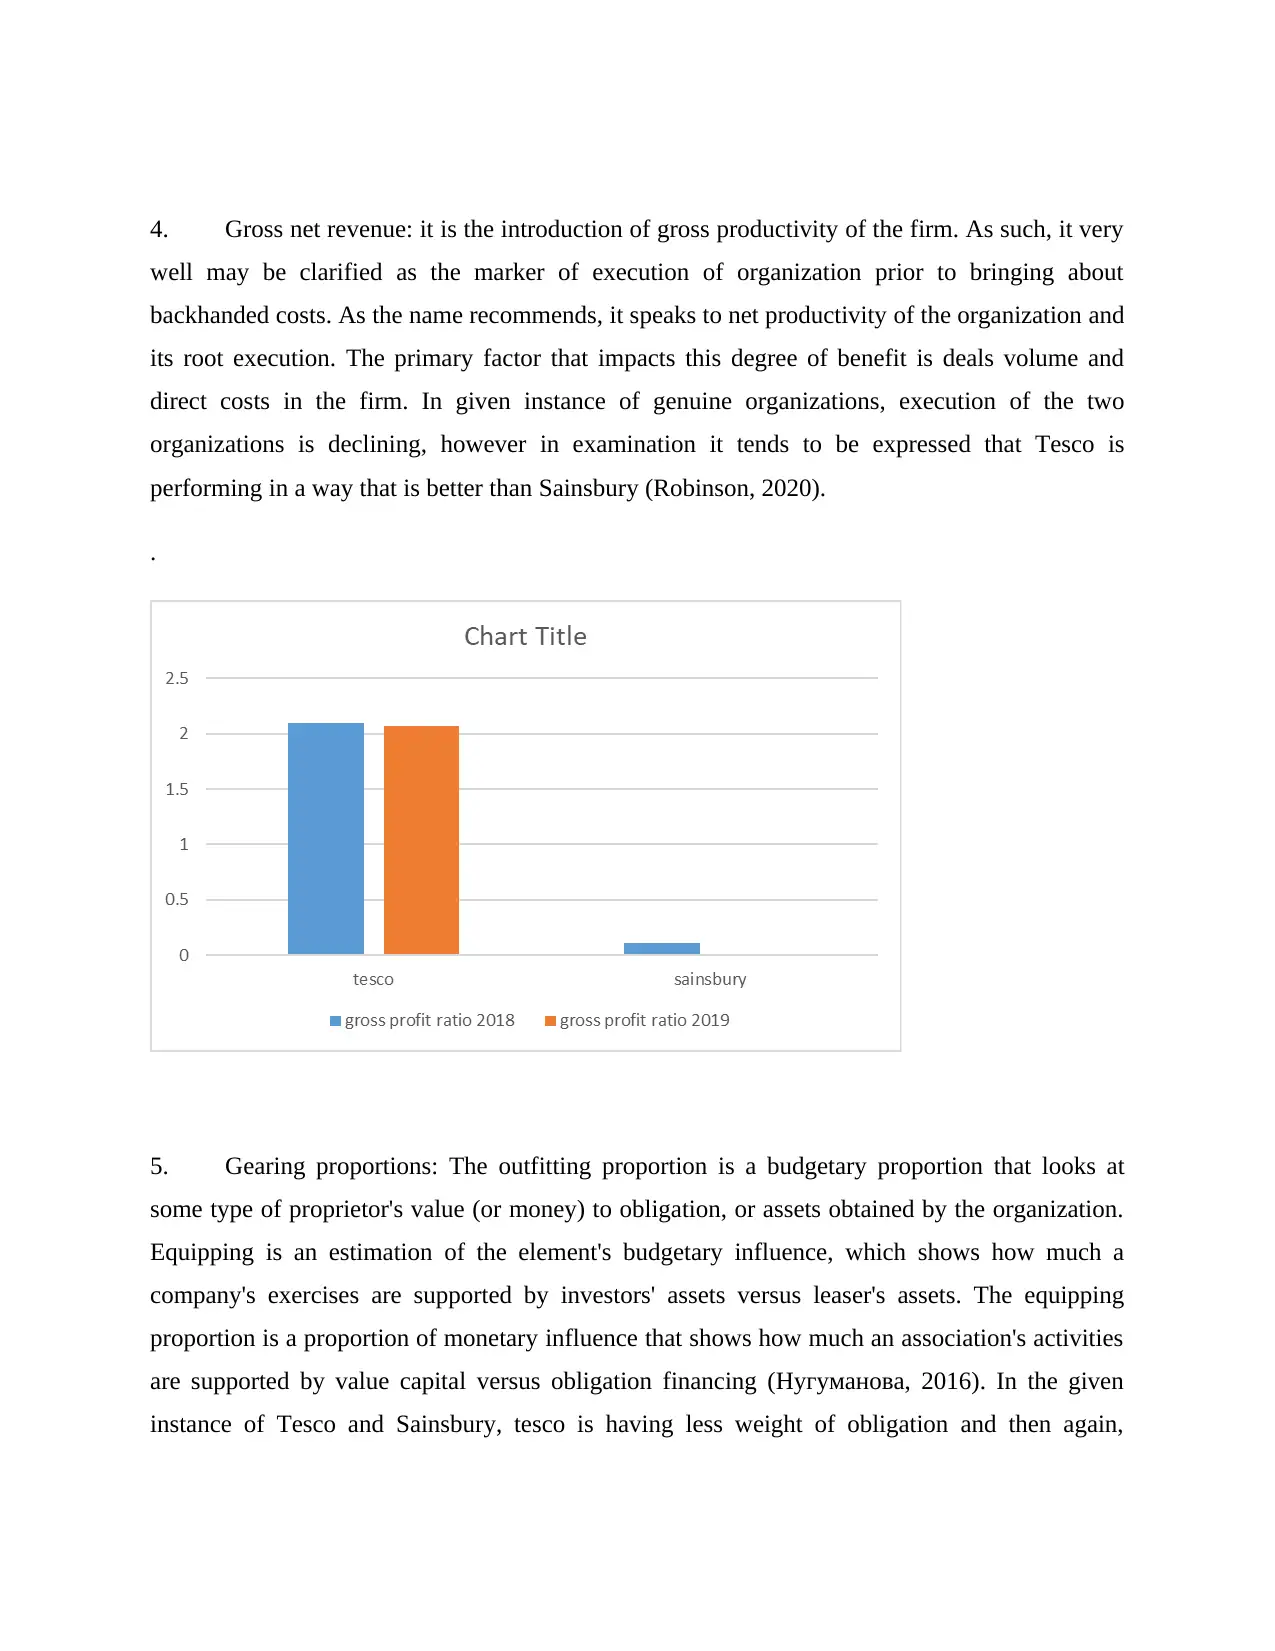
4. Gross net revenue: it is the introduction of gross productivity of the firm. As such, it very
well may be clarified as the marker of execution of organization prior to bringing about
backhanded costs. As the name recommends, it speaks to net productivity of the organization and
its root execution. The primary factor that impacts this degree of benefit is deals volume and
direct costs in the firm. In given instance of genuine organizations, execution of the two
organizations is declining, however in examination it tends to be expressed that Tesco is
performing in a way that is better than Sainsbury (Robinson, 2020).
.
5. Gearing proportions: The outfitting proportion is a budgetary proportion that looks at
some type of proprietor's value (or money) to obligation, or assets obtained by the organization.
Equipping is an estimation of the element's budgetary influence, which shows how much a
company's exercises are supported by investors' assets versus leaser's assets. The equipping
proportion is a proportion of monetary influence that shows how much an association's activities
are supported by value capital versus obligation financing (Нугуманова, 2016). In the given
instance of Tesco and Sainsbury, tesco is having less weight of obligation and then again,
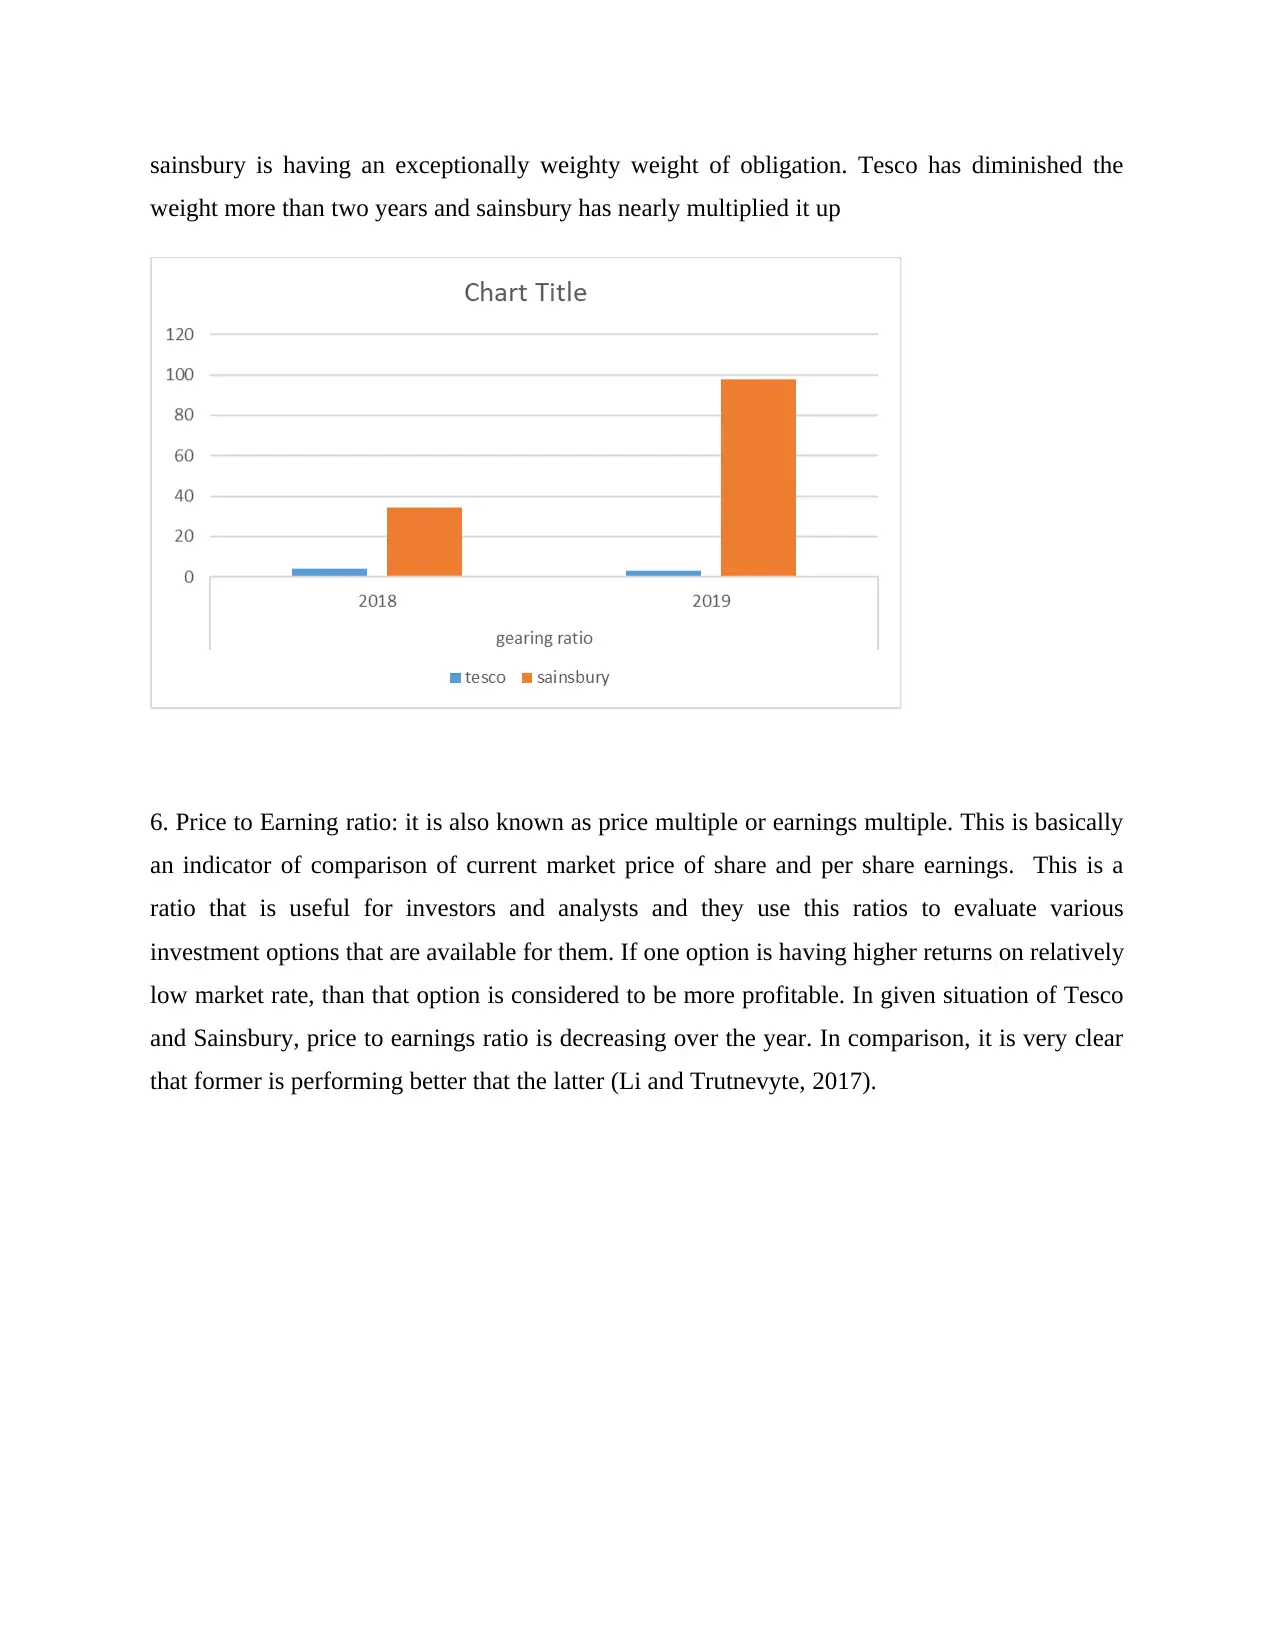
sainsbury is having an exceptionally weighty weight of obligation. Tesco has diminished the
weight more than two years and sainsbury has nearly multiplied it up
6. Price to Earning ratio: it is also known as price multiple or earnings multiple. This is basically
an indicator of comparison of current market price of share and per share earnings. This is a
ratio that is useful for investors and analysts and they use this ratios to evaluate various
investment options that are available for them. If one option is having higher returns on relatively
low market rate, than that option is considered to be more profitable. In given situation of Tesco
and Sainsbury, price to earnings ratio is decreasing over the year. In comparison, it is very clear
that former is performing better that the latter (Li and Trutnevyte, 2017).
⊘ This is a preview!⊘
Do you want full access?
Subscribe today to unlock all pages.
Trusted by 1+ million students worldwide
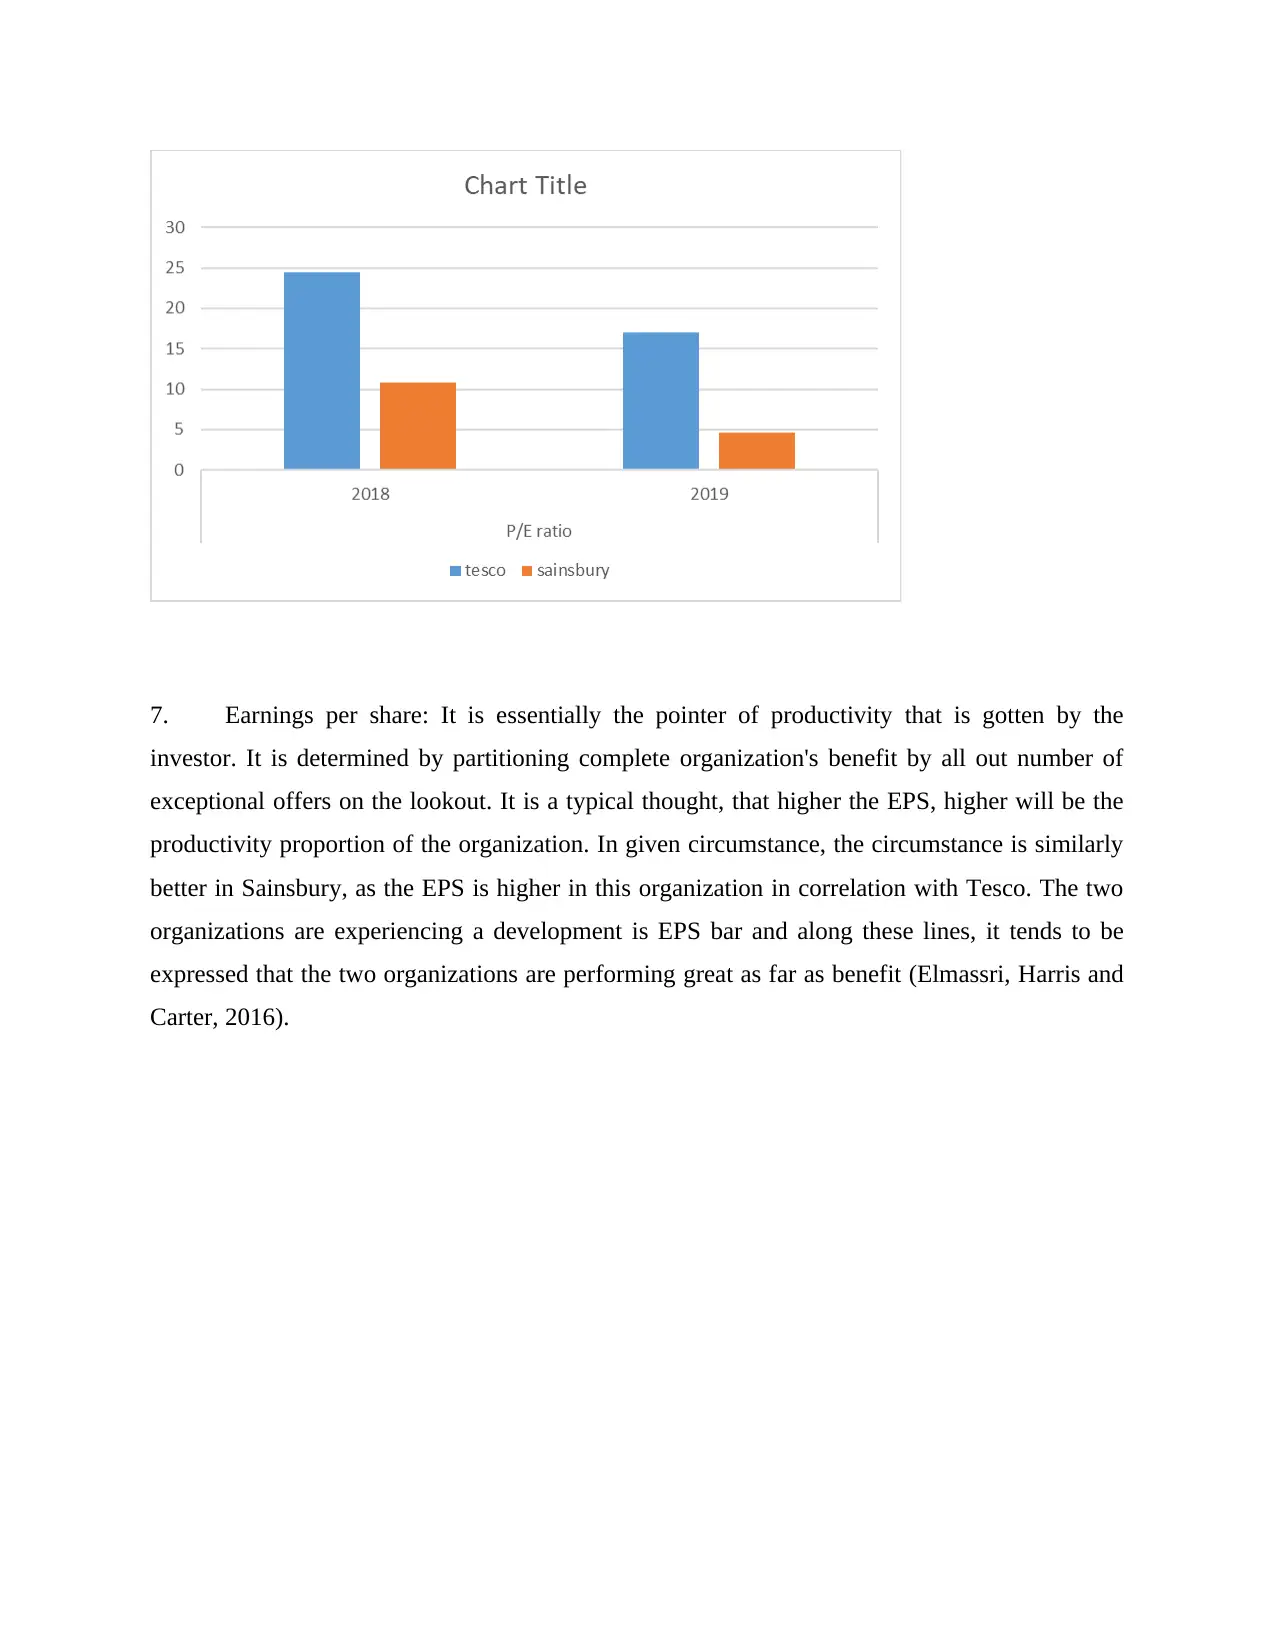
7. Earnings per share: It is essentially the pointer of productivity that is gotten by the
investor. It is determined by partitioning complete organization's benefit by all out number of
exceptional offers on the lookout. It is a typical thought, that higher the EPS, higher will be the
productivity proportion of the organization. In given circumstance, the circumstance is similarly
better in Sainsbury, as the EPS is higher in this organization in correlation with Tesco. The two
organizations are experiencing a development is EPS bar and along these lines, it tends to be
expressed that the two organizations are performing great as far as benefit (Elmassri, Harris and
Carter, 2016).
Paraphrase This Document
Need a fresh take? Get an instant paraphrase of this document with our AI Paraphraser
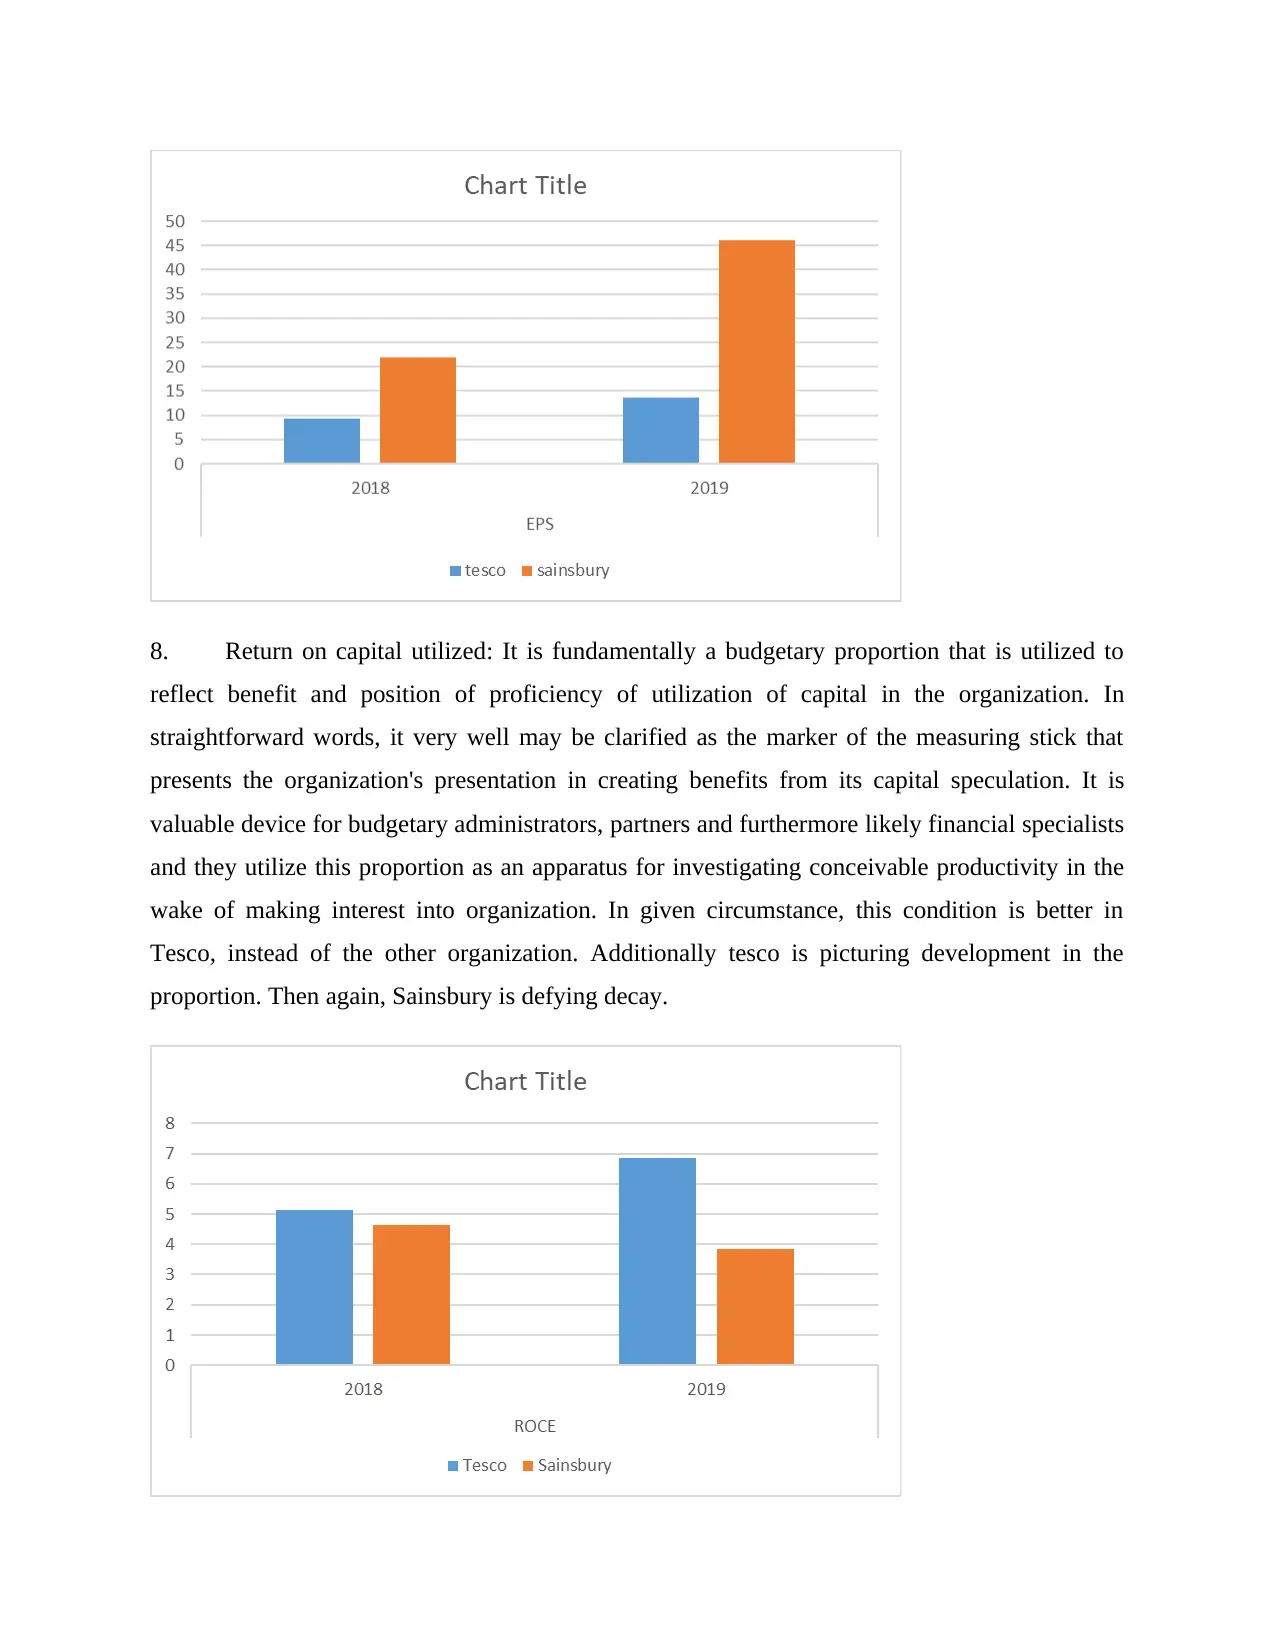
8. Return on capital utilized: It is fundamentally a budgetary proportion that is utilized to
reflect benefit and position of proficiency of utilization of capital in the organization. In
straightforward words, it very well may be clarified as the marker of the measuring stick that
presents the organization's presentation in creating benefits from its capital speculation. It is
valuable device for budgetary administrators, partners and furthermore likely financial specialists
and they utilize this proportion as an apparatus for investigating conceivable productivity in the
wake of making interest into organization. In given circumstance, this condition is better in
Tesco, instead of the other organization. Additionally tesco is picturing development in the
proportion. Then again, Sainsbury is defying decay.
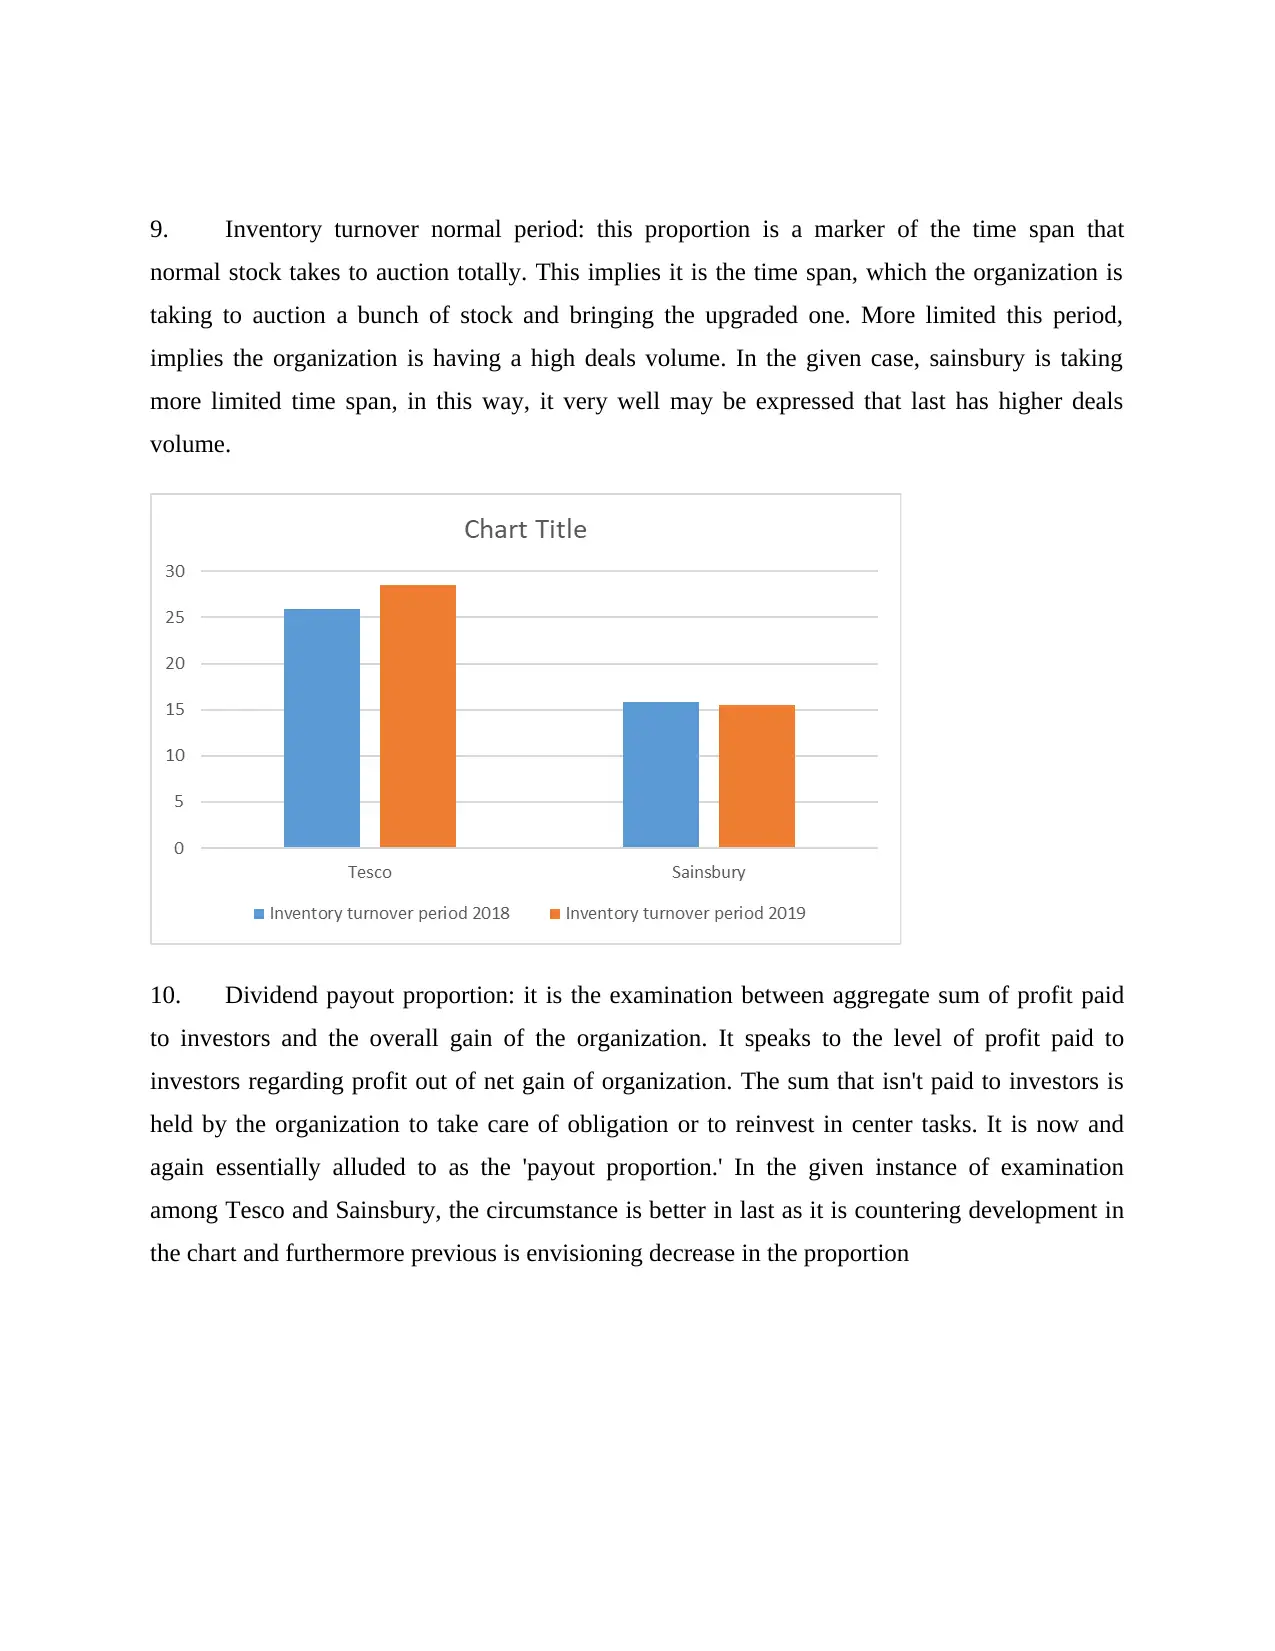
9. Inventory turnover normal period: this proportion is a marker of the time span that
normal stock takes to auction totally. This implies it is the time span, which the organization is
taking to auction a bunch of stock and bringing the upgraded one. More limited this period,
implies the organization is having a high deals volume. In the given case, sainsbury is taking
more limited time span, in this way, it very well may be expressed that last has higher deals
volume.
10. Dividend payout proportion: it is the examination between aggregate sum of profit paid
to investors and the overall gain of the organization. It speaks to the level of profit paid to
investors regarding profit out of net gain of organization. The sum that isn't paid to investors is
held by the organization to take care of obligation or to reinvest in center tasks. It is now and
again essentially alluded to as the 'payout proportion.' In the given instance of examination
among Tesco and Sainsbury, the circumstance is better in last as it is countering development in
the chart and furthermore previous is envisioning decrease in the proportion
⊘ This is a preview!⊘
Do you want full access?
Subscribe today to unlock all pages.
Trusted by 1+ million students worldwide
1 out of 20
Related Documents


Your All-in-One AI-Powered Toolkit for Academic Success.
+13062052269
info@desklib.com
Available 24*7 on WhatsApp / Email
![[object Object]](/_next/static/media/star-bottom.7253800d.svg)
Unlock your academic potential
Copyright © 2020–2026 A2Z Services. All Rights Reserved. Developed and managed by ZUCOL.