Britvic plc Financial Analysis Report for Managerial Finance Module
VerifiedAdded on 2022/11/26
|11
|2192
|230
Report
AI Summary
This report presents a financial analysis of Britvic plc, a British soft drink producer, based on its 2018 annual report. The analysis begins with an introduction to Britvic, including its history, products, and market presence. It then delves into key financial metrics, including percentage movements in revenue and profit, and calculates crucial financial ratios like current ratio, operating profit margin, trade receivables collection period, gearing ratio, and return on capital employed. The report analyzes these ratios to assess the company's performance and offers investment recommendations. Key findings include revenue growth, increased operating profit, and improvements in various financial ratios, leading to a conclusion that suggests a positive investment outlook. The report also includes a detailed discussion of the company's performance over the past trading period, supporting its investment recommendation and highlighting the financial health of Britvic plc.
Running Head: MANAGERIAL FINANCE
MANAGERIAL FINANCE
Name of the Student
Name of the University
Author Note
MANAGERIAL FINANCE
Name of the Student
Name of the University
Author Note
Paraphrase This Document
Need a fresh take? Get an instant paraphrase of this document with our AI Paraphraser
1MANAGERIAL FINANCE
Table of Contents
Introduction...............................................................................................................................2
Discussion................................................................................................................................2
Percentage Movements............................................................................................3
Calculation of Ratios.................................................................................................3
Analysis for making Investment................................................................................6
Conclusion................................................................................................................................8
2MANAGERIAL FINANCE
i)
Introduction
The assignment has the aim of doing the analysis on the financial analysis of
Britvic plc. This company is the British producer of the soft drinks that are based in
Hemel Hempstead. Britvic Plc is listed on the London Stock Exchange as well as it is
the constituent of FTSE 250 Index. The company is engaged in the production as
well as distribution of soft drinks under their own name. Moreover, at the mid-
twentieth century in Chelmsford, the company was founded as the British Vitamin
Products Company. Later, in the year 1938, the company started producing the fruit
juices and they started marketing of it under the name of Britvic, which was
incorporated in the year 2005. Further, the operations of the company are
concentrated in Ireland and United Kingdom. The company provides liquid
concentrates, fruit juices, sodas, ready-to-drink, flavored water, mixers, syrups and
energy drinks. Moreover, the company also supplies bottled water and water-
coolers, wholesales soft drinks to licensed drinks and they offers financial services
and pension funding. The company exports their product in approx. 50 countries.
The key financial results of the company shows that the company’s revenue grows
year by year (Britvic.com. 2019).
Discussion
ii)
⊘ This is a preview!⊘
Do you want full access?
Subscribe today to unlock all pages.
Trusted by 1+ million students worldwide
3MANAGERIAL FINANCE
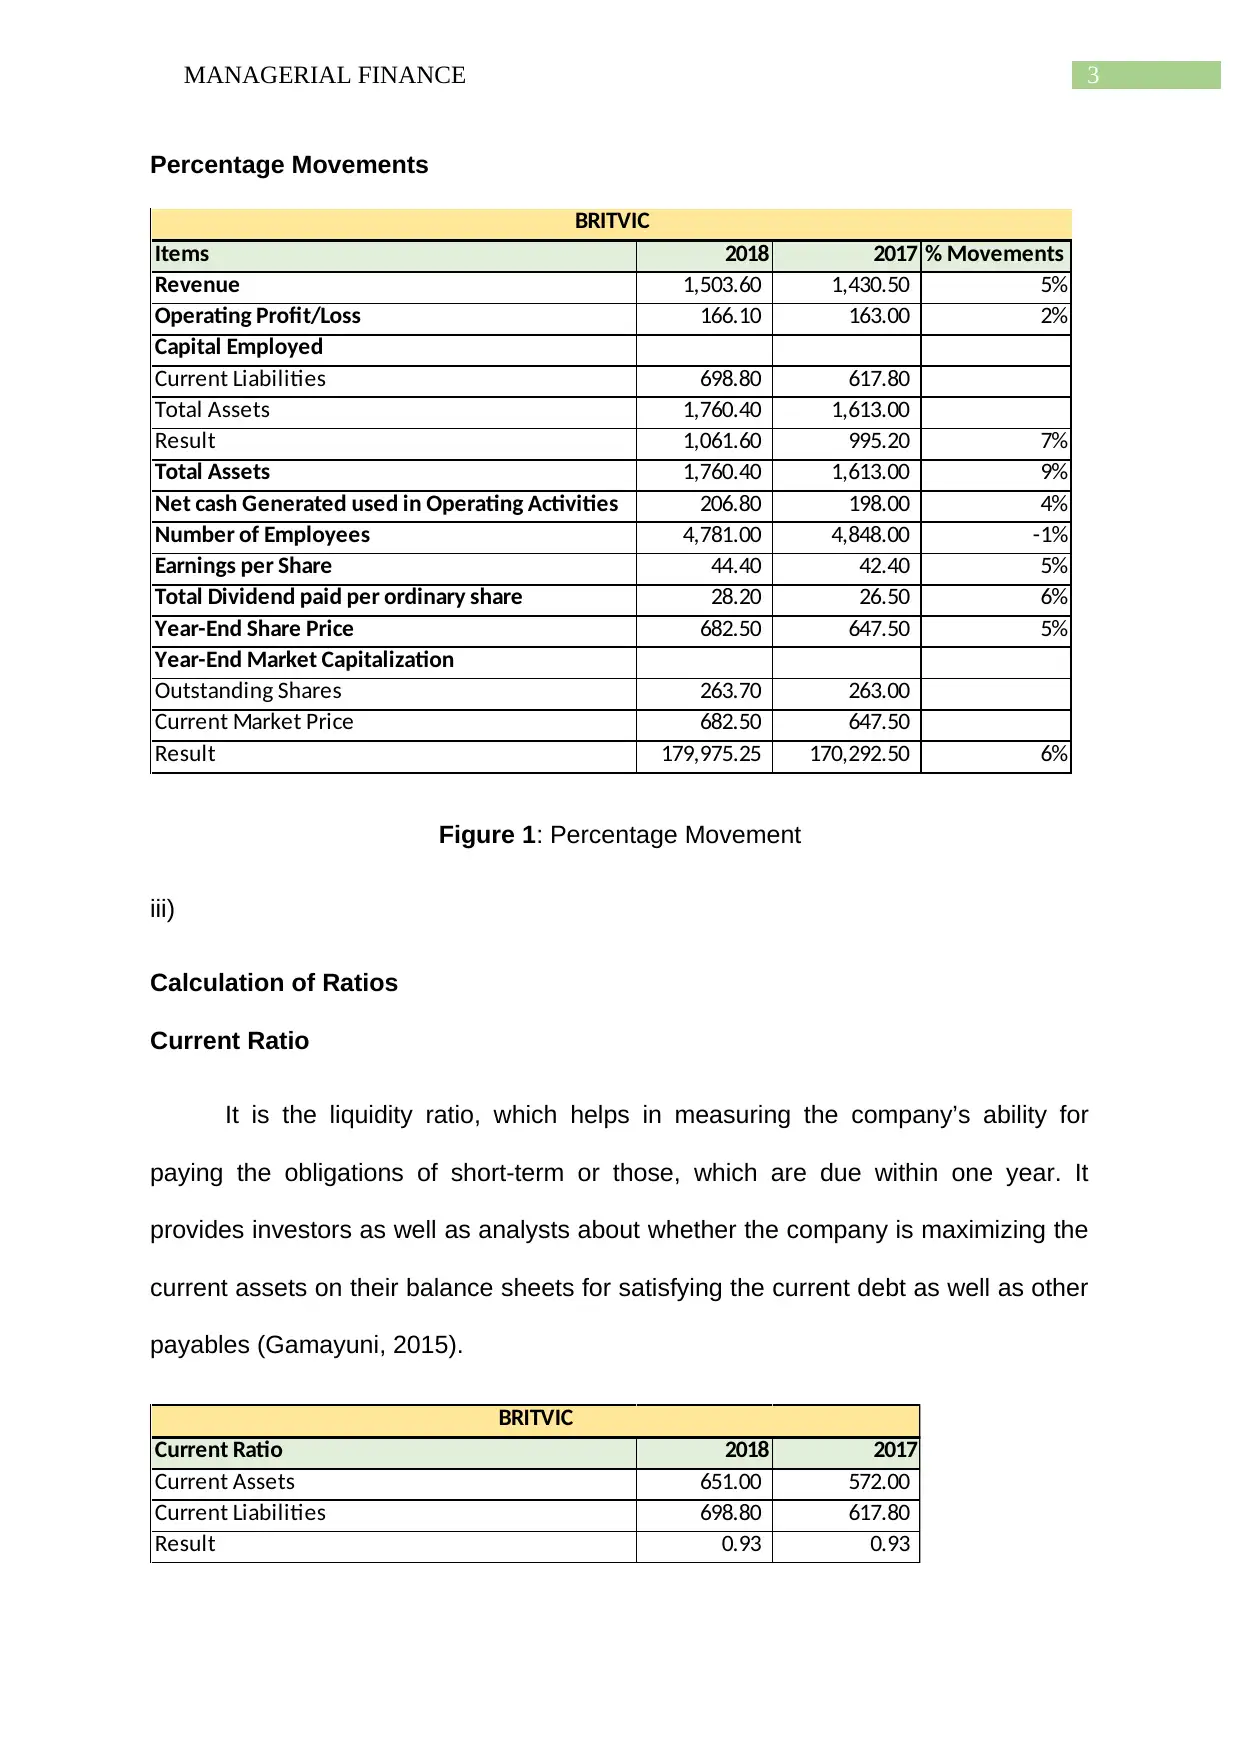
Percentage Movements
Items 2018 2017 % Movements
Revenue 1,503.60 1,430.50 5%
Operating Profit/Loss 166.10 163.00 2%
Capital Employed
Current Liabilities 698.80 617.80
Total Assets 1,760.40 1,613.00
Result 1,061.60 995.20 7%
Total Assets 1,760.40 1,613.00 9%
Net cash Generated used in Operating Activities 206.80 198.00 4%
Number of Employees 4,781.00 4,848.00 -1%
Earnings per Share 44.40 42.40 5%
Total Dividend paid per ordinary share 28.20 26.50 6%
Year-End Share Price 682.50 647.50 5%
Year-End Market Capitalization
Outstanding Shares 263.70 263.00
Current Market Price 682.50 647.50
Result 179,975.25 170,292.50 6%
BRITVIC
Figure 1: Percentage Movement
iii)
Calculation of Ratios
Current Ratio
It is the liquidity ratio, which helps in measuring the company’s ability for
paying the obligations of short-term or those, which are due within one year. It
provides investors as well as analysts about whether the company is maximizing the
current assets on their balance sheets for satisfying the current debt as well as other
payables (Gamayuni, 2015).
Current Ratio 2018 2017
Current Assets 651.00 572.00
Current Liabilities 698.80 617.80
Result 0.93 0.93
BRITVIC
Paraphrase This Document
Need a fresh take? Get an instant paraphrase of this document with our AI Paraphraser
4MANAGERIAL FINANCE
Figure 2: Current Ratio
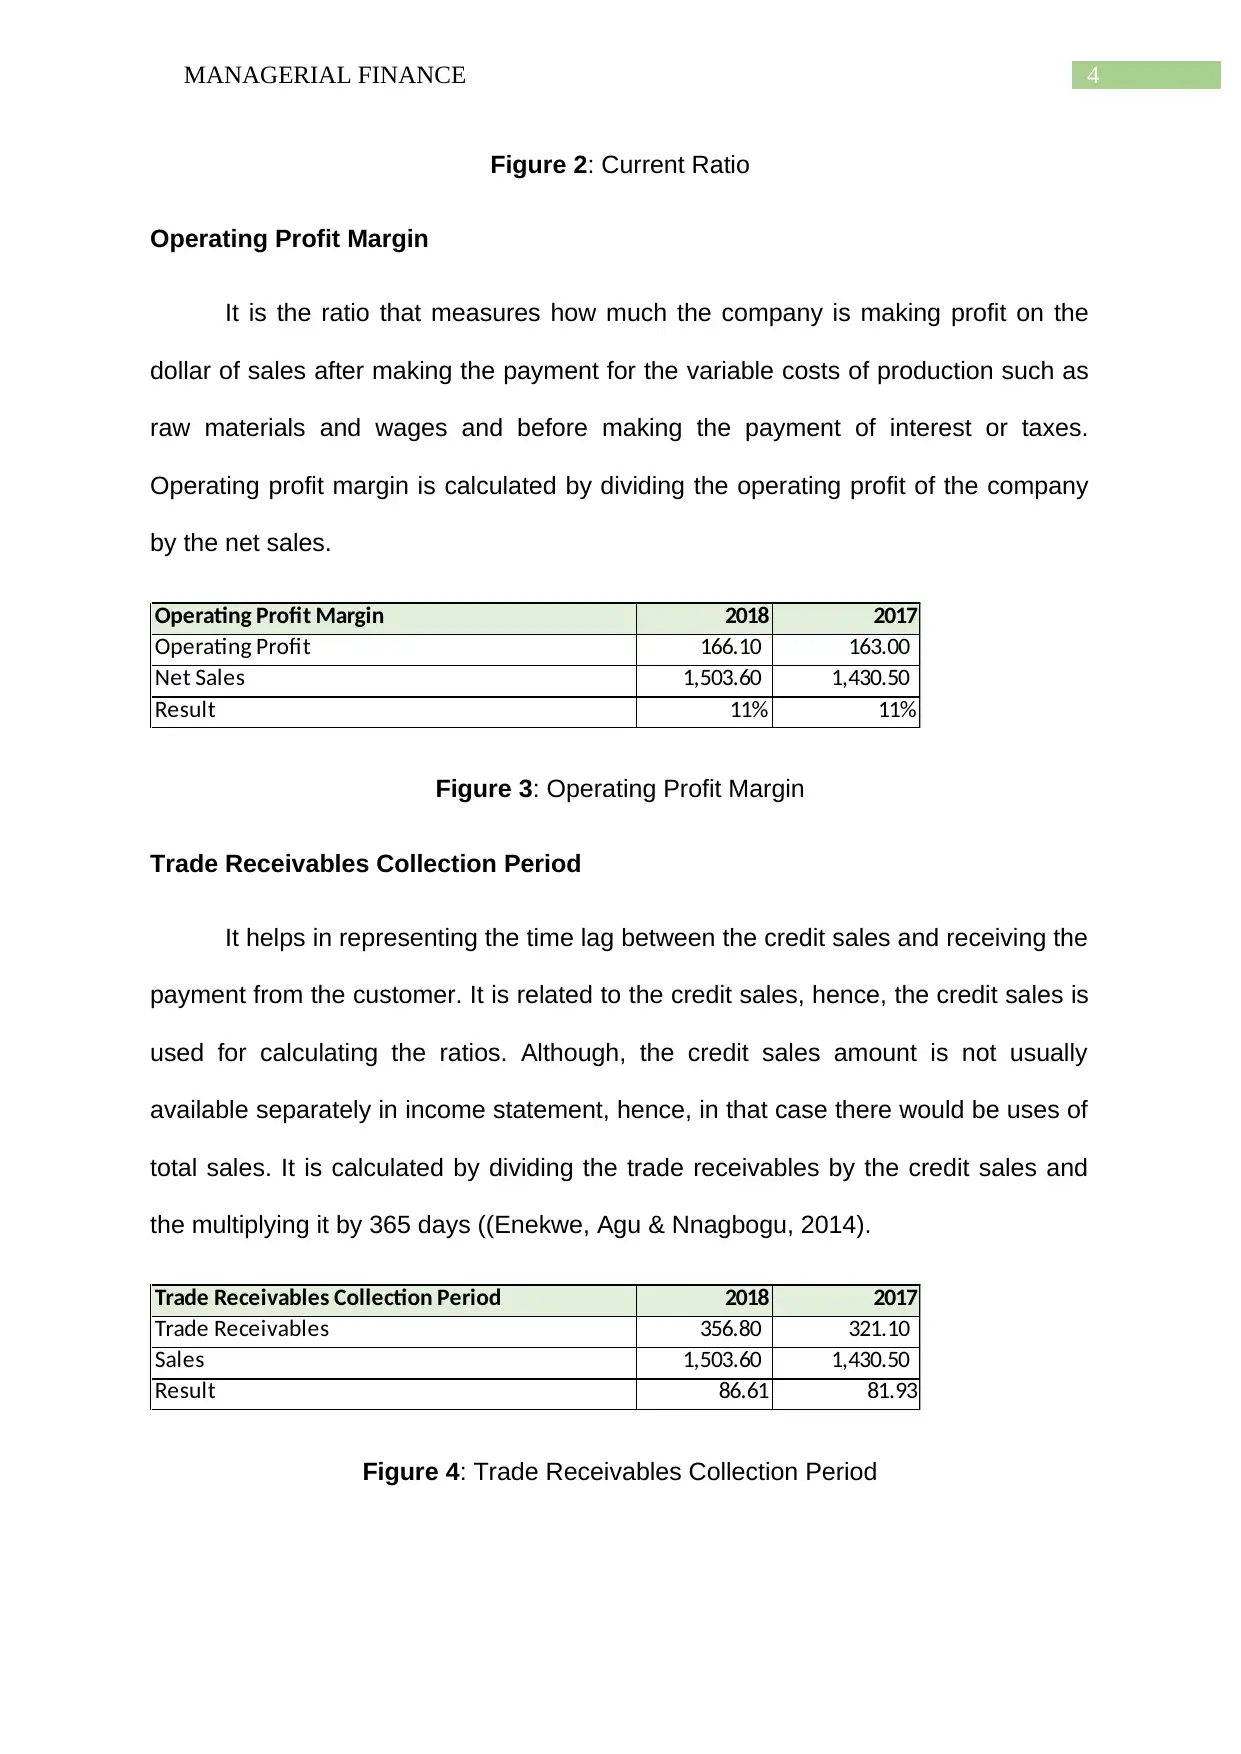
Operating Profit Margin
It is the ratio that measures how much the company is making profit on the
dollar of sales after making the payment for the variable costs of production such as
raw materials and wages and before making the payment of interest or taxes.
Operating profit margin is calculated by dividing the operating profit of the company
by the net sales.
Operating Profit Margin 2018 2017
Operating Profit 166.10 163.00
Net Sales 1,503.60 1,430.50
Result 11% 11%
Figure 3: Operating Profit Margin
Trade Receivables Collection Period
It helps in representing the time lag between the credit sales and receiving the
payment from the customer. It is related to the credit sales, hence, the credit sales is
used for calculating the ratios. Although, the credit sales amount is not usually
available separately in income statement, hence, in that case there would be uses of
total sales. It is calculated by dividing the trade receivables by the credit sales and
the multiplying it by 365 days ((Enekwe, Agu & Nnagbogu, 2014).
Trade Receivables Collection Period 2018 2017
Trade Receivables 356.80 321.10
Sales 1,503.60 1,430.50
Result 86.61 81.93
Figure 4: Trade Receivables Collection Period
Figure 2: Current Ratio
Operating Profit Margin
It is the ratio that measures how much the company is making profit on the
dollar of sales after making the payment for the variable costs of production such as
raw materials and wages and before making the payment of interest or taxes.
Operating profit margin is calculated by dividing the operating profit of the company
by the net sales.
Operating Profit Margin 2018 2017
Operating Profit 166.10 163.00
Net Sales 1,503.60 1,430.50
Result 11% 11%
Figure 3: Operating Profit Margin
Trade Receivables Collection Period
It helps in representing the time lag between the credit sales and receiving the
payment from the customer. It is related to the credit sales, hence, the credit sales is
used for calculating the ratios. Although, the credit sales amount is not usually
available separately in income statement, hence, in that case there would be uses of
total sales. It is calculated by dividing the trade receivables by the credit sales and
the multiplying it by 365 days ((Enekwe, Agu & Nnagbogu, 2014).
Trade Receivables Collection Period 2018 2017
Trade Receivables 356.80 321.10
Sales 1,503.60 1,430.50
Result 86.61 81.93
Figure 4: Trade Receivables Collection Period
5MANAGERIAL FINANCE
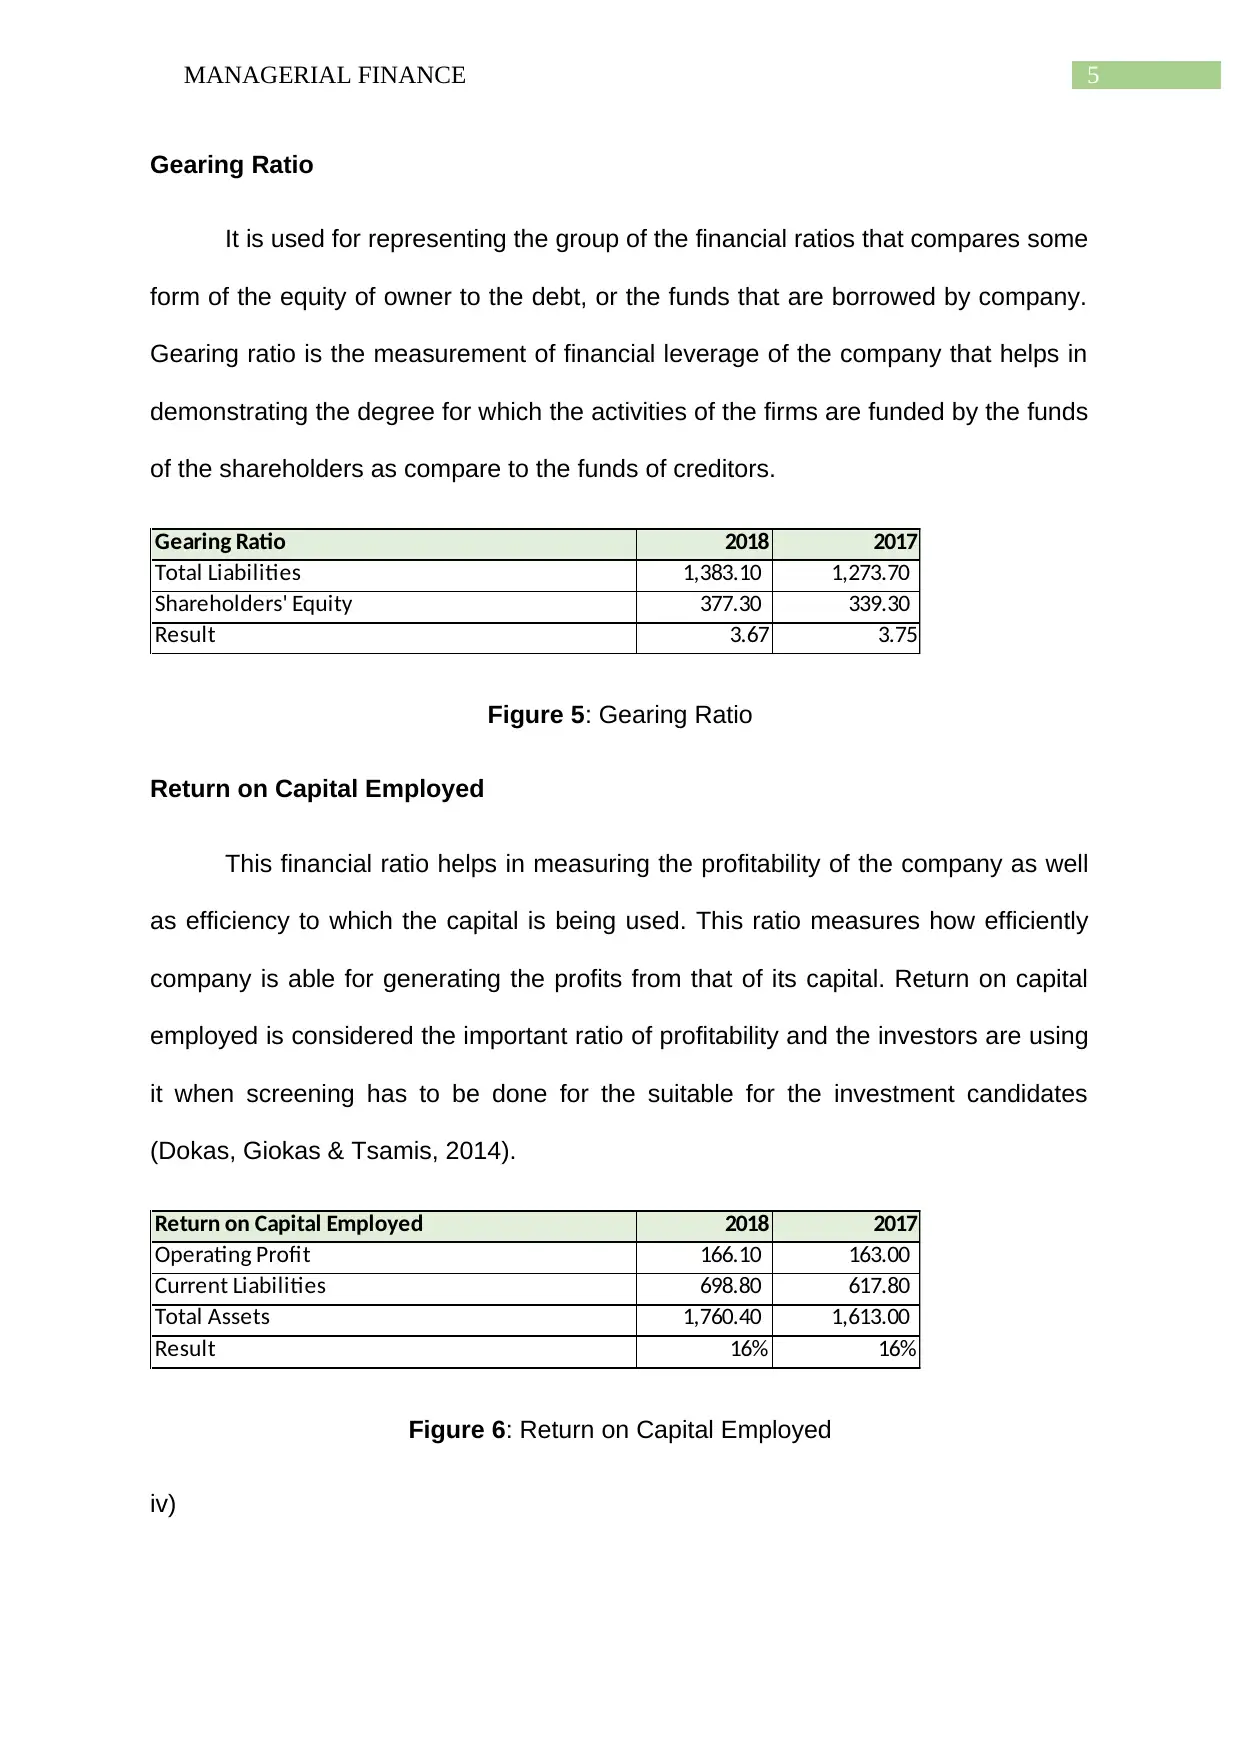
Gearing Ratio
It is used for representing the group of the financial ratios that compares some
form of the equity of owner to the debt, or the funds that are borrowed by company.
Gearing ratio is the measurement of financial leverage of the company that helps in
demonstrating the degree for which the activities of the firms are funded by the funds
of the shareholders as compare to the funds of creditors.
Gearing Ratio 2018 2017
Total Liabilities 1,383.10 1,273.70
Shareholders' Equity 377.30 339.30
Result 3.67 3.75
Figure 5: Gearing Ratio
Return on Capital Employed
This financial ratio helps in measuring the profitability of the company as well
as efficiency to which the capital is being used. This ratio measures how efficiently
company is able for generating the profits from that of its capital. Return on capital
employed is considered the important ratio of profitability and the investors are using
it when screening has to be done for the suitable for the investment candidates
(Dokas, Giokas & Tsamis, 2014).
Return on Capital Employed 2018 2017
Operating Profit 166.10 163.00
Current Liabilities 698.80 617.80
Total Assets 1,760.40 1,613.00
Result 16% 16%
Figure 6: Return on Capital Employed
iv)
⊘ This is a preview!⊘
Do you want full access?
Subscribe today to unlock all pages.
Trusted by 1+ million students worldwide
6MANAGERIAL FINANCE
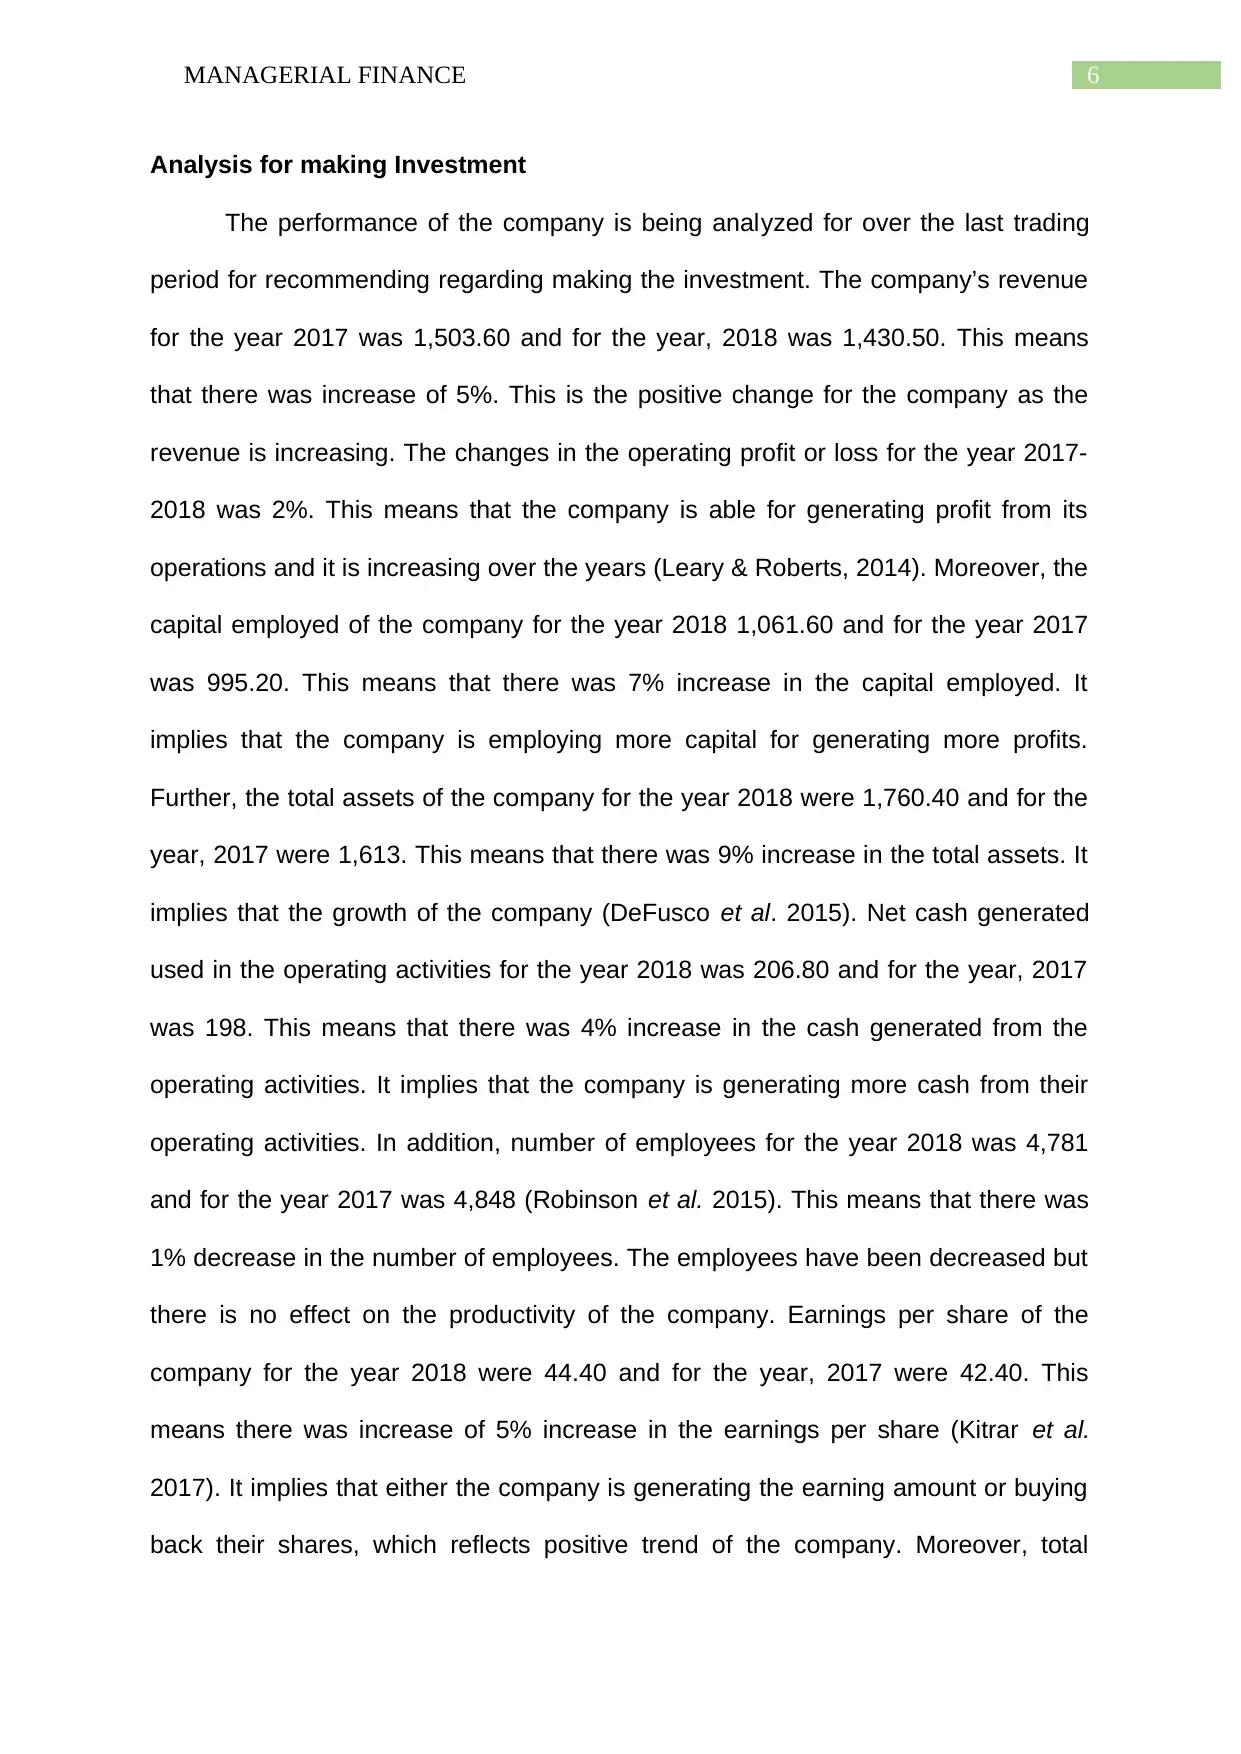
Analysis for making Investment
The performance of the company is being analyzed for over the last trading
period for recommending regarding making the investment. The company’s revenue
for the year 2017 was 1,503.60 and for the year, 2018 was 1,430.50. This means
that there was increase of 5%. This is the positive change for the company as the
revenue is increasing. The changes in the operating profit or loss for the year 2017-
2018 was 2%. This means that the company is able for generating profit from its
operations and it is increasing over the years (Leary & Roberts, 2014). Moreover, the
capital employed of the company for the year 2018 1,061.60 and for the year 2017
was 995.20. This means that there was 7% increase in the capital employed. It
implies that the company is employing more capital for generating more profits.
Further, the total assets of the company for the year 2018 were 1,760.40 and for the
year, 2017 were 1,613. This means that there was 9% increase in the total assets. It
implies that the growth of the company (DeFusco et al. 2015). Net cash generated
used in the operating activities for the year 2018 was 206.80 and for the year, 2017
was 198. This means that there was 4% increase in the cash generated from the
operating activities. It implies that the company is generating more cash from their
operating activities. In addition, number of employees for the year 2018 was 4,781
and for the year 2017 was 4,848 (Robinson et al. 2015). This means that there was
1% decrease in the number of employees. The employees have been decreased but
there is no effect on the productivity of the company. Earnings per share of the
company for the year 2018 were 44.40 and for the year, 2017 were 42.40. This
means there was increase of 5% increase in the earnings per share (Kitrar et al.
2017). It implies that either the company is generating the earning amount or buying
back their shares, which reflects positive trend of the company. Moreover, total
Paraphrase This Document
Need a fresh take? Get an instant paraphrase of this document with our AI Paraphraser
7MANAGERIAL FINANCE
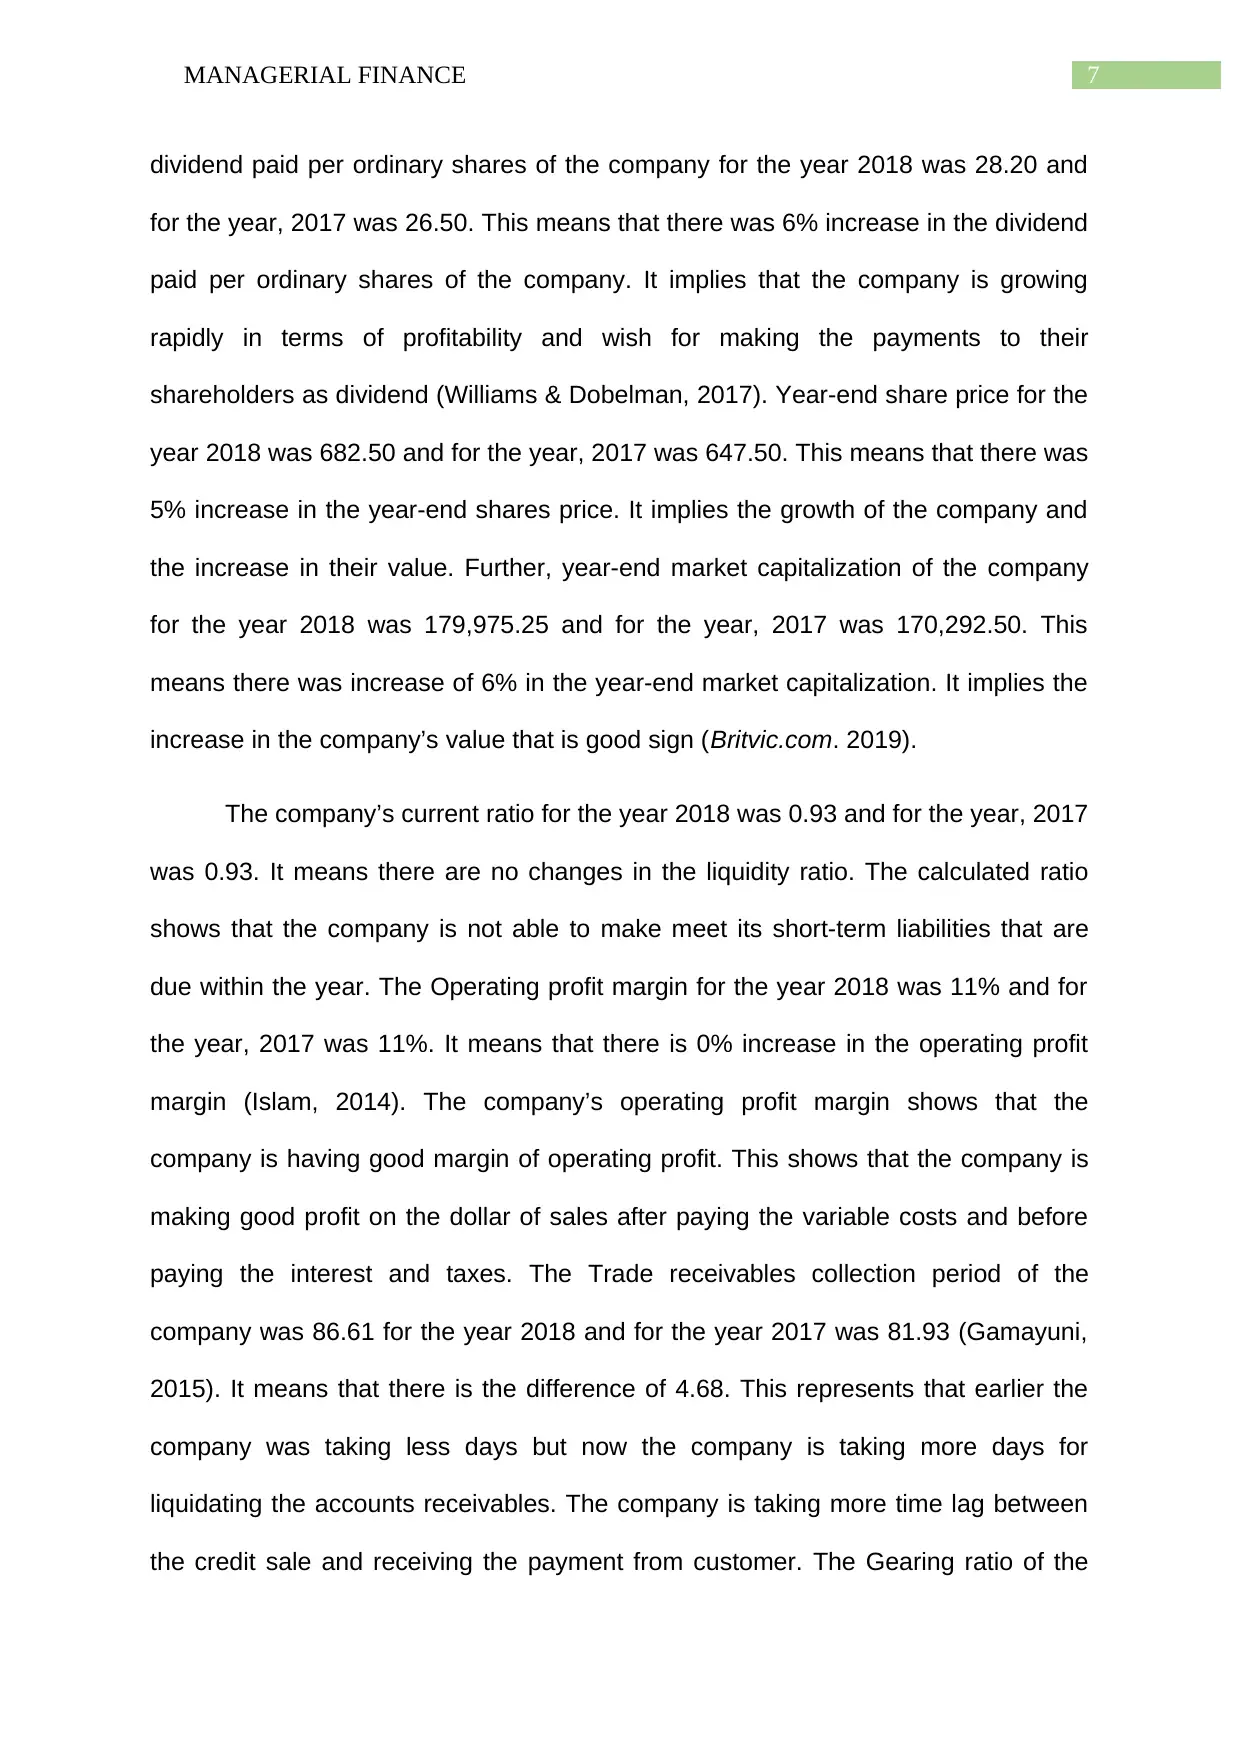
dividend paid per ordinary shares of the company for the year 2018 was 28.20 and
for the year, 2017 was 26.50. This means that there was 6% increase in the dividend
paid per ordinary shares of the company. It implies that the company is growing
rapidly in terms of profitability and wish for making the payments to their
shareholders as dividend (Williams & Dobelman, 2017). Year-end share price for the
year 2018 was 682.50 and for the year, 2017 was 647.50. This means that there was
5% increase in the year-end shares price. It implies the growth of the company and
the increase in their value. Further, year-end market capitalization of the company
for the year 2018 was 179,975.25 and for the year, 2017 was 170,292.50. This
means there was increase of 6% in the year-end market capitalization. It implies the
increase in the company’s value that is good sign (Britvic.com. 2019).
The company’s current ratio for the year 2018 was 0.93 and for the year, 2017
was 0.93. It means there are no changes in the liquidity ratio. The calculated ratio
shows that the company is not able to make meet its short-term liabilities that are
due within the year. The Operating profit margin for the year 2018 was 11% and for
the year, 2017 was 11%. It means that there is 0% increase in the operating profit
margin (Islam, 2014). The company’s operating profit margin shows that the
company is having good margin of operating profit. This shows that the company is
making good profit on the dollar of sales after paying the variable costs and before
paying the interest and taxes. The Trade receivables collection period of the
company was 86.61 for the year 2018 and for the year 2017 was 81.93 (Gamayuni,
2015). It means that there is the difference of 4.68. This represents that earlier the
company was taking less days but now the company is taking more days for
liquidating the accounts receivables. The company is taking more time lag between
the credit sale and receiving the payment from customer. The Gearing ratio of the
8MANAGERIAL FINANCE
company for the year 2018 was 367% and for the year, 2017 was 375%. It means
that there was decrease of 8%. This means that the company is using high debt
structure. Lastly, return on capital employed of the company for the year 2018 was
16% and for the year, 2017 was 16%. This means that there was no change in the
ratio. The ratios calculated shows that the company is making reasonable and
efficient uses of their capital (Enekwe, Agu & Nnagbogu, 2014).
Conclusion
Hence, it could be concluded from the above analysis that my friend should
make the investment of 5,000 shares in the company. It is because the company is
giving good return in respect of its business operations and its profitability. The
revenue of the company is growing and the operating profit is increasing. The assets
of the company is increasing, EPS is increasing. Moreover, there was increase in the
percentage of the dividend and increase in the year-end market capitalization.
Further, the liquidity position, profitability position, solvency position, efficiency level
and turnover ratio has been improved in the year 2017 in comparison with the year
2017.
⊘ This is a preview!⊘
Do you want full access?
Subscribe today to unlock all pages.
Trusted by 1+ million students worldwide
9MANAGERIAL FINANCE
Reference
(2019). Britvic.com. Retrieved 5 July 2019, from
https://www.britvic.com/~/media/Files/B/Britvic-V3/documents/pdf/presentation
/2018/annual-report-2018.pdf
Britvic.com. (2019). Home. Retrieved 5 July 2019, from https://www.britvic.com/
DeFusco, R. A., McLeavey, D. W., Pinto, J. E., Runkle, D. E., & Anson, M. J.
(2015). Quantitative investment analysis. John Wiley & Sons.
Dokas, I., Giokas, D., & Tsamis, A. (2014). Liquidity efficiency in the Greek listed
firms: a financial ratio based on data envelopment analysis. International
Journal of Corporate Finance and Accounting (IJCFA), 1(1), 40-59.
Enekwe, C. I., Agu, C. I., & Nnagbogu, E. K. (2014). The effect of financial leverage
on financial performance: Evidence of quoted pharmaceutical companies in
Nigeria. Journal of Economics and Finance, 5(3), 17-25.
Gamayuni, R. R. (2015). The effect of intangible asset, financial performance and
financial policies on the firm value. International journal of scientific &
technology research, 4(1), 202-212.
Islam, M. A. (2014). An analysis of the financial performance of national bank limited
using financial ratio. Journal of Behavioural Economics, Finance,
Entrepreneurship, Accounting and Transport, 2(5), 121-129.
Kitrar, L., Ostapkovich, G., Lipkind, T., Gumeniuk, K., & Katorgina, L. (2017). A
Comparison of Russian Practices in Industrial Statistics with Un
Recommendations: Similarities and Differences in Classifications, Data Items
Paraphrase This Document
Need a fresh take? Get an instant paraphrase of this document with our AI Paraphraser
10MANAGERIAL FINANCE
and Indicators. Higher School of Economics Research Paper No. WP
BRP, 72.
Leary, M. T., & Roberts, M. R. (2014). Do peer firms affect corporate financial
policy?. The Journal of Finance, 69(1), 139-178.
Robinson, T. R., Henry, E., Pirie, W. L., & Broihahn, M. A. (2015). International
financial statement analysis. John Wiley & Sons.
Uechi, L., Akutsu, T., Stanley, H. E., Marcus, A. J., & Kenett, D. Y. (2015). Sector
dominance ratio analysis of financial markets. Physica A: Statistical
Mechanics and its Applications, 421, 488-509.
Williams, E. E., & Dobelman, J. A. (2017). Financial statement analysis. World
Scientific Book Chapters, 109-169.
1 out of 11
Related Documents


Your All-in-One AI-Powered Toolkit for Academic Success.
+13062052269
info@desklib.com
Available 24*7 on WhatsApp / Email
![[object Object]](/_next/static/media/star-bottom.7253800d.svg)
Unlock your academic potential
Copyright © 2020–2026 A2Z Services. All Rights Reserved. Developed and managed by ZUCOL.