Managerial Finance Report: Capital Budgeting Analysis - RWE Enterprise
VerifiedAdded on 2021/06/17
|12
|2679
|71
Report
AI Summary
This report provides a detailed analysis of capital budgeting techniques applied to investment decisions for RWE Enterprise Pty Ltd. The report begins by evaluating a new plant investment, calculating Net Present Value (NPV), Internal Rate of Return (IRR), and payback period to determine its financial viability. It includes a visual representation of cash flows and a discussion of the project's profitability. The second part of the report compares two potential projects, employing the same capital budgeting methods (NPV, IRR, and payback period) to assess their suitability for investment, considering both independent and mutually exclusive scenarios. The analysis includes ranking the projects based on their financial metrics, providing recommendations for the management's decision-making process. The report emphasizes the importance of these techniques in evaluating and selecting profitable investments.

Running head: MANAGERIAL FINANCE
Managerial Finance
Name of the Student:
Name of the University:
Author’s Note
Managerial Finance
Name of the Student:
Name of the University:
Author’s Note
Paraphrase This Document
Need a fresh take? Get an instant paraphrase of this document with our AI Paraphraser
1
MANAGERIAL FINANCE
Table of Contents
Answer to Question 1......................................................................................................................2
Answer to Question 2......................................................................................................................6
Calculation of NPV, IRR and Payback Period for Project A and Project B...............................6
Analysis of the Results................................................................................................................7
Ranking of Projects......................................................................................................................8
Reference.......................................................................................................................................10
2
MANAGERIAL FINANCE
Answer to Question 1
As per the case study which is provided in the question, RWE Enterprise Pty ltd is
engaged in manufacturing business which is located in Brisbane. The company is planning to set
up a new plant which has an upfront cost of $ 3 million. The management of RWE Enterprise
wants to decide whether the business should invest in the project or not. For the purpose of
taking an appropriate decision, the management has decided to conduct capital budgeting
analysis which would be including analysis of how much cash inflows would the project be able
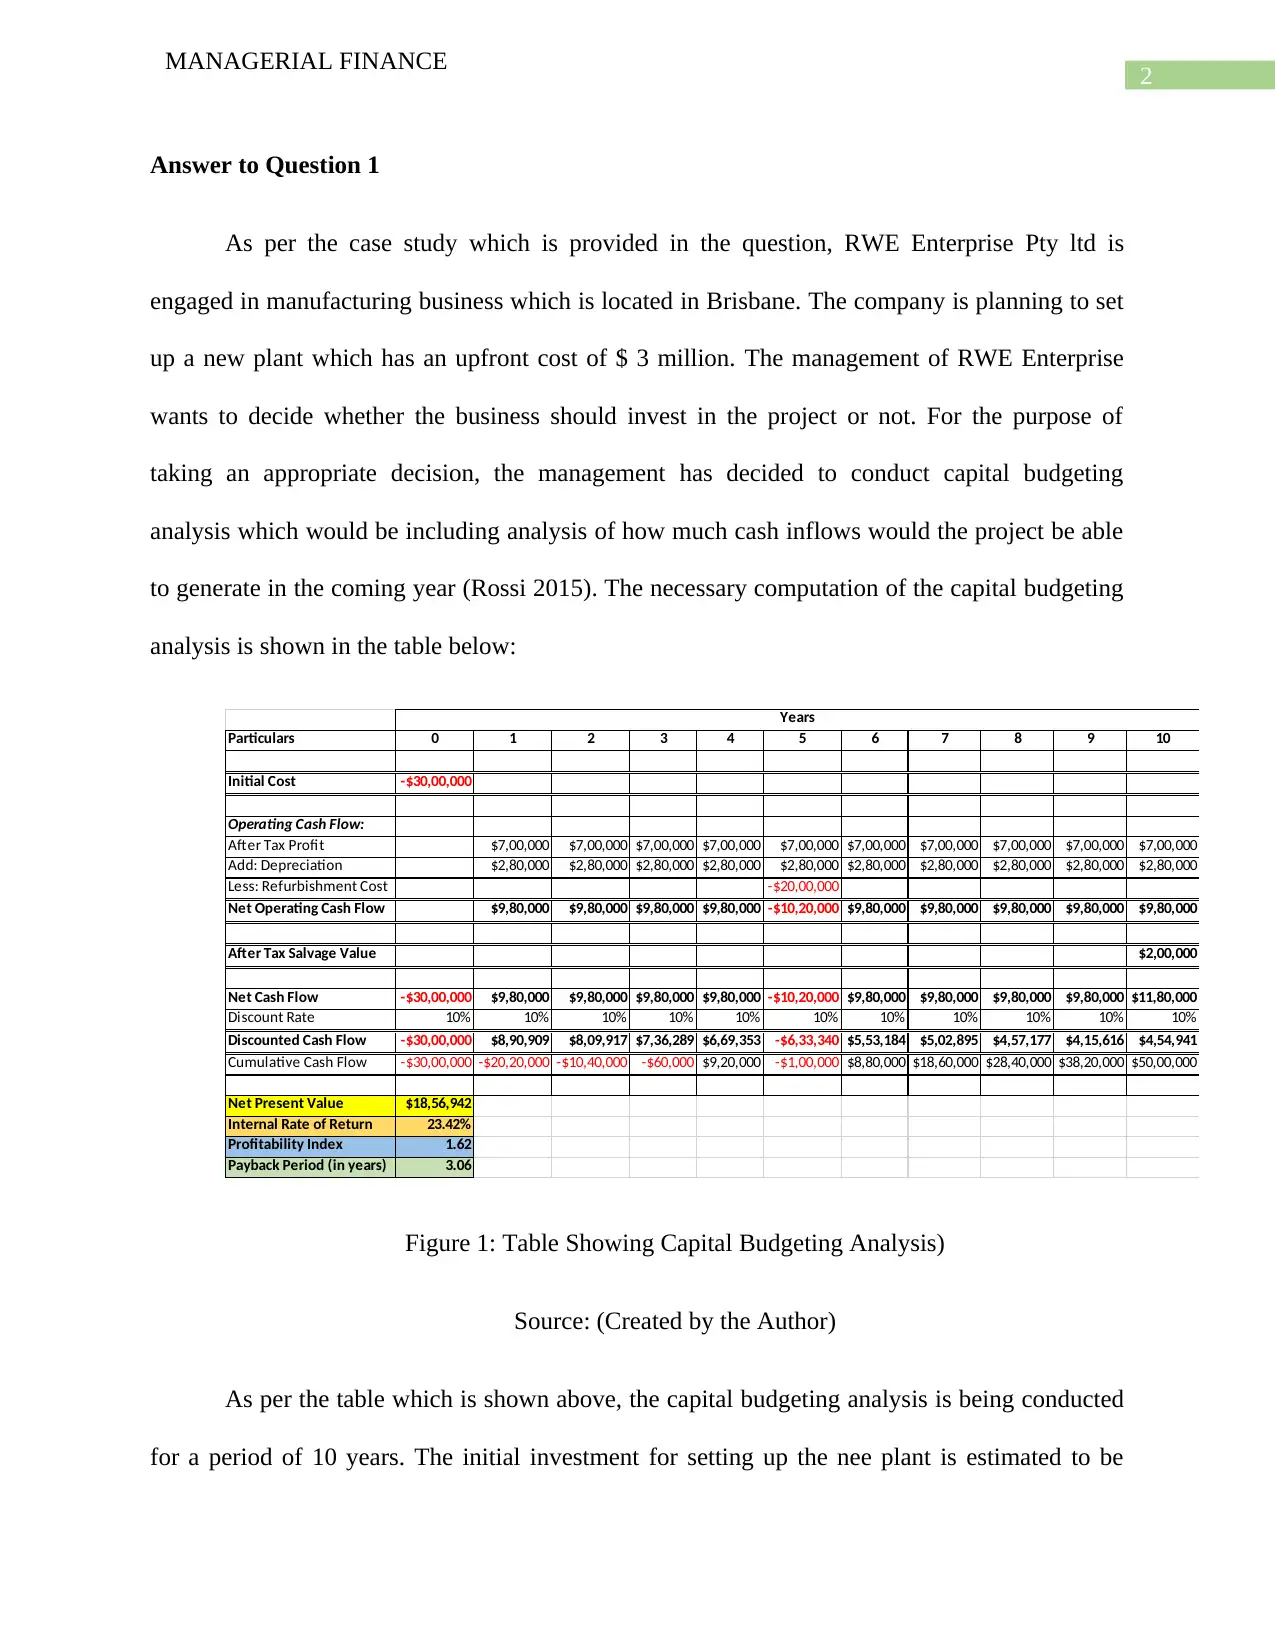
to generate in the coming year (Rossi 2015). The necessary computation of the capital budgeting
analysis is shown in the table below:
Particulars 0 1 2 3 4 5 6 7 8 9 10
Initial Cost -$30,00,000
Operating Cash Flow:
After Tax Profit $7,00,000 $7,00,000 $7,00,000 $7,00,000 $7,00,000 $7,00,000 $7,00,000 $7,00,000 $7,00,000 $7,00,000
Add: Depreciation $2,80,000 $2,80,000 $2,80,000 $2,80,000 $2,80,000 $2,80,000 $2,80,000 $2,80,000 $2,80,000 $2,80,000
Less: Refurbishment Cost -$20,00,000
Net Operating Cash Flow $9,80,000 $9,80,000 $9,80,000 $9,80,000 -$10,20,000 $9,80,000 $9,80,000 $9,80,000 $9,80,000 $9,80,000
After Tax Salvage Value $2,00,000
Net Cash Flow -$30,00,000 $9,80,000 $9,80,000 $9,80,000 $9,80,000 -$10,20,000 $9,80,000 $9,80,000 $9,80,000 $9,80,000 $11,80,000
Discount Rate 10% 10% 10% 10% 10% 10% 10% 10% 10% 10% 10%
Discounted Cash Flow -$30,00,000 $8,90,909 $8,09,917 $7,36,289 $6,69,353 -$6,33,340 $5,53,184 $5,02,895 $4,57,177 $4,15,616 $4,54,941
Cumulative Cash Flow -$30,00,000 -$20,20,000 -$10,40,000 -$60,000 $9,20,000 -$1,00,000 $8,80,000 $18,60,000 $28,40,000 $38,20,000 $50,00,000
Net Present Value $18,56,942
Internal Rate of Return 23.42%
Profitability Index 1.62
Payback Period (in years) 3.06
Years
Figure 1: Table Showing Capital Budgeting Analysis)
Source: (Created by the Author)
As per the table which is shown above, the capital budgeting analysis is being conducted
for a period of 10 years. The initial investment for setting up the nee plant is estimated to be
MANAGERIAL FINANCE
Answer to Question 1
As per the case study which is provided in the question, RWE Enterprise Pty ltd is
engaged in manufacturing business which is located in Brisbane. The company is planning to set
up a new plant which has an upfront cost of $ 3 million. The management of RWE Enterprise
wants to decide whether the business should invest in the project or not. For the purpose of
taking an appropriate decision, the management has decided to conduct capital budgeting
analysis which would be including analysis of how much cash inflows would the project be able
to generate in the coming year (Rossi 2015). The necessary computation of the capital budgeting
analysis is shown in the table below:
Particulars 0 1 2 3 4 5 6 7 8 9 10
Initial Cost -$30,00,000
Operating Cash Flow:
After Tax Profit $7,00,000 $7,00,000 $7,00,000 $7,00,000 $7,00,000 $7,00,000 $7,00,000 $7,00,000 $7,00,000 $7,00,000
Add: Depreciation $2,80,000 $2,80,000 $2,80,000 $2,80,000 $2,80,000 $2,80,000 $2,80,000 $2,80,000 $2,80,000 $2,80,000
Less: Refurbishment Cost -$20,00,000
Net Operating Cash Flow $9,80,000 $9,80,000 $9,80,000 $9,80,000 -$10,20,000 $9,80,000 $9,80,000 $9,80,000 $9,80,000 $9,80,000
After Tax Salvage Value $2,00,000
Net Cash Flow -$30,00,000 $9,80,000 $9,80,000 $9,80,000 $9,80,000 -$10,20,000 $9,80,000 $9,80,000 $9,80,000 $9,80,000 $11,80,000
Discount Rate 10% 10% 10% 10% 10% 10% 10% 10% 10% 10% 10%
Discounted Cash Flow -$30,00,000 $8,90,909 $8,09,917 $7,36,289 $6,69,353 -$6,33,340 $5,53,184 $5,02,895 $4,57,177 $4,15,616 $4,54,941
Cumulative Cash Flow -$30,00,000 -$20,20,000 -$10,40,000 -$60,000 $9,20,000 -$1,00,000 $8,80,000 $18,60,000 $28,40,000 $38,20,000 $50,00,000
Net Present Value $18,56,942
Internal Rate of Return 23.42%
Profitability Index 1.62
Payback Period (in years) 3.06
Years
Figure 1: Table Showing Capital Budgeting Analysis)
Source: (Created by the Author)
As per the table which is shown above, the capital budgeting analysis is being conducted
for a period of 10 years. The initial investment for setting up the nee plant is estimated to be
⊘ This is a preview!⊘
Do you want full access?
Subscribe today to unlock all pages.
Trusted by 1+ million students worldwide
3
MANAGERIAL FINANCE
around $ 30,00,000. As shown in the above table, the new plant will be adding $ 7,00,000 to the
operating profit before tax in the business. The above table also shows that at the end of five
years, the business needs to incur a refurbishment costs for the plant which costs the business
around $ 20,00,000. At the end of 10 years, it is anticipated that the plant will have a salvage
value of $ 2,00,000 which will be revenues for the business. The cash flows which is estimated
to be generated with the help of new plant is shown to be $ 9,80,000 for the first four years
constantly. Then there is a significant fall in the cash flows which is shown as negative in the
fifth year as $ 10,20,000. This is mainly due to the refurbishment cost which was undertaken by
the business during the fifth years as per the estimates of the management. Thereafter at the end
of the 10th year, the plant is estimated to generate a cash flow of $ 11,80,000 which is a bit higher
due to the realization of the salvage value of the plant which the business will selling at the end
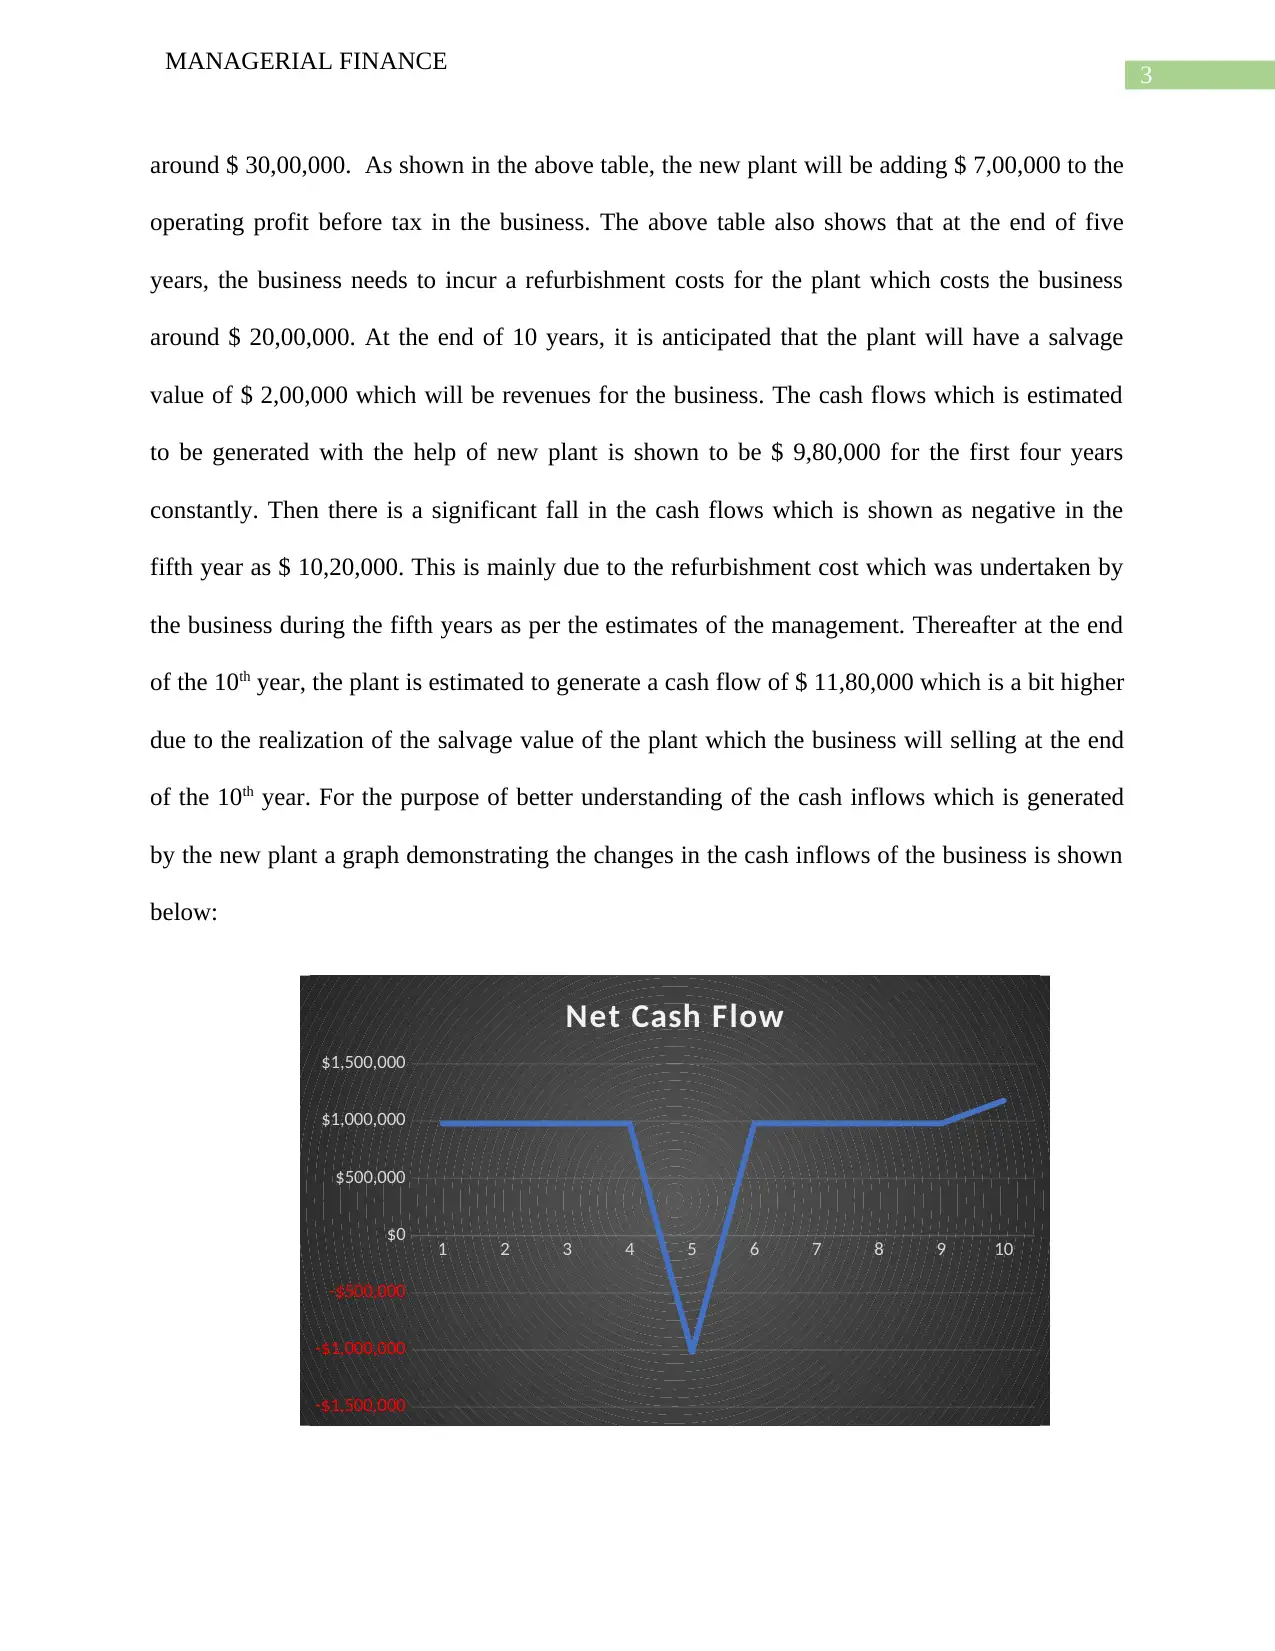
of the 10th year. For the purpose of better understanding of the cash inflows which is generated
by the new plant a graph demonstrating the changes in the cash inflows of the business is shown
below:
1 2 3 4 5 6 7 8 9 10
-$1,500,000
-$1,000,000
-$500,000
$0
$500,000
$1,000,000
$1,500,000
Net Cash Flow
MANAGERIAL FINANCE
around $ 30,00,000. As shown in the above table, the new plant will be adding $ 7,00,000 to the
operating profit before tax in the business. The above table also shows that at the end of five
years, the business needs to incur a refurbishment costs for the plant which costs the business
around $ 20,00,000. At the end of 10 years, it is anticipated that the plant will have a salvage
value of $ 2,00,000 which will be revenues for the business. The cash flows which is estimated
to be generated with the help of new plant is shown to be $ 9,80,000 for the first four years
constantly. Then there is a significant fall in the cash flows which is shown as negative in the
fifth year as $ 10,20,000. This is mainly due to the refurbishment cost which was undertaken by
the business during the fifth years as per the estimates of the management. Thereafter at the end
of the 10th year, the plant is estimated to generate a cash flow of $ 11,80,000 which is a bit higher
due to the realization of the salvage value of the plant which the business will selling at the end
of the 10th year. For the purpose of better understanding of the cash inflows which is generated
by the new plant a graph demonstrating the changes in the cash inflows of the business is shown
below:
1 2 3 4 5 6 7 8 9 10
-$1,500,000
-$1,000,000
-$500,000
$0
$500,000
$1,000,000
$1,500,000
Net Cash Flow
Paraphrase This Document
Need a fresh take? Get an instant paraphrase of this document with our AI Paraphraser
4
MANAGERIAL FINANCE
Figure 2: (Line diagram showing changes in the Net Cash flow)
Source: (Created by the Author)
As per the line diagram which is shown above, the net cash flows from the new plan t is
constant for the first four years and then there is a significantly fall in the cash inflows in the fifth
year due to extra investment for refurbishing cost which the management has to incur during the
fifth year. After the fifth year the cash flows generated is back to normal and are constant
through the useful life of the plant (Farshadfar and Monem 2013). There is no growth in the cash
flows and the cash inflows of the business remains constant as shown in the above graph except
for the estimates of the fifth year.
For the purpose of estimating the worthiness of the new product line which RWE
Enterprise Pty ltd is intending to invest in, the company has decided to conduct NPV analysis.
NPV analysis is used by business to estimate the net cash inflows from a project and also judge
whether the product is worth investing in or not (Matos et al. 2015). NPV analysis is considered
to be one of the most popular methods of determining whether the investment decision as
intended by the management is appropriate or not (Peña, Azevedo and Ferreira 2014). For the
purpose of calculating the NPV of the product line, the discounted rate is assumed to be same for
every year and the same is shown in the above table as 10%. The NPV as calculated for the
project is shown to be $ 18,56,942 which suggest that the product will be generating appropriate
cash inflows for the business. In addition to this, judging by the NPV analysis which is shown in
the table above, RWE Enterprise should invest in the project. The NPV analysis also shows that
it can be clearly estimated that the cash inflows of the business is much more than the cash
5
MANAGERIAL FINANCE
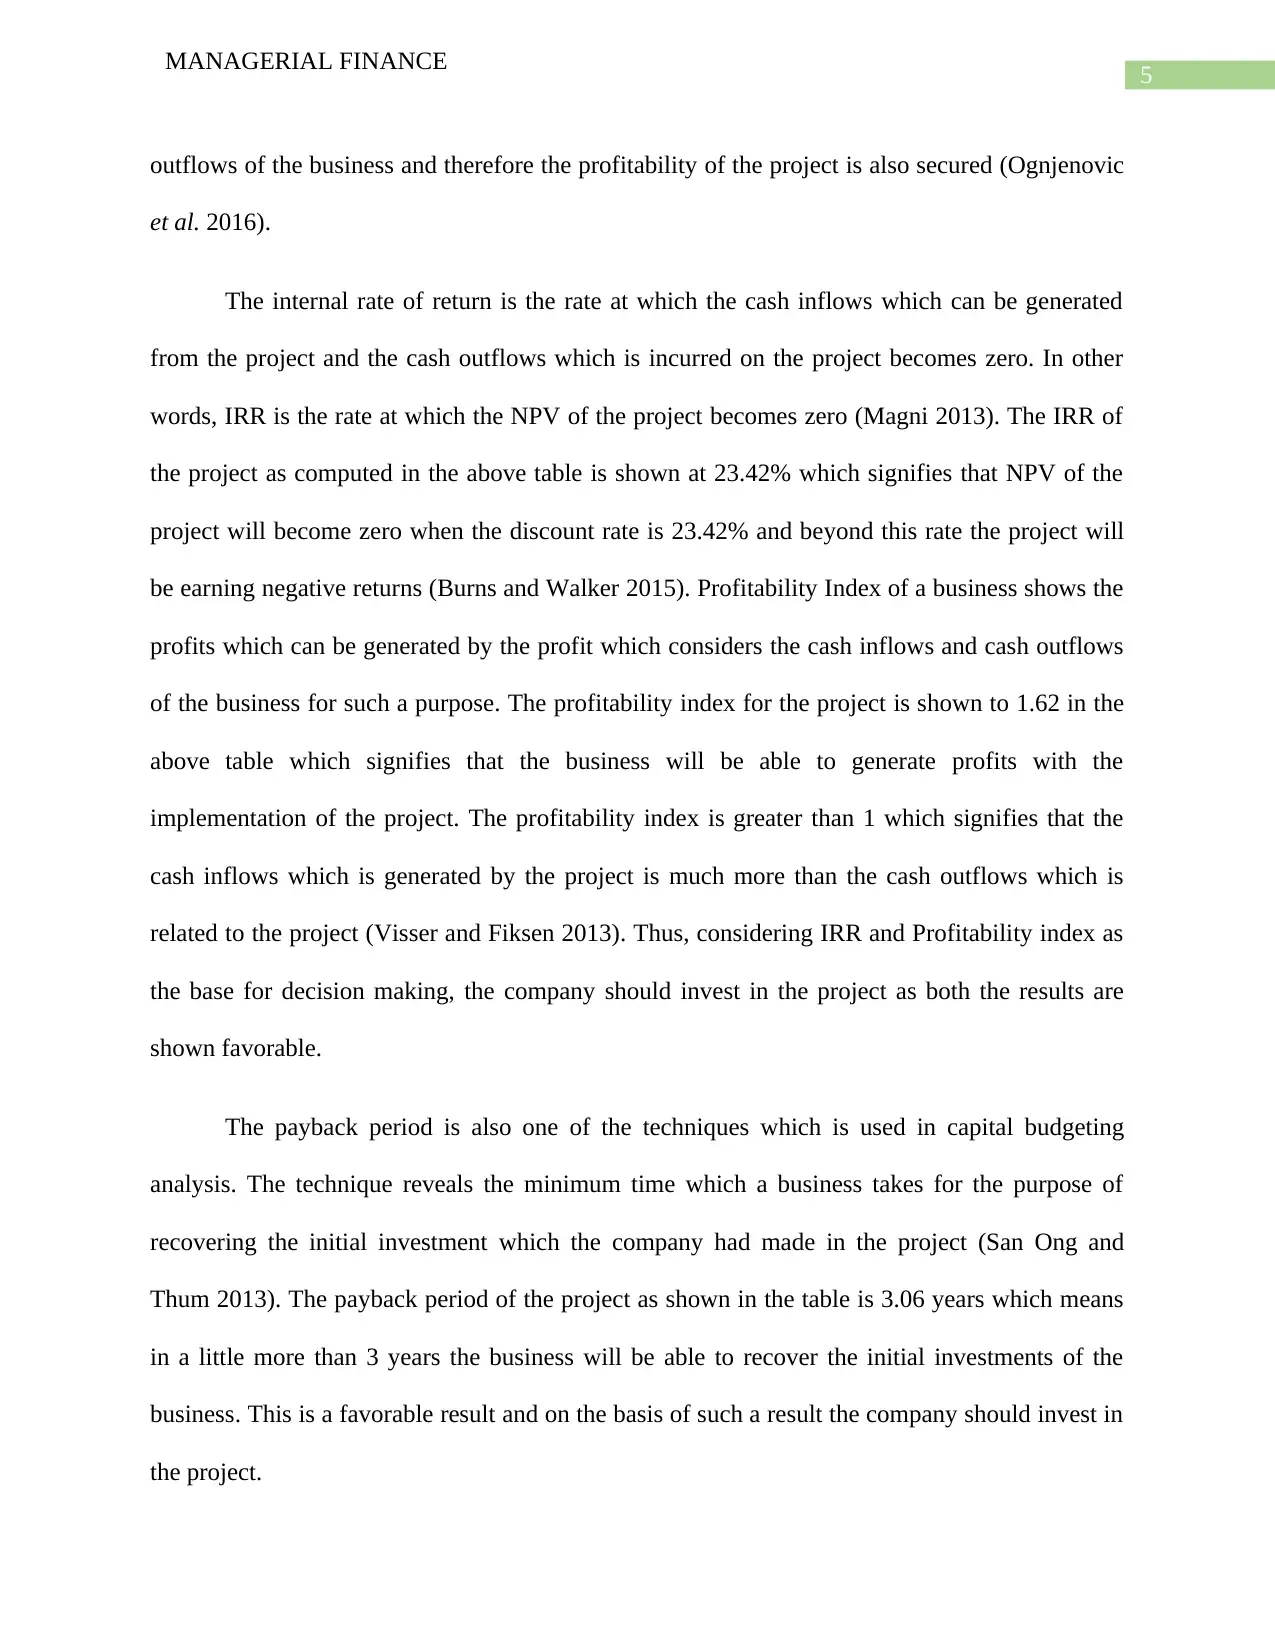
outflows of the business and therefore the profitability of the project is also secured (Ognjenovic
et al. 2016).
The internal rate of return is the rate at which the cash inflows which can be generated
from the project and the cash outflows which is incurred on the project becomes zero. In other
words, IRR is the rate at which the NPV of the project becomes zero (Magni 2013). The IRR of
the project as computed in the above table is shown at 23.42% which signifies that NPV of the
project will become zero when the discount rate is 23.42% and beyond this rate the project will
be earning negative returns (Burns and Walker 2015). Profitability Index of a business shows the
profits which can be generated by the profit which considers the cash inflows and cash outflows
of the business for such a purpose. The profitability index for the project is shown to 1.62 in the
above table which signifies that the business will be able to generate profits with the
implementation of the project. The profitability index is greater than 1 which signifies that the
cash inflows which is generated by the project is much more than the cash outflows which is
related to the project (Visser and Fiksen 2013). Thus, considering IRR and Profitability index as
the base for decision making, the company should invest in the project as both the results are
shown favorable.
The payback period is also one of the techniques which is used in capital budgeting
analysis. The technique reveals the minimum time which a business takes for the purpose of
recovering the initial investment which the company had made in the project (San Ong and
Thum 2013). The payback period of the project as shown in the table is 3.06 years which means
in a little more than 3 years the business will be able to recover the initial investments of the
business. This is a favorable result and on the basis of such a result the company should invest in
the project.
MANAGERIAL FINANCE
outflows of the business and therefore the profitability of the project is also secured (Ognjenovic
et al. 2016).
The internal rate of return is the rate at which the cash inflows which can be generated
from the project and the cash outflows which is incurred on the project becomes zero. In other
words, IRR is the rate at which the NPV of the project becomes zero (Magni 2013). The IRR of
the project as computed in the above table is shown at 23.42% which signifies that NPV of the
project will become zero when the discount rate is 23.42% and beyond this rate the project will
be earning negative returns (Burns and Walker 2015). Profitability Index of a business shows the
profits which can be generated by the profit which considers the cash inflows and cash outflows
of the business for such a purpose. The profitability index for the project is shown to 1.62 in the
above table which signifies that the business will be able to generate profits with the
implementation of the project. The profitability index is greater than 1 which signifies that the
cash inflows which is generated by the project is much more than the cash outflows which is
related to the project (Visser and Fiksen 2013). Thus, considering IRR and Profitability index as
the base for decision making, the company should invest in the project as both the results are
shown favorable.
The payback period is also one of the techniques which is used in capital budgeting
analysis. The technique reveals the minimum time which a business takes for the purpose of
recovering the initial investment which the company had made in the project (San Ong and
Thum 2013). The payback period of the project as shown in the table is 3.06 years which means
in a little more than 3 years the business will be able to recover the initial investments of the
business. This is a favorable result and on the basis of such a result the company should invest in
the project.
⊘ This is a preview!⊘
Do you want full access?
Subscribe today to unlock all pages.
Trusted by 1+ million students worldwide
6
MANAGERIAL FINANCE
The management of RWE Enterprise considering all the results which have been
calculated in the figure 1, can accept the project and invest in the same as all the results which
have been computed are favorable.
Answer to Question 2
Calculation of NPV, IRR and Payback Period for Project A and Project B
As per the case study, the company is planning on investing in projects which have
similar cash inflows as anticipated by the business. The requirement of this part is to estimate
whether the cash inflows of the business. The management of the company wants to verify
whether the two projects which the company has in mind is worth investing or not. The
management of the company has decided to rely on Capital Budgeting practices so as to establish
the profitability of the project. The management may also select both the projects based on the
analysis of NPV, IRR and payback period (Dill, da Costa Jr and Santos 2014). The discounting
rate which is taken for the project is 12%. In order to accept any or both the projects the
conditions which needs to be fulfilled which are the payback period must be less than 3 years,
the NPV results should be a positive figure and the IRR rate should be more than the discounting
rate of the business (Gorshkov et al. 2014). The calculation for NPV analysis, payback period
analysis and IRR for both the projects is shown below in table:
Paraphrase This Document
Need a fresh take? Get an instant paraphrase of this document with our AI Paraphraser
7
MANAGERIAL FINANCE
Period Cash Flow
Discounted
Cash Flow
Cumulative
Cash Flow Cash Flow
Discounted
Cash Flow
Cumulative
Cash Flow
Discount Rate 12% 12%
0 -$2,75,000 -$2,75,000 -$2,75,000 -$2,75,000 -$2,75,000 -$2,75,000
1 $50,000 $44,643 -$2,25,000 $1,00,000 $89,286 -$1,75,000
2 $75,000 $59,790 -$1,50,000 $1,00,000 $79,719 -$75,000
3 $1,00,000 $71,178 -$50,000 $1,00,000 $71,178 $25,000
4 $1,25,000 $79,440 $75,000 $1,00,000 $63,552 $1,25,000
5 $1,75,000 $99,300 $2,50,000 $1,00,000 $56,743 $2,25,000
Payback Period
Net Present Value
Internal Rate of Return 20.97% 23.92%
Project A Project B
3.40 2.75
$85,478$79,350
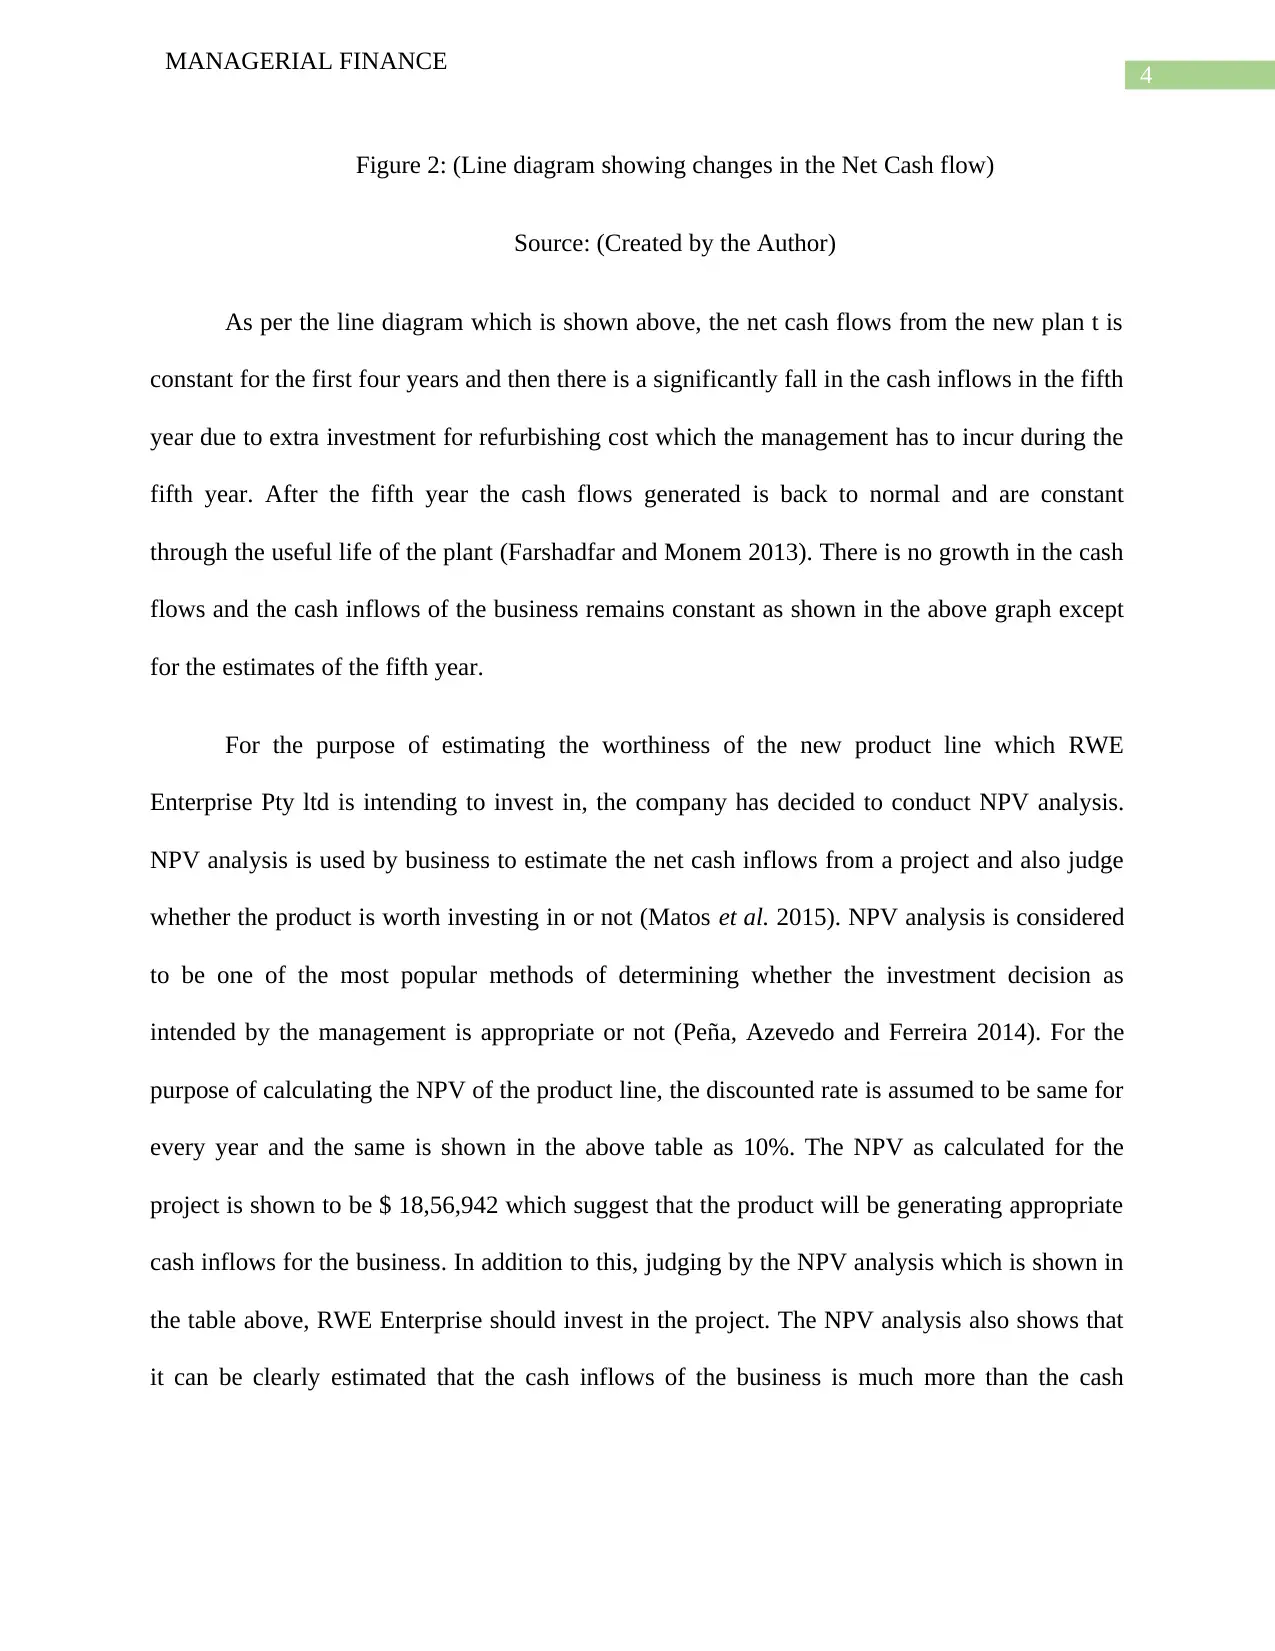
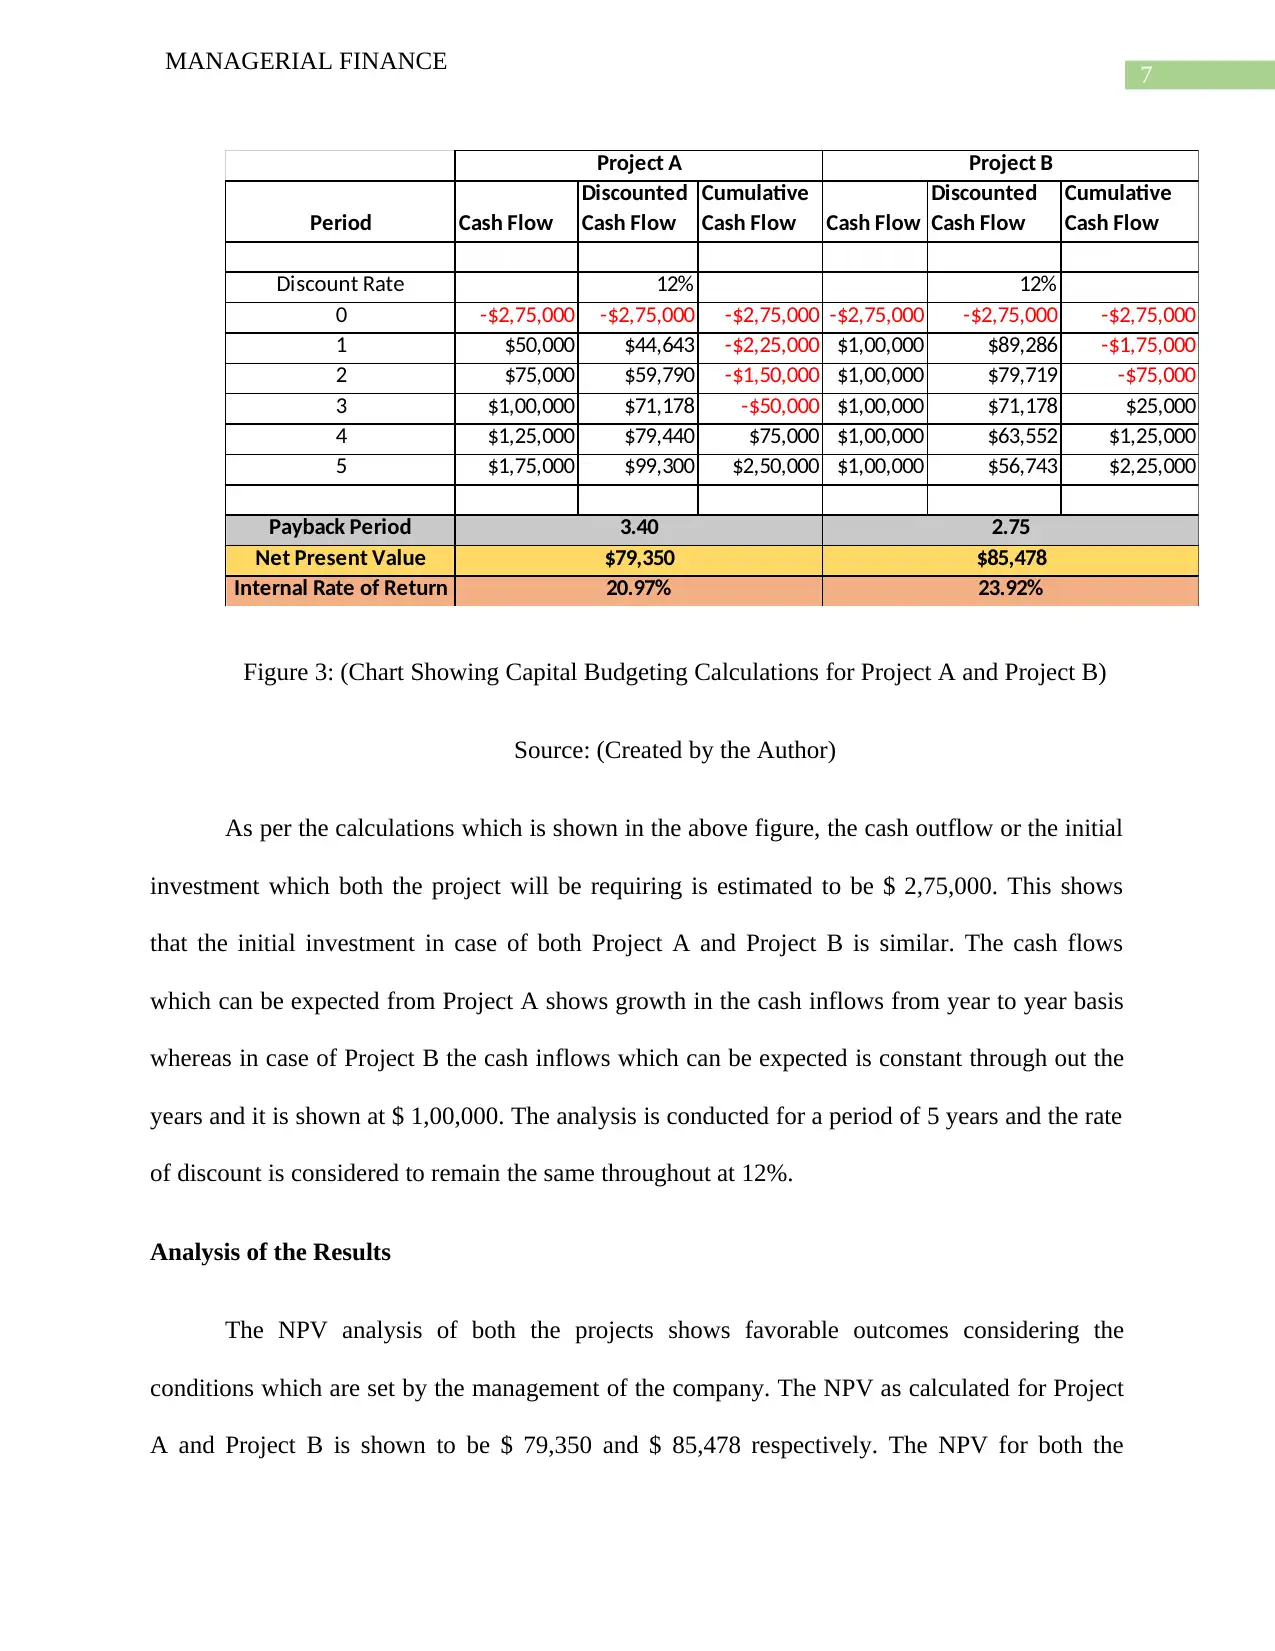
Figure 3: (Chart Showing Capital Budgeting Calculations for Project A and Project B)
Source: (Created by the Author)
As per the calculations which is shown in the above figure, the cash outflow or the initial
investment which both the project will be requiring is estimated to be $ 2,75,000. This shows
that the initial investment in case of both Project A and Project B is similar. The cash flows
which can be expected from Project A shows growth in the cash inflows from year to year basis
whereas in case of Project B the cash inflows which can be expected is constant through out the
years and it is shown at $ 1,00,000. The analysis is conducted for a period of 5 years and the rate
of discount is considered to remain the same throughout at 12%.
Analysis of the Results
The NPV analysis of both the projects shows favorable outcomes considering the
conditions which are set by the management of the company. The NPV as calculated for Project
A and Project B is shown to be $ 79,350 and $ 85,478 respectively. The NPV for both the
MANAGERIAL FINANCE
Period Cash Flow
Discounted
Cash Flow
Cumulative
Cash Flow Cash Flow
Discounted
Cash Flow
Cumulative
Cash Flow
Discount Rate 12% 12%
0 -$2,75,000 -$2,75,000 -$2,75,000 -$2,75,000 -$2,75,000 -$2,75,000
1 $50,000 $44,643 -$2,25,000 $1,00,000 $89,286 -$1,75,000
2 $75,000 $59,790 -$1,50,000 $1,00,000 $79,719 -$75,000
3 $1,00,000 $71,178 -$50,000 $1,00,000 $71,178 $25,000
4 $1,25,000 $79,440 $75,000 $1,00,000 $63,552 $1,25,000
5 $1,75,000 $99,300 $2,50,000 $1,00,000 $56,743 $2,25,000
Payback Period
Net Present Value
Internal Rate of Return 20.97% 23.92%
Project A Project B
3.40 2.75
$85,478$79,350
Figure 3: (Chart Showing Capital Budgeting Calculations for Project A and Project B)
Source: (Created by the Author)
As per the calculations which is shown in the above figure, the cash outflow or the initial
investment which both the project will be requiring is estimated to be $ 2,75,000. This shows
that the initial investment in case of both Project A and Project B is similar. The cash flows
which can be expected from Project A shows growth in the cash inflows from year to year basis
whereas in case of Project B the cash inflows which can be expected is constant through out the
years and it is shown at $ 1,00,000. The analysis is conducted for a period of 5 years and the rate
of discount is considered to remain the same throughout at 12%.
Analysis of the Results
The NPV analysis of both the projects shows favorable outcomes considering the
conditions which are set by the management of the company. The NPV as calculated for Project
A and Project B is shown to be $ 79,350 and $ 85,478 respectively. The NPV for both the
8
MANAGERIAL FINANCE
projects are shown to be positive and therefore they are favorable and can be accepted by the
management of the company considering the NPV analysis of the business. The Internal rate of
Return (IRR) which is shown to be 20.97% and 23.92% for Project A and Project B respectively.
The IRR results for both the project meets the requirement of the management and thus are
favorable in nature (Hurley, Rao and Pardey 2014). The IRR computed is more than the
discounting rate which is taken to be 12% in both the projects which suggest that both the project
can be accepted if the management considers IRR approach. The payback period of the projects
is shown to be 3.40 for project A and 2.75 for Project B. The payback period analysis for project
A does not meet the criteria which the management of the company has established whereas the
requirement of the management of a payback period of less than three years is fulfilled by
Project B. Therefore, Project A should not be accepted and Project B should be accepted.
If the assumption is made that the two projects are independent to each other than the
management of the company should select Project B as the best option as Project A ‘s payback
period which is computed to be 3.40 years is more than the criteria which is established by the
business. The requirement of the business is to accept a project which has a payback period
which is less than 3 years. Therefore, the management will be selecting project A and will be
rejecting project B.
Ranking of Projects
In this situation it is assumed that the projects are mutually exclusive and therefore one of
the project is to be selected out of the two options. The ranking on the basis of a favorable results
are shown in the figure below:
Particular Project A Remarks Rank Project B Remarks Rank
⊘ This is a preview!⊘
Do you want full access?
Subscribe today to unlock all pages.
Trusted by 1+ million students worldwide
9
MANAGERIAL FINANCE
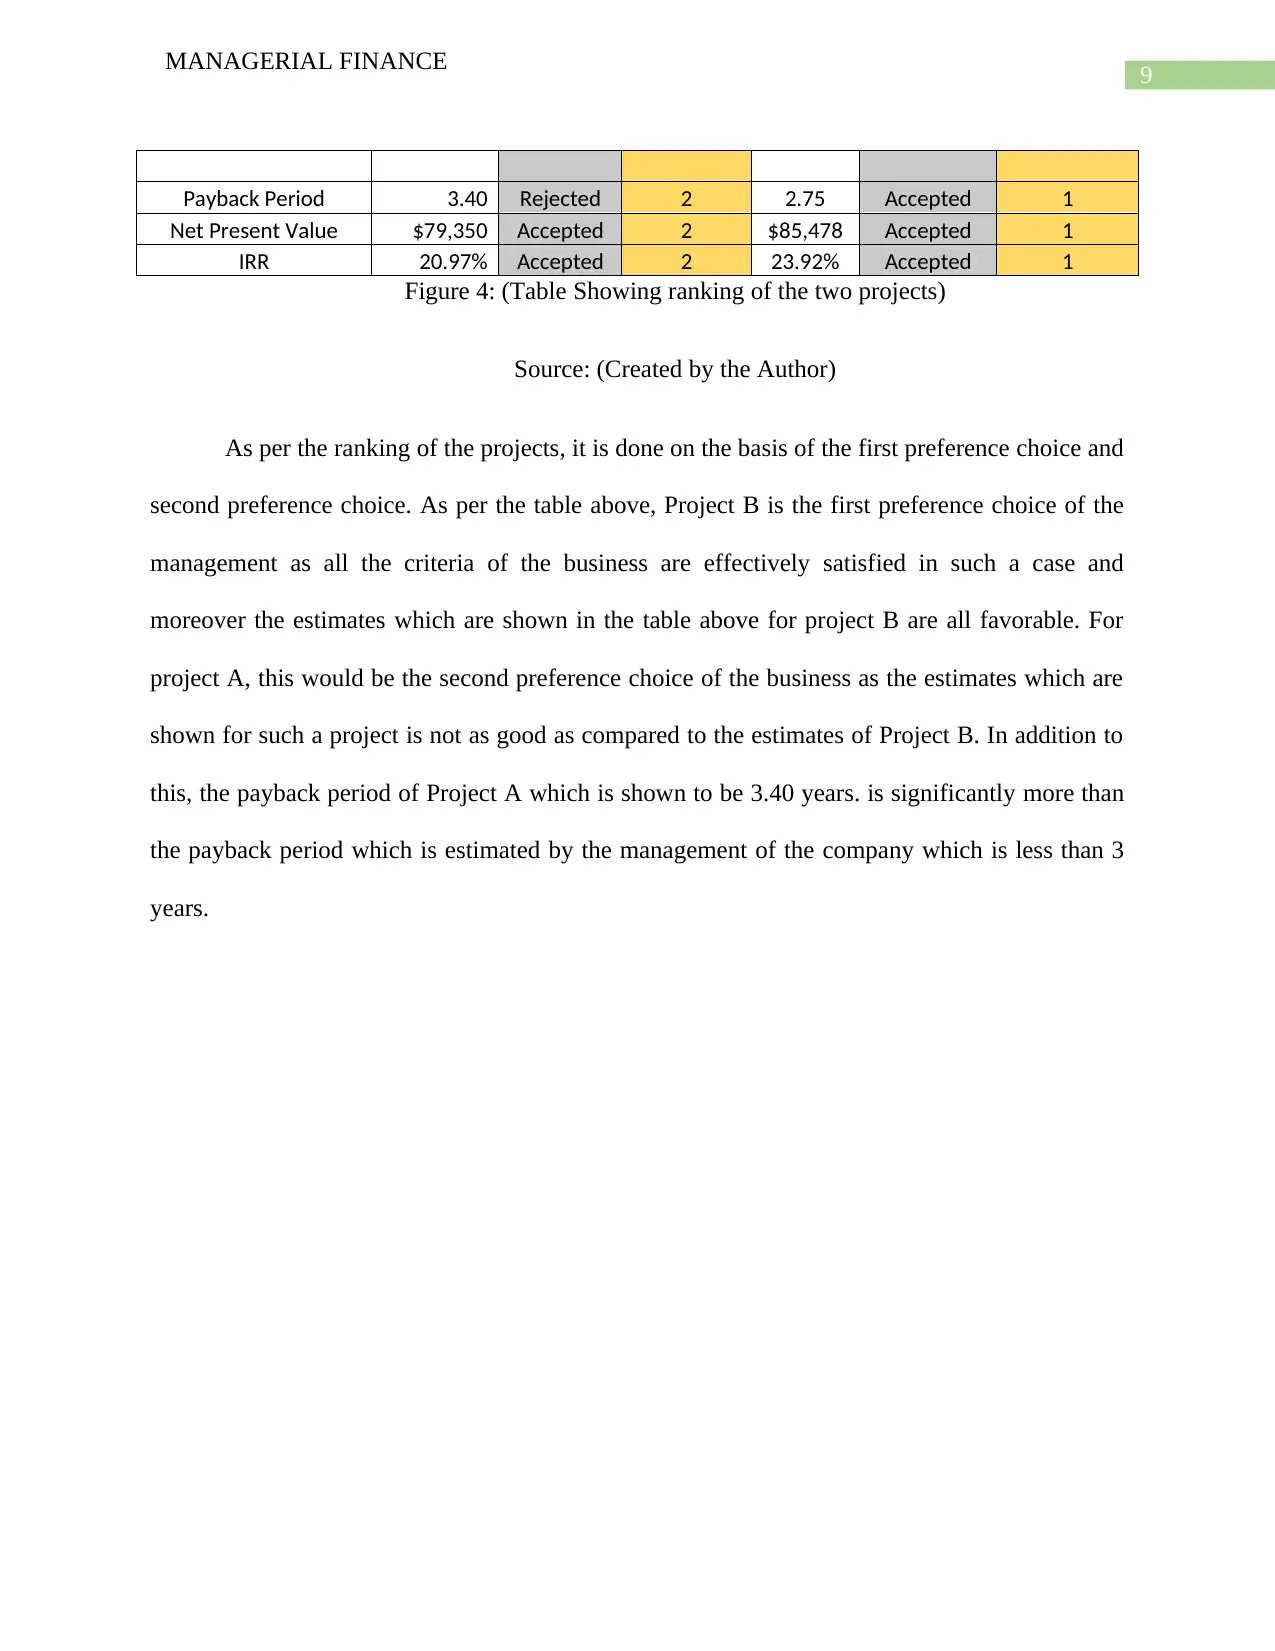
Payback Period 3.40 Rejected 2 2.75 Accepted 1
Net Present Value $79,350 Accepted 2 $85,478 Accepted 1
IRR 20.97% Accepted 2 23.92% Accepted 1
Figure 4: (Table Showing ranking of the two projects)
Source: (Created by the Author)
As per the ranking of the projects, it is done on the basis of the first preference choice and
second preference choice. As per the table above, Project B is the first preference choice of the
management as all the criteria of the business are effectively satisfied in such a case and
moreover the estimates which are shown in the table above for project B are all favorable. For
project A, this would be the second preference choice of the business as the estimates which are
shown for such a project is not as good as compared to the estimates of Project B. In addition to
this, the payback period of Project A which is shown to be 3.40 years. is significantly more than
the payback period which is estimated by the management of the company which is less than 3
years.
MANAGERIAL FINANCE
Payback Period 3.40 Rejected 2 2.75 Accepted 1
Net Present Value $79,350 Accepted 2 $85,478 Accepted 1
IRR 20.97% Accepted 2 23.92% Accepted 1
Figure 4: (Table Showing ranking of the two projects)
Source: (Created by the Author)
As per the ranking of the projects, it is done on the basis of the first preference choice and
second preference choice. As per the table above, Project B is the first preference choice of the
management as all the criteria of the business are effectively satisfied in such a case and
moreover the estimates which are shown in the table above for project B are all favorable. For
project A, this would be the second preference choice of the business as the estimates which are
shown for such a project is not as good as compared to the estimates of Project B. In addition to
this, the payback period of Project A which is shown to be 3.40 years. is significantly more than
the payback period which is estimated by the management of the company which is less than 3
years.
Paraphrase This Document
Need a fresh take? Get an instant paraphrase of this document with our AI Paraphraser
10
MANAGERIAL FINANCE
Reference
Burns, R. and Walker, J., 2015. Capital budgeting surveys: the future is now.
Dill, R., da Costa Jr, N. and Santos, A.A., 2014. Corporate profitability analysis: a novel
application for paraconsistent logic. Applied Mathematical Sciences, 8(26), pp.1271-1288.
Farshadfar, S. and Monem, R., 2013. Further evidence on the usefulness of direct method cash
flow components for forecasting future cash flows. The international journal of accounting,
48(1), pp.111-133.
Gorshkov, A.S., Rymkevich, P.P., Nemova, D.V. and Vatin, N.I., 2014. Method of calculating
the payback period of investment for renovation of building facades. Stroitel'stvo Unikal'nyh
Zdanij i Sooruzenij, (2), p.82.
11
MANAGERIAL FINANCE
Hurley, T.M., Rao, X. and Pardey, P.G., 2014. Re-examining the reported rates of return to food
and agricultural research and development. American Journal of Agricultural Economics, 96(5),
pp.1492-1504.
Magni, C.A., 2013. The internal rate of return approach and the AIRR paradigm: a refutation and
a corroboration. The Engineering Economist, 58(2), pp.73-111.
Matos, C., Bentes, I., Santos, C., Imteaz, M. and Pereira, S., 2015. Economic analysis of a
rainwater harvesting system in a commercial building. Water resources management, 29(11),
pp.3971-3986.
Ognjenovic, S., Ishkov, A., Cvetkovic, D., Peric, D. and Romanovich, M., 2016. Analyses of
Costs and Benefits in the Pavement Management Systems. Procedia Engineering, 165, pp.954-
959.
Peña, I., Azevedo, I.L. and Ferreira, L.A.F.M., 2014. Economic analysis of the profitability of
existing wind parks in Portugal. Energy Economics, 45, pp.353-363.
Rossi, M., 2015. The use of capital budgeting techniques: an outlook from Italy. International
Journal of Management Practice, 8(1), pp.43-56.
San Ong, T. and Thum, C.H., 2013. Net present value and payback period for building integrated
photovoltaic projects in Malaysia. International Journal of Academic Research in Business and
Social Sciences, 3(2), p.153.
Visser, A.W. and Fiksen, Ø., 2013. Optimal foraging in marine ecosystem models: selectivity,
profitability and switching. Marine Ecology Progress Series, 473, pp.91-101.
⊘ This is a preview!⊘
Do you want full access?
Subscribe today to unlock all pages.
Trusted by 1+ million students worldwide
1 out of 12
Related Documents


Your All-in-One AI-Powered Toolkit for Academic Success.
+13062052269
info@desklib.com
Available 24*7 on WhatsApp / Email
![[object Object]](/_next/static/media/star-bottom.7253800d.svg)
Unlock your academic potential
Copyright © 2020–2026 A2Z Services. All Rights Reserved. Developed and managed by ZUCOL.