Managerial Finance: Portfolio Analysis, Investment Appraisal Report
VerifiedAdded on 2022/12/30
|18
|3711
|70
Report
AI Summary
This report delves into managerial finance, commencing with an introduction to financial decision-making and its significance. It presents a detailed portfolio analysis, calculating and interpreting various financial ratios such as current, quick, net profit margin, gross profit margin, gearing ratio, P/E ratio, earnings per share, return on capital employed, and dividend payout ratio for Tesco and Sainsbury companies. The analysis highlights the financial positions of both companies, followed by recommendations for the underperforming entity. The report also addresses the limitations of financial ratios. Furthermore, it explores capital investment appraisal, discussing the evaluation of potential projects (A and B) for Ross Hill Limited, including their initial investments. The report concludes by acknowledging the limitations of investment appraisal techniques in long-term decision-making.
Managerial Finance
Paraphrase This Document
Need a fresh take? Get an instant paraphrase of this document with our AI Paraphraser
Table of Contents
INTRODUCTION...........................................................................................................................3
Portfolio 1........................................................................................................................................3
Calculation of financial ratios......................................................................................................3
Analysis financial position of companies....................................................................................7
Recommendations for poorly performing company....................................................................9
Limitation of financial ratios.....................................................................................................10
A.Capital Investment Appraisal.................................................................................................11
B. Limitations of using investment appraisal techniques in long term decision-making..........14
CONCLUSION..............................................................................................................................15
REFERENCES................................................................................................................................1
INTRODUCTION
Financial decision-making is about to make the decisions in relation to company's
business operations on the basis of the financial position reflected in company's books of
accounts (Pazarskis and et.al., 2018). This report will indicate about the ratios in respect to
different business organisation. Interpretation will also done over the financial ratios calculated
in the first half of report to identify the financial position of the organisation. Necessary
recommendations will also provide to improve or boost the overall financial performance of
organisation. Furthermore, this project will also talk about the investment decision-making with
the use of different methods in respect to the organisation.
Portfolio 1
Calculation of financial ratios
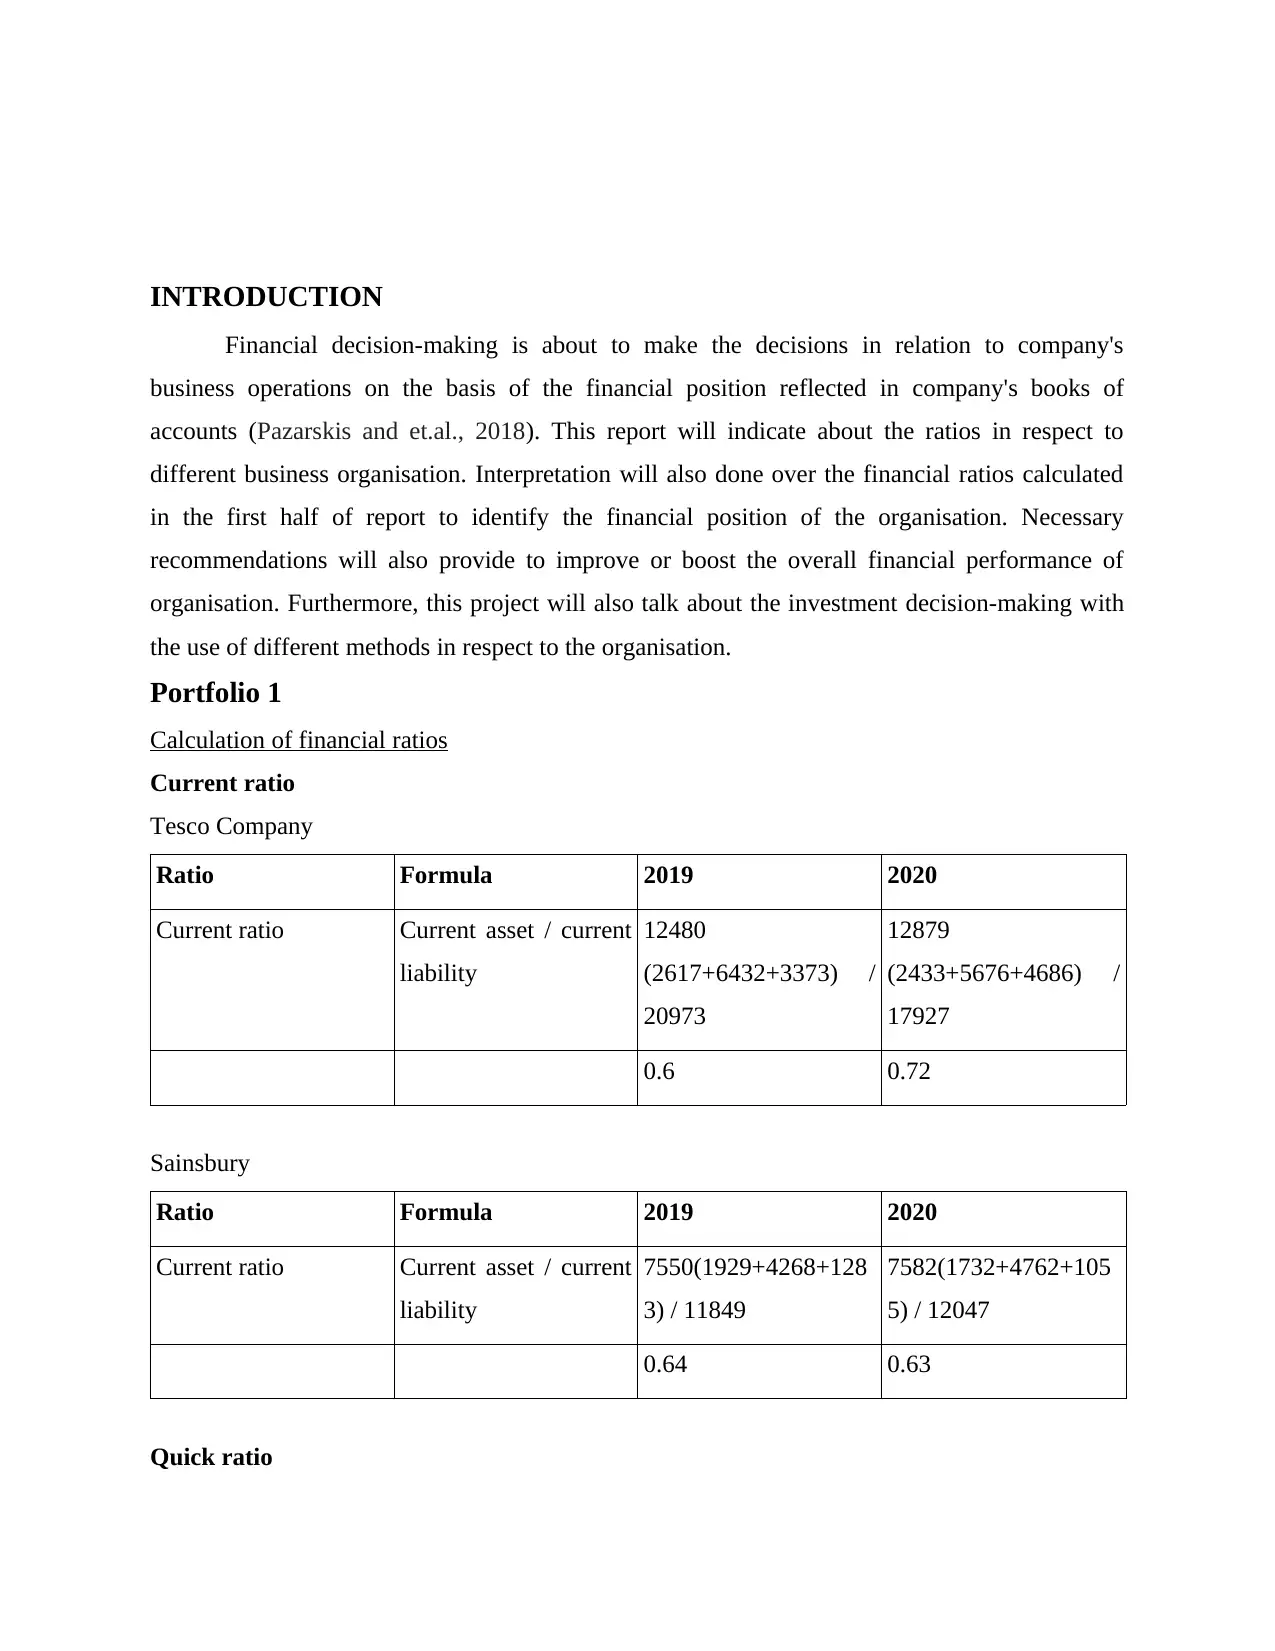
Current ratio
Tesco Company
Ratio Formula 2019 2020
Current ratio Current asset / current
liability
12480
(2617+6432+3373) /
20973
12879
(2433+5676+4686) /
17927
0.6 0.72
Sainsbury
Ratio Formula 2019 2020
Current ratio Current asset / current
liability
7550(1929+4268+128
3) / 11849
7582(1732+4762+105
5) / 12047
0.64 0.63
Quick ratio
Financial decision-making is about to make the decisions in relation to company's
business operations on the basis of the financial position reflected in company's books of
accounts (Pazarskis and et.al., 2018). This report will indicate about the ratios in respect to
different business organisation. Interpretation will also done over the financial ratios calculated
in the first half of report to identify the financial position of the organisation. Necessary
recommendations will also provide to improve or boost the overall financial performance of
organisation. Furthermore, this project will also talk about the investment decision-making with
the use of different methods in respect to the organisation.
Portfolio 1
Calculation of financial ratios
Current ratio
Tesco Company
Ratio Formula 2019 2020
Current ratio Current asset / current
liability
12480
(2617+6432+3373) /
20973
12879
(2433+5676+4686) /
17927
0.6 0.72
Sainsbury
Ratio Formula 2019 2020
Current ratio Current asset / current
liability
7550(1929+4268+128
3) / 11849
7582(1732+4762+105
5) / 12047
0.64 0.63
Quick ratio
⊘ This is a preview!⊘
Do you want full access?
Subscribe today to unlock all pages.
Trusted by 1+ million students worldwide
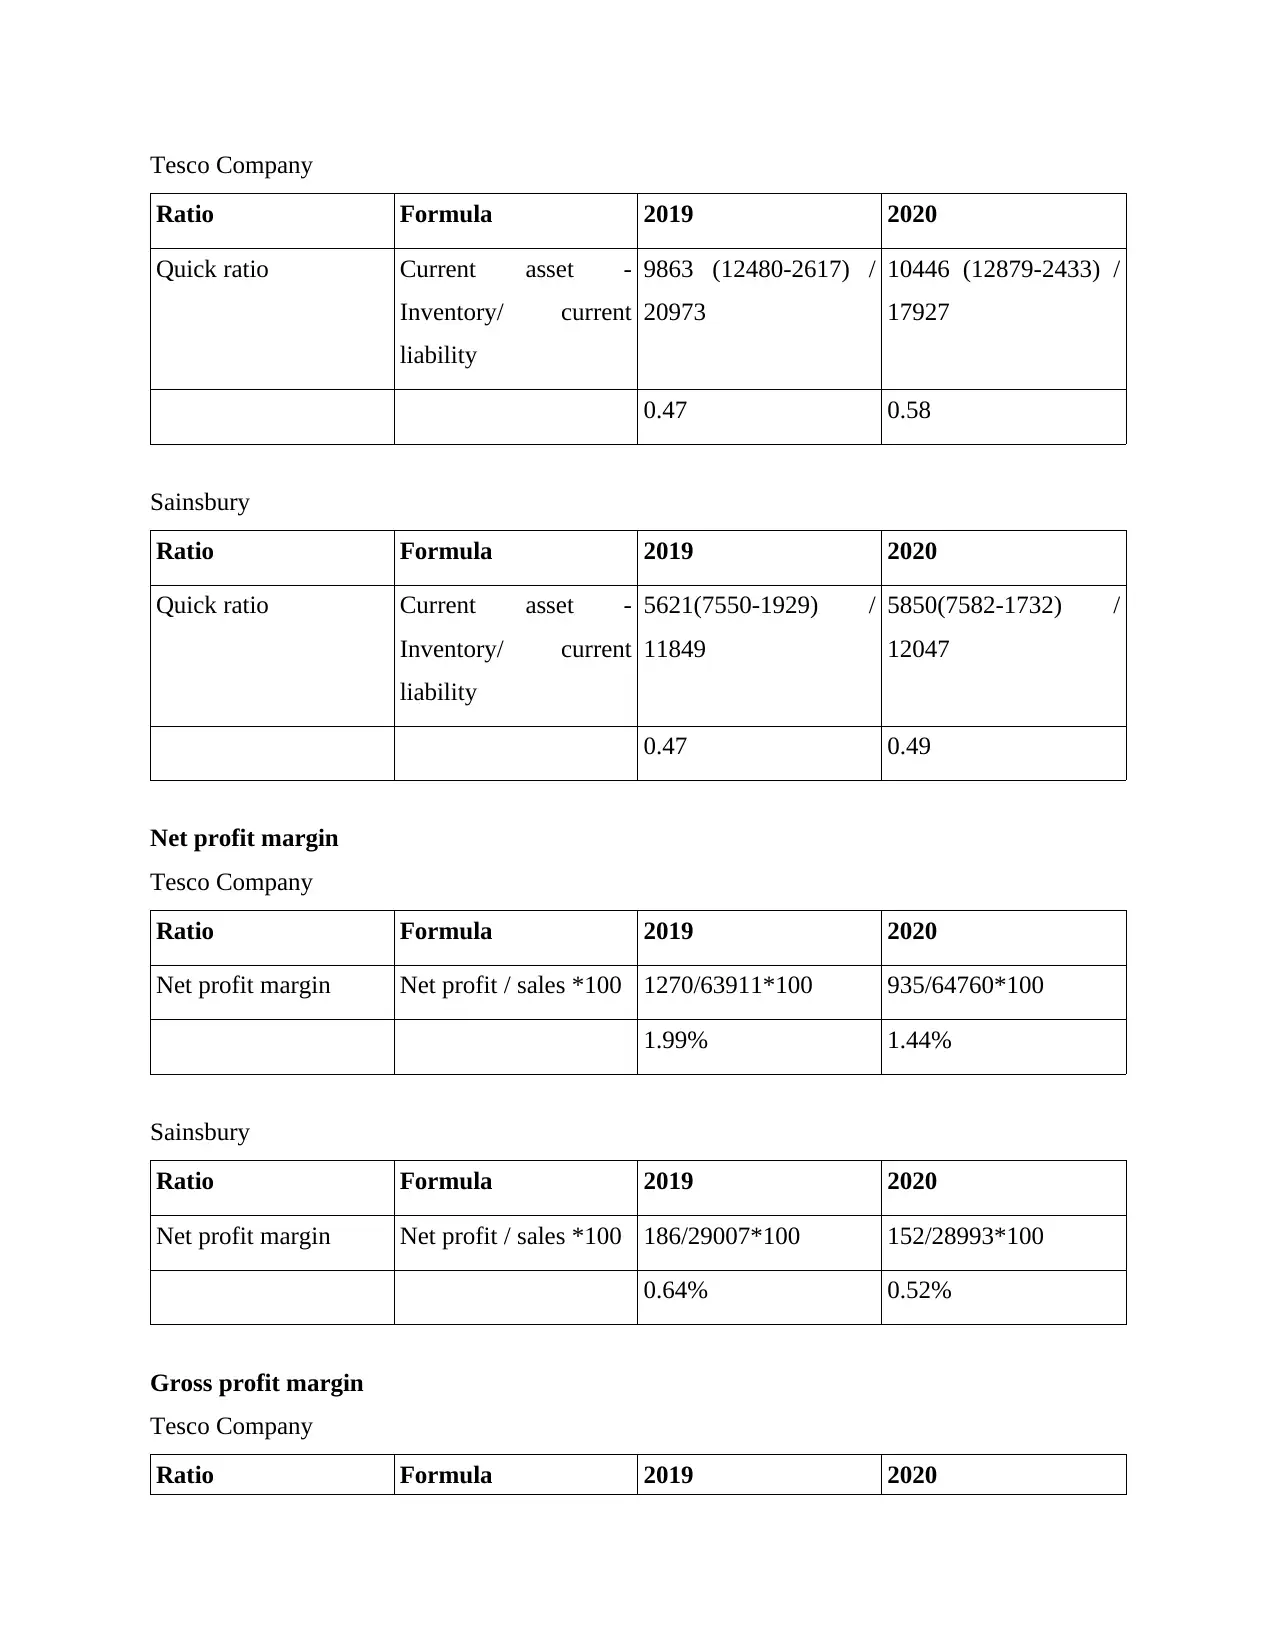
Tesco Company
Ratio Formula 2019 2020
Quick ratio Current asset -
Inventory/ current
liability
9863 (12480-2617) /
20973
10446 (12879-2433) /
17927
0.47 0.58
Sainsbury
Ratio Formula 2019 2020
Quick ratio Current asset -
Inventory/ current
liability
5621(7550-1929) /
11849
5850(7582-1732) /
12047
0.47 0.49
Net profit margin
Tesco Company
Ratio Formula 2019 2020
Net profit margin Net profit / sales *100 1270/63911*100 935/64760*100
1.99% 1.44%
Sainsbury
Ratio Formula 2019 2020
Net profit margin Net profit / sales *100 186/29007*100 152/28993*100
0.64% 0.52%
Gross profit margin
Tesco Company
Ratio Formula 2019 2020
Ratio Formula 2019 2020
Quick ratio Current asset -
Inventory/ current
liability
9863 (12480-2617) /
20973
10446 (12879-2433) /
17927
0.47 0.58
Sainsbury
Ratio Formula 2019 2020
Quick ratio Current asset -
Inventory/ current
liability
5621(7550-1929) /
11849
5850(7582-1732) /
12047
0.47 0.49
Net profit margin
Tesco Company
Ratio Formula 2019 2020
Net profit margin Net profit / sales *100 1270/63911*100 935/64760*100
1.99% 1.44%
Sainsbury
Ratio Formula 2019 2020
Net profit margin Net profit / sales *100 186/29007*100 152/28993*100
0.64% 0.52%
Gross profit margin
Tesco Company
Ratio Formula 2019 2020
Paraphrase This Document
Need a fresh take? Get an instant paraphrase of this document with our AI Paraphraser
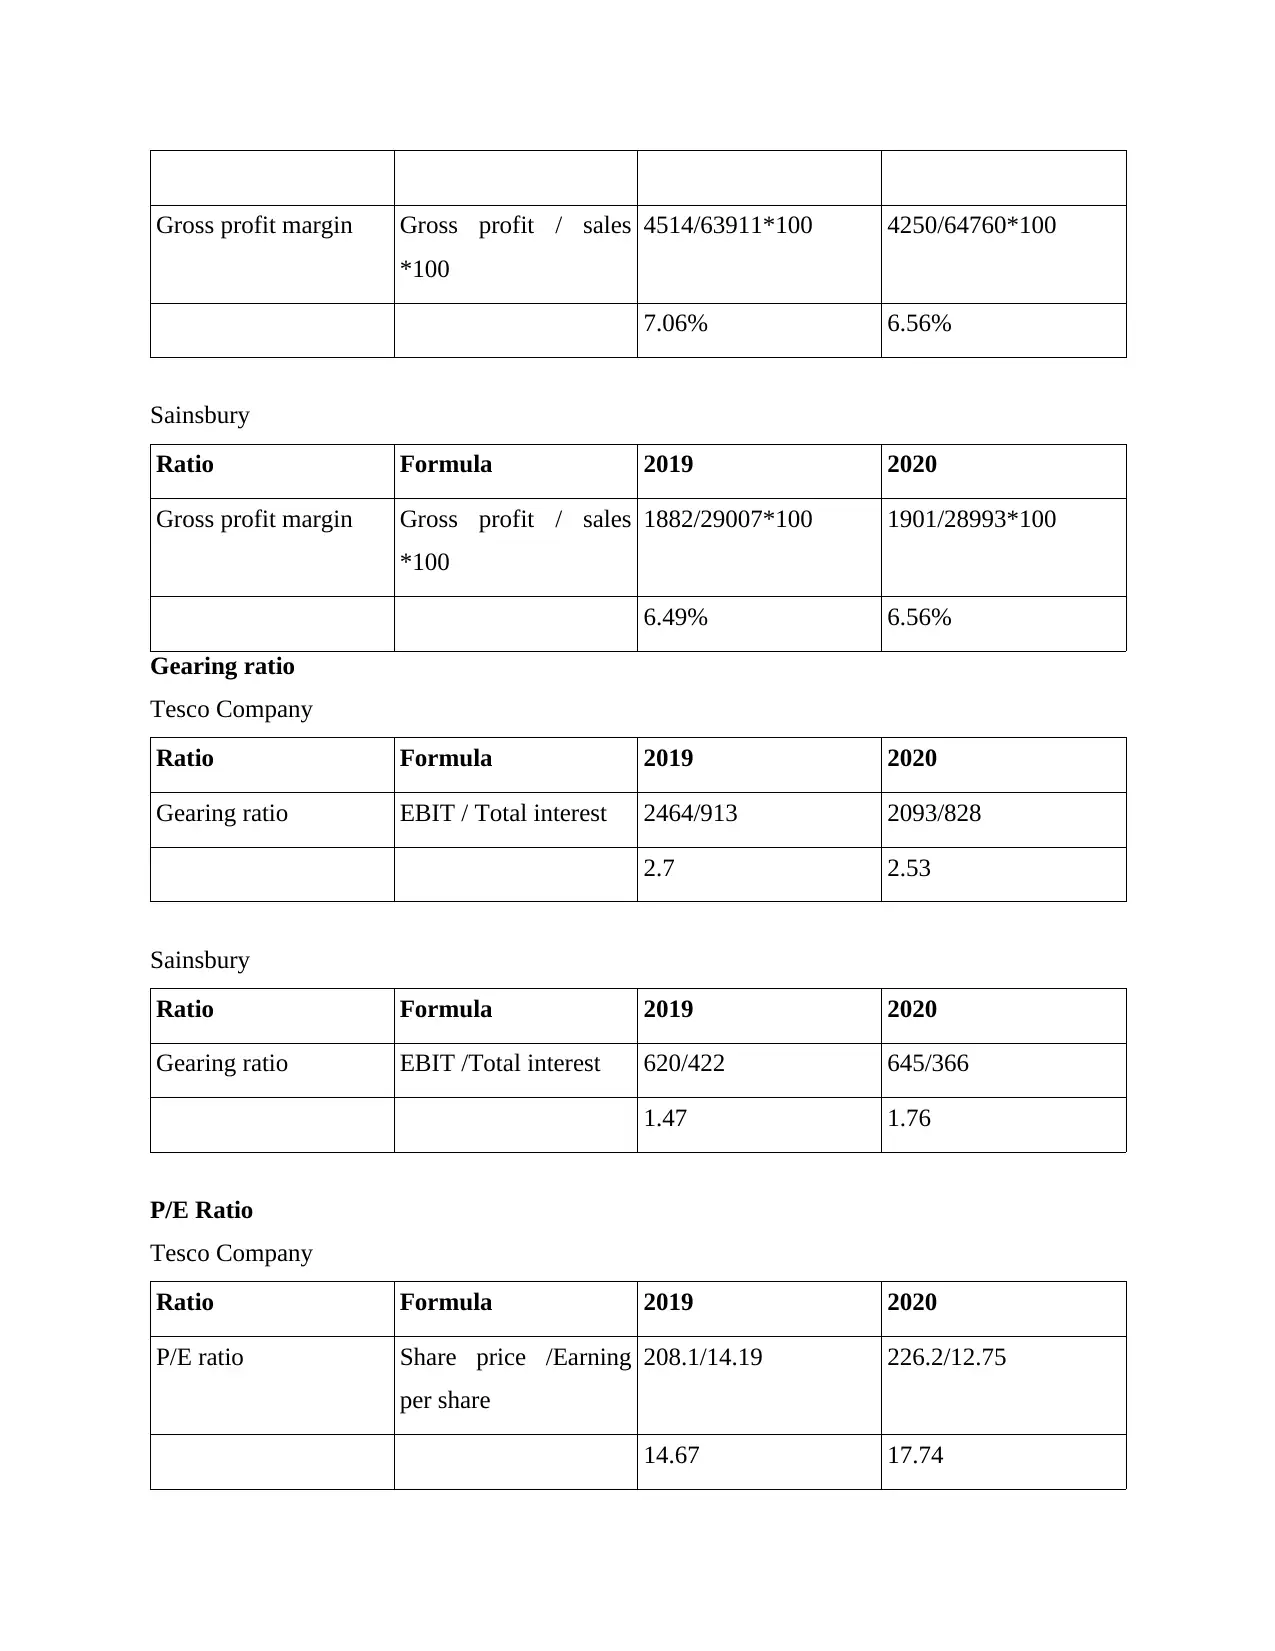
Gross profit margin Gross profit / sales
*100
4514/63911*100 4250/64760*100
7.06% 6.56%
Sainsbury
Ratio Formula 2019 2020
Gross profit margin Gross profit / sales
*100
1882/29007*100 1901/28993*100
6.49% 6.56%
Gearing ratio
Tesco Company
Ratio Formula 2019 2020
Gearing ratio EBIT / Total interest 2464/913 2093/828
2.7 2.53
Sainsbury
Ratio Formula 2019 2020
Gearing ratio EBIT /Total interest 620/422 645/366
1.47 1.76
P/E Ratio
Tesco Company
Ratio Formula 2019 2020
P/E ratio Share price /Earning
per share
208.1/14.19 226.2/12.75
14.67 17.74
*100
4514/63911*100 4250/64760*100
7.06% 6.56%
Sainsbury
Ratio Formula 2019 2020
Gross profit margin Gross profit / sales
*100
1882/29007*100 1901/28993*100
6.49% 6.56%
Gearing ratio
Tesco Company
Ratio Formula 2019 2020
Gearing ratio EBIT / Total interest 2464/913 2093/828
2.7 2.53
Sainsbury
Ratio Formula 2019 2020
Gearing ratio EBIT /Total interest 620/422 645/366
1.47 1.76
P/E Ratio
Tesco Company
Ratio Formula 2019 2020
P/E ratio Share price /Earning
per share
208.1/14.19 226.2/12.75
14.67 17.74
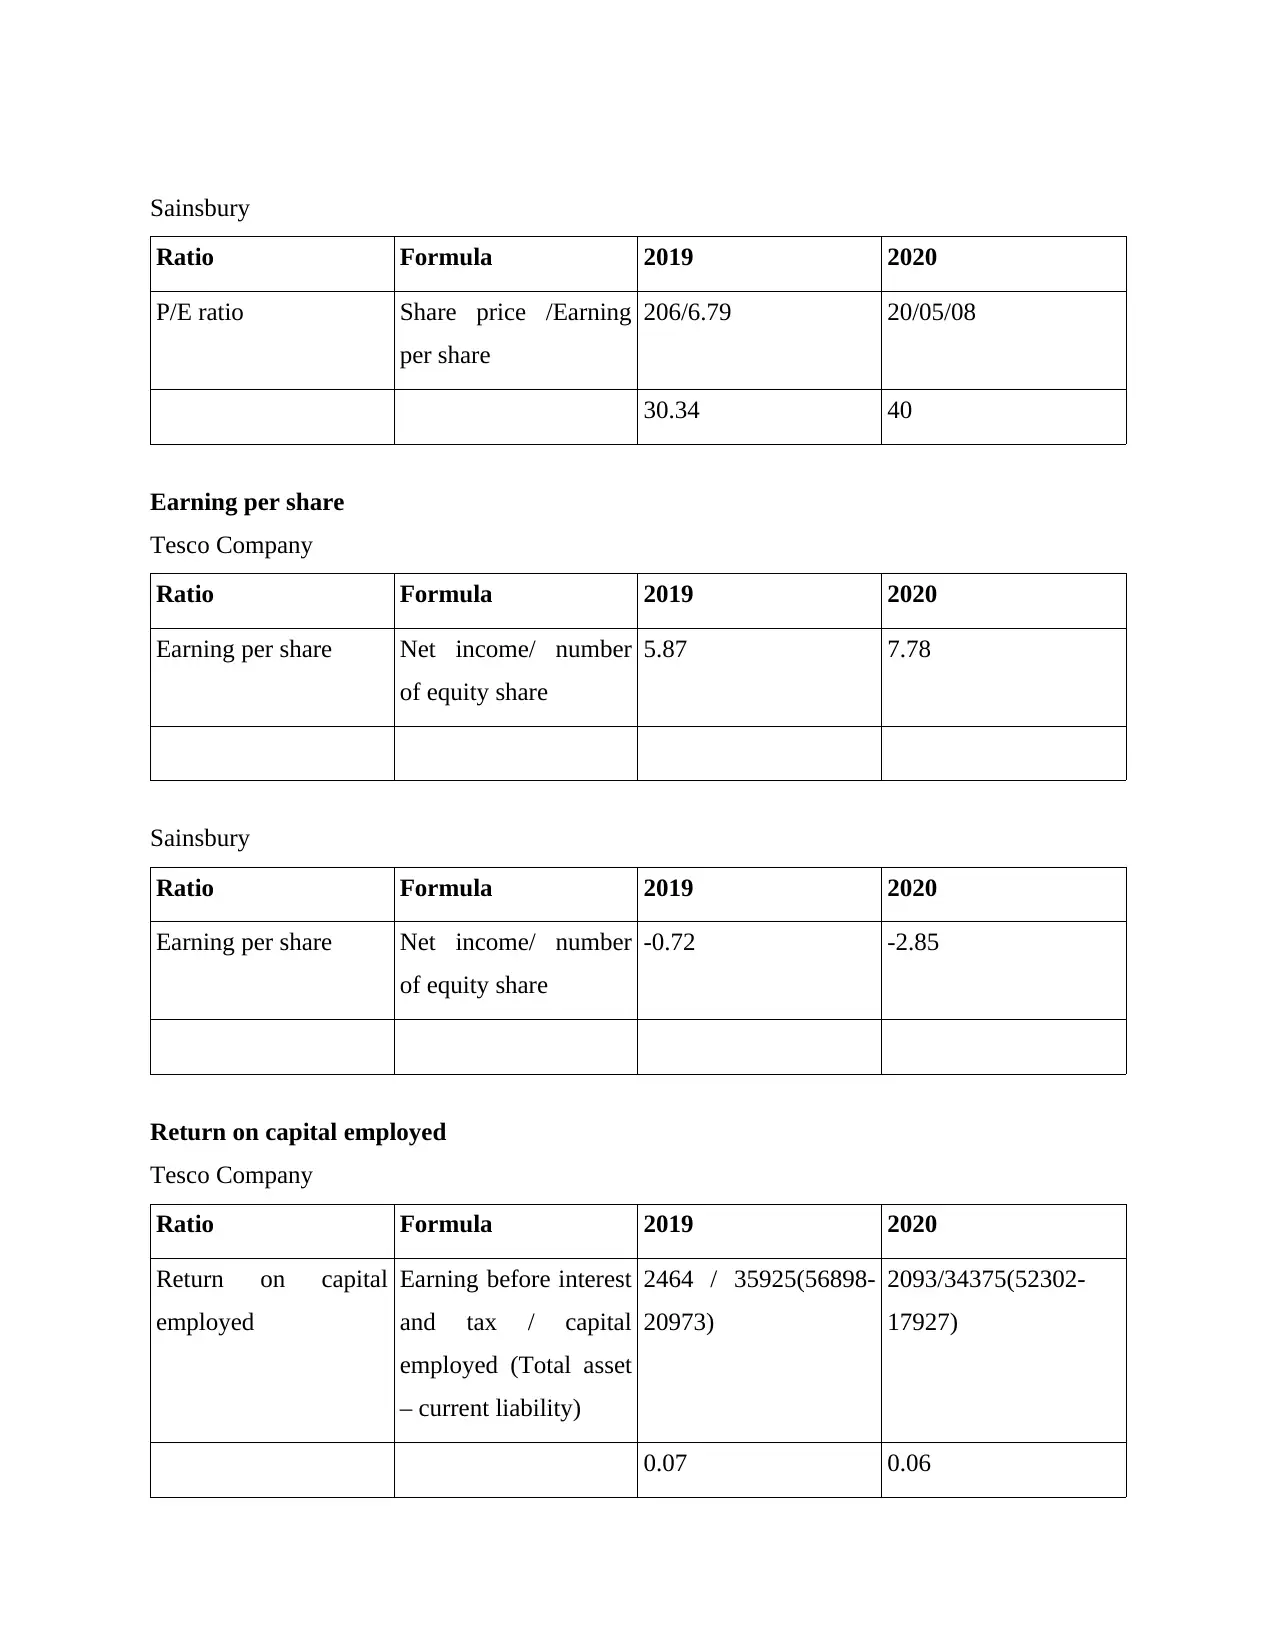
Sainsbury
Ratio Formula 2019 2020
P/E ratio Share price /Earning
per share
206/6.79 20/05/08
30.34 40
Earning per share
Tesco Company
Ratio Formula 2019 2020
Earning per share Net income/ number
of equity share
5.87 7.78
Sainsbury
Ratio Formula 2019 2020
Earning per share Net income/ number
of equity share
-0.72 -2.85
Return on capital employed
Tesco Company
Ratio Formula 2019 2020
Return on capital
employed
Earning before interest
and tax / capital
employed (Total asset
– current liability)
2464 / 35925(56898-
20973)
2093/34375(52302-
17927)
0.07 0.06
Ratio Formula 2019 2020
P/E ratio Share price /Earning
per share
206/6.79 20/05/08
30.34 40
Earning per share
Tesco Company
Ratio Formula 2019 2020
Earning per share Net income/ number
of equity share
5.87 7.78
Sainsbury
Ratio Formula 2019 2020
Earning per share Net income/ number
of equity share
-0.72 -2.85
Return on capital employed
Tesco Company
Ratio Formula 2019 2020
Return on capital
employed
Earning before interest
and tax / capital
employed (Total asset
– current liability)
2464 / 35925(56898-
20973)
2093/34375(52302-
17927)
0.07 0.06
⊘ This is a preview!⊘
Do you want full access?
Subscribe today to unlock all pages.
Trusted by 1+ million students worldwide
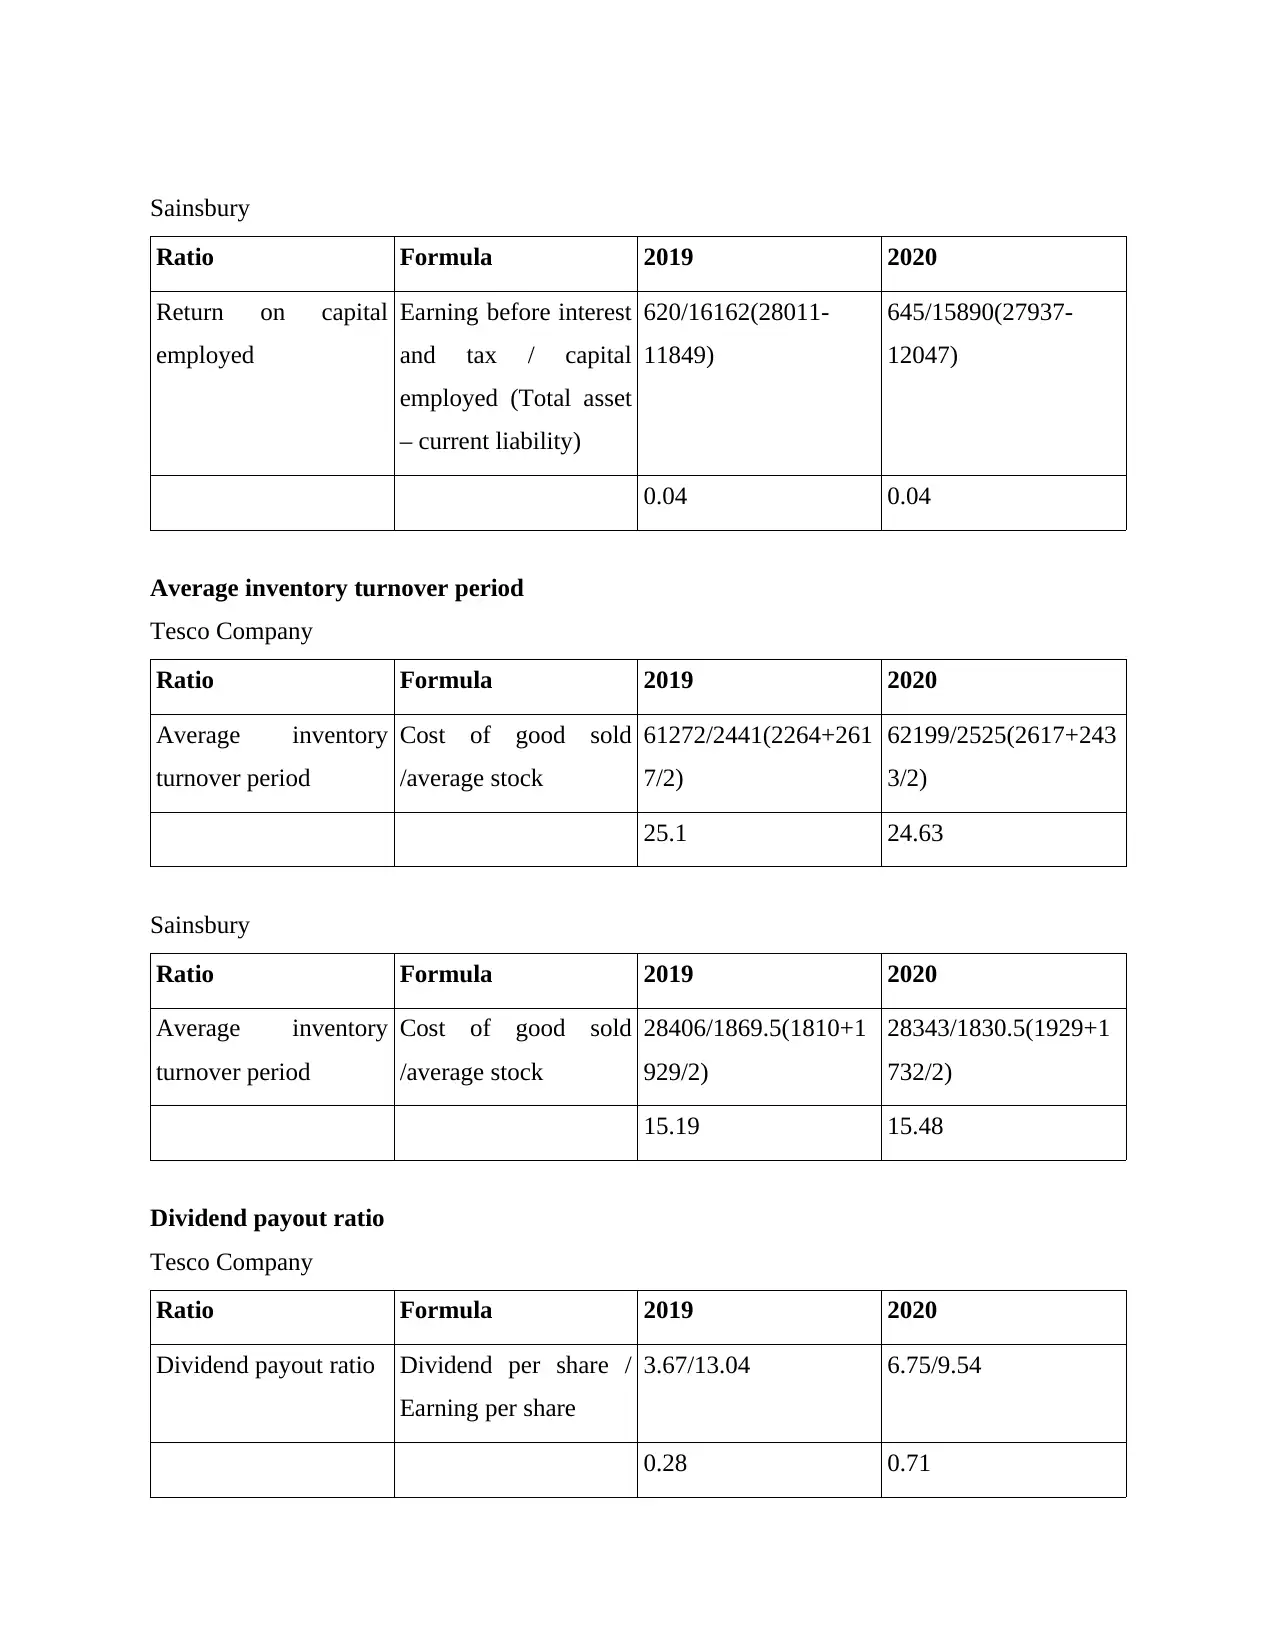
Sainsbury
Ratio Formula 2019 2020
Return on capital
employed
Earning before interest
and tax / capital
employed (Total asset
– current liability)
620/16162(28011-
11849)
645/15890(27937-
12047)
0.04 0.04
Average inventory turnover period
Tesco Company
Ratio Formula 2019 2020
Average inventory
turnover period
Cost of good sold
/average stock
61272/2441(2264+261
7/2)
62199/2525(2617+243
3/2)
25.1 24.63
Sainsbury
Ratio Formula 2019 2020
Average inventory
turnover period
Cost of good sold
/average stock
28406/1869.5(1810+1
929/2)
28343/1830.5(1929+1
732/2)
15.19 15.48
Dividend payout ratio
Tesco Company
Ratio Formula 2019 2020
Dividend payout ratio Dividend per share /
Earning per share
3.67/13.04 6.75/9.54
0.28 0.71
Ratio Formula 2019 2020
Return on capital
employed
Earning before interest
and tax / capital
employed (Total asset
– current liability)
620/16162(28011-
11849)
645/15890(27937-
12047)
0.04 0.04
Average inventory turnover period
Tesco Company
Ratio Formula 2019 2020
Average inventory
turnover period
Cost of good sold
/average stock
61272/2441(2264+261
7/2)
62199/2525(2617+243
3/2)
25.1 24.63
Sainsbury
Ratio Formula 2019 2020
Average inventory
turnover period
Cost of good sold
/average stock
28406/1869.5(1810+1
929/2)
28343/1830.5(1929+1
732/2)
15.19 15.48
Dividend payout ratio
Tesco Company
Ratio Formula 2019 2020
Dividend payout ratio Dividend per share /
Earning per share
3.67/13.04 6.75/9.54
0.28 0.71
Paraphrase This Document
Need a fresh take? Get an instant paraphrase of this document with our AI Paraphraser
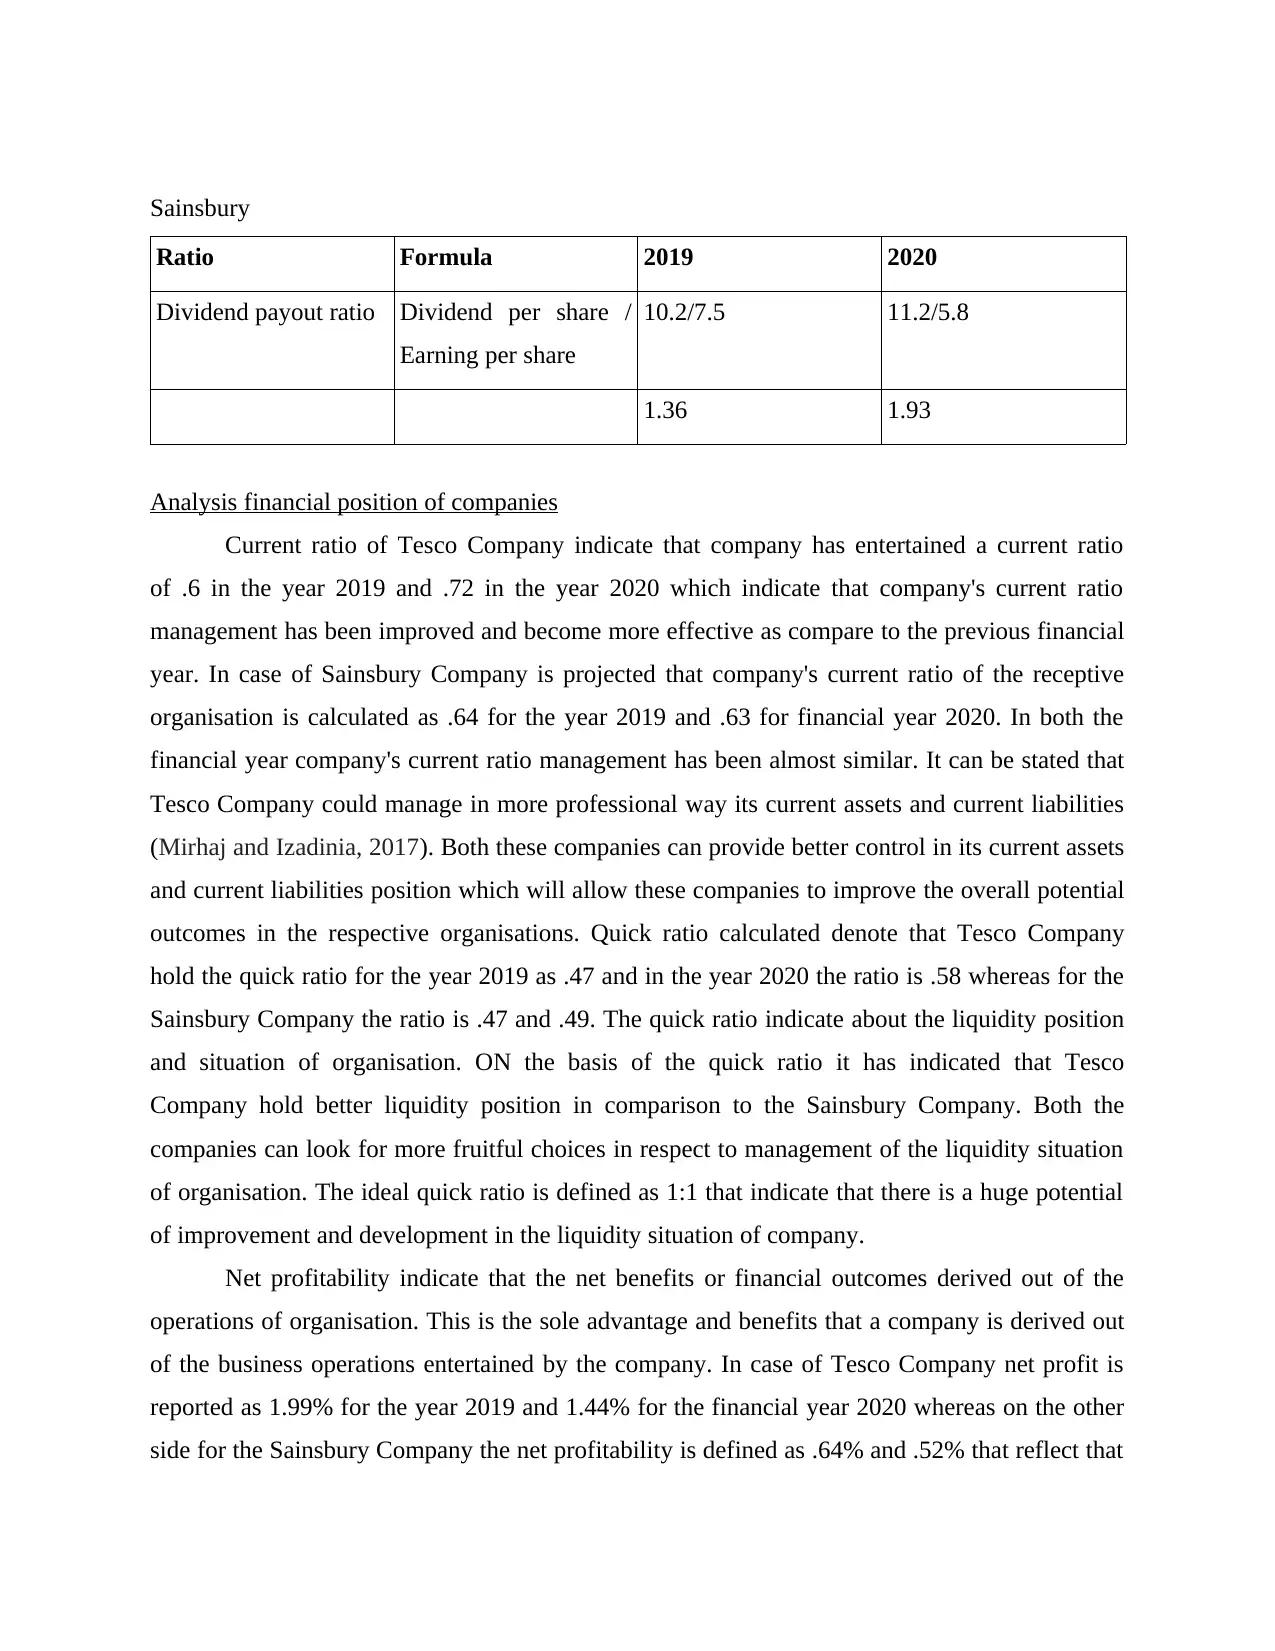
Sainsbury
Ratio Formula 2019 2020
Dividend payout ratio Dividend per share /
Earning per share
10.2/7.5 11.2/5.8
1.36 1.93
Analysis financial position of companies
Current ratio of Tesco Company indicate that company has entertained a current ratio
of .6 in the year 2019 and .72 in the year 2020 which indicate that company's current ratio
management has been improved and become more effective as compare to the previous financial
year. In case of Sainsbury Company is projected that company's current ratio of the receptive
organisation is calculated as .64 for the year 2019 and .63 for financial year 2020. In both the
financial year company's current ratio management has been almost similar. It can be stated that
Tesco Company could manage in more professional way its current assets and current liabilities
(Mirhaj and Izadinia, 2017). Both these companies can provide better control in its current assets
and current liabilities position which will allow these companies to improve the overall potential
outcomes in the respective organisations. Quick ratio calculated denote that Tesco Company
hold the quick ratio for the year 2019 as .47 and in the year 2020 the ratio is .58 whereas for the
Sainsbury Company the ratio is .47 and .49. The quick ratio indicate about the liquidity position
and situation of organisation. ON the basis of the quick ratio it has indicated that Tesco
Company hold better liquidity position in comparison to the Sainsbury Company. Both the
companies can look for more fruitful choices in respect to management of the liquidity situation
of organisation. The ideal quick ratio is defined as 1:1 that indicate that there is a huge potential
of improvement and development in the liquidity situation of company.
Net profitability indicate that the net benefits or financial outcomes derived out of the
operations of organisation. This is the sole advantage and benefits that a company is derived out
of the business operations entertained by the company. In case of Tesco Company net profit is
reported as 1.99% for the year 2019 and 1.44% for the financial year 2020 whereas on the other
side for the Sainsbury Company the net profitability is defined as .64% and .52% that reflect that
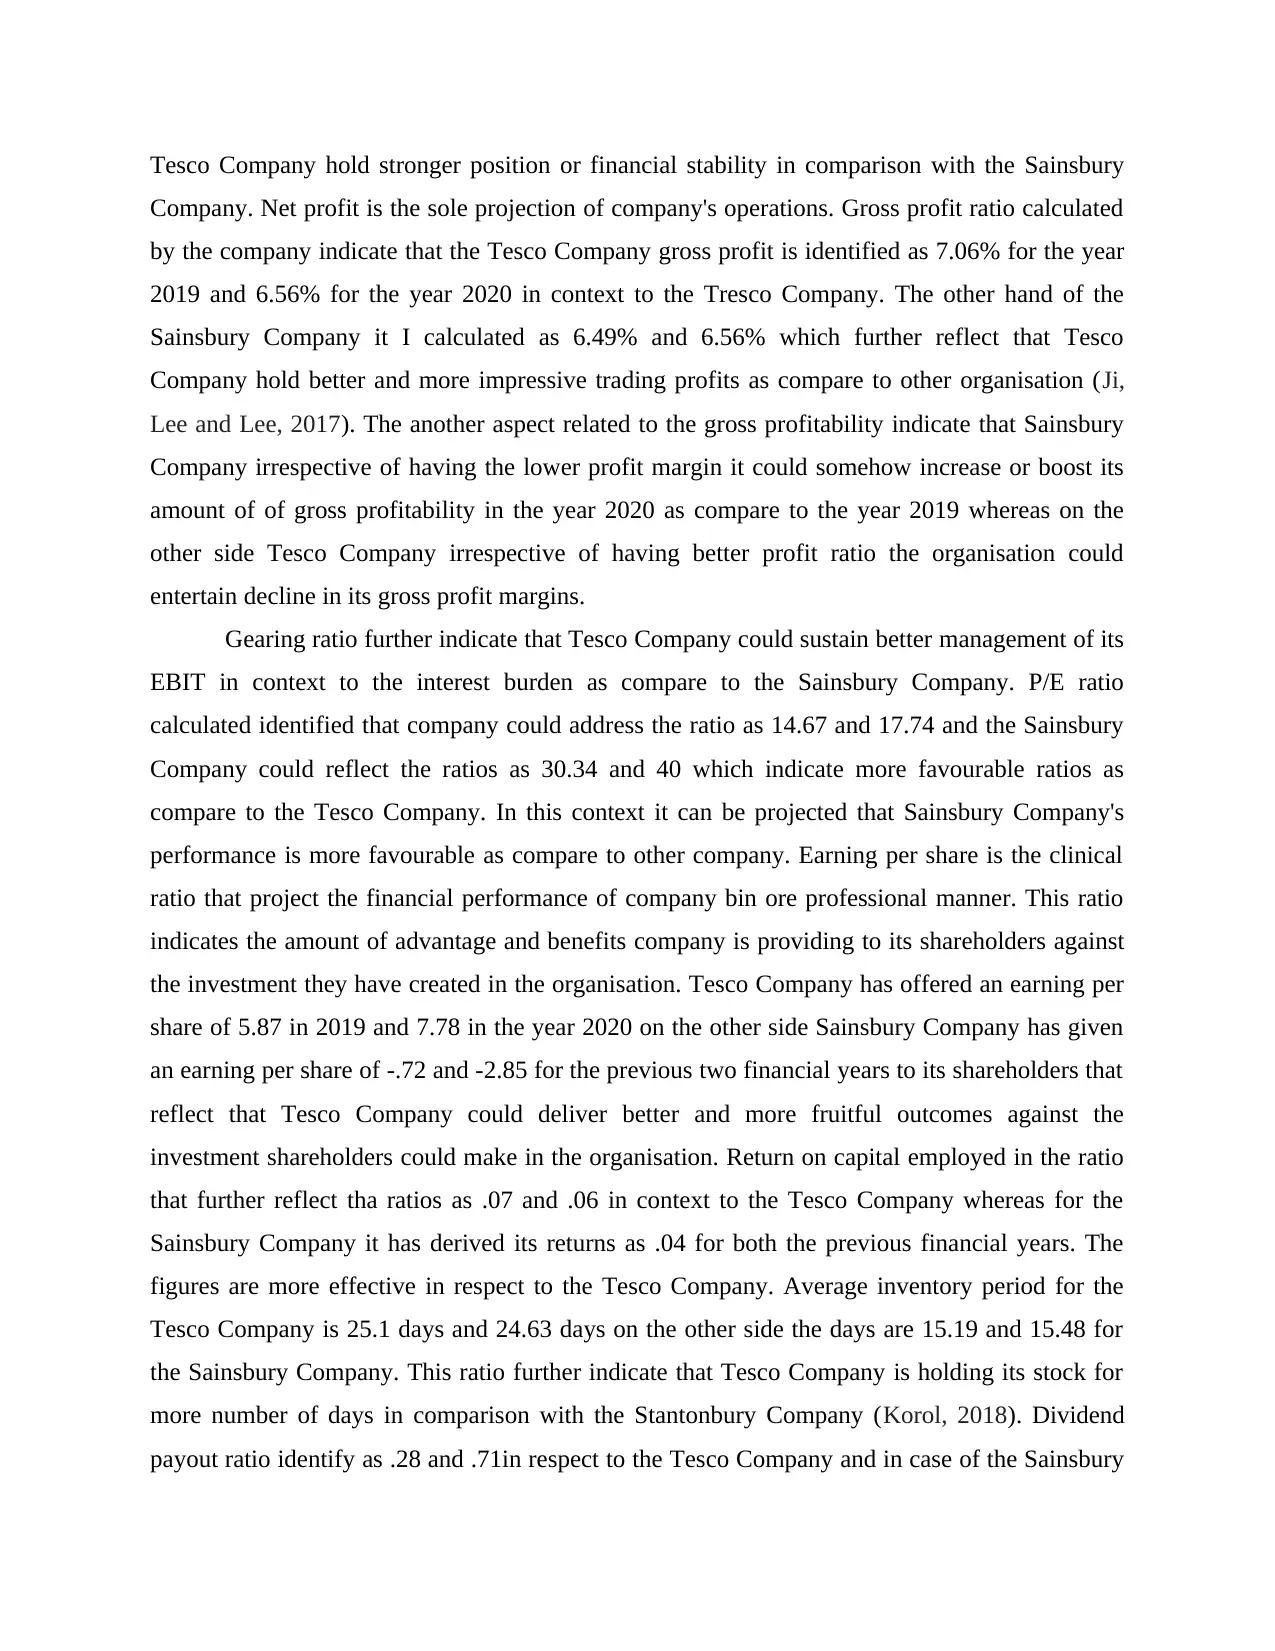
Tesco Company hold stronger position or financial stability in comparison with the Sainsbury
Company. Net profit is the sole projection of company's operations. Gross profit ratio calculated
by the company indicate that the Tesco Company gross profit is identified as 7.06% for the year
2019 and 6.56% for the year 2020 in context to the Tresco Company. The other hand of the
Sainsbury Company it I calculated as 6.49% and 6.56% which further reflect that Tesco
Company hold better and more impressive trading profits as compare to other organisation (Ji,
Lee and Lee, 2017). The another aspect related to the gross profitability indicate that Sainsbury
Company irrespective of having the lower profit margin it could somehow increase or boost its
amount of of gross profitability in the year 2020 as compare to the year 2019 whereas on the
other side Tesco Company irrespective of having better profit ratio the organisation could
entertain decline in its gross profit margins.
Gearing ratio further indicate that Tesco Company could sustain better management of its
EBIT in context to the interest burden as compare to the Sainsbury Company. P/E ratio
calculated identified that company could address the ratio as 14.67 and 17.74 and the Sainsbury
Company could reflect the ratios as 30.34 and 40 which indicate more favourable ratios as
compare to the Tesco Company. In this context it can be projected that Sainsbury Company's
performance is more favourable as compare to other company. Earning per share is the clinical
ratio that project the financial performance of company bin ore professional manner. This ratio
indicates the amount of advantage and benefits company is providing to its shareholders against
the investment they have created in the organisation. Tesco Company has offered an earning per
share of 5.87 in 2019 and 7.78 in the year 2020 on the other side Sainsbury Company has given
an earning per share of -.72 and -2.85 for the previous two financial years to its shareholders that
reflect that Tesco Company could deliver better and more fruitful outcomes against the
investment shareholders could make in the organisation. Return on capital employed in the ratio
that further reflect tha ratios as .07 and .06 in context to the Tesco Company whereas for the
Sainsbury Company it has derived its returns as .04 for both the previous financial years. The
figures are more effective in respect to the Tesco Company. Average inventory period for the
Tesco Company is 25.1 days and 24.63 days on the other side the days are 15.19 and 15.48 for
the Sainsbury Company. This ratio further indicate that Tesco Company is holding its stock for
more number of days in comparison with the Stantonbury Company (Korol, 2018). Dividend
payout ratio identify as .28 and .71in respect to the Tesco Company and in case of the Sainsbury
⊘ This is a preview!⊘
Do you want full access?
Subscribe today to unlock all pages.
Trusted by 1+ million students worldwide
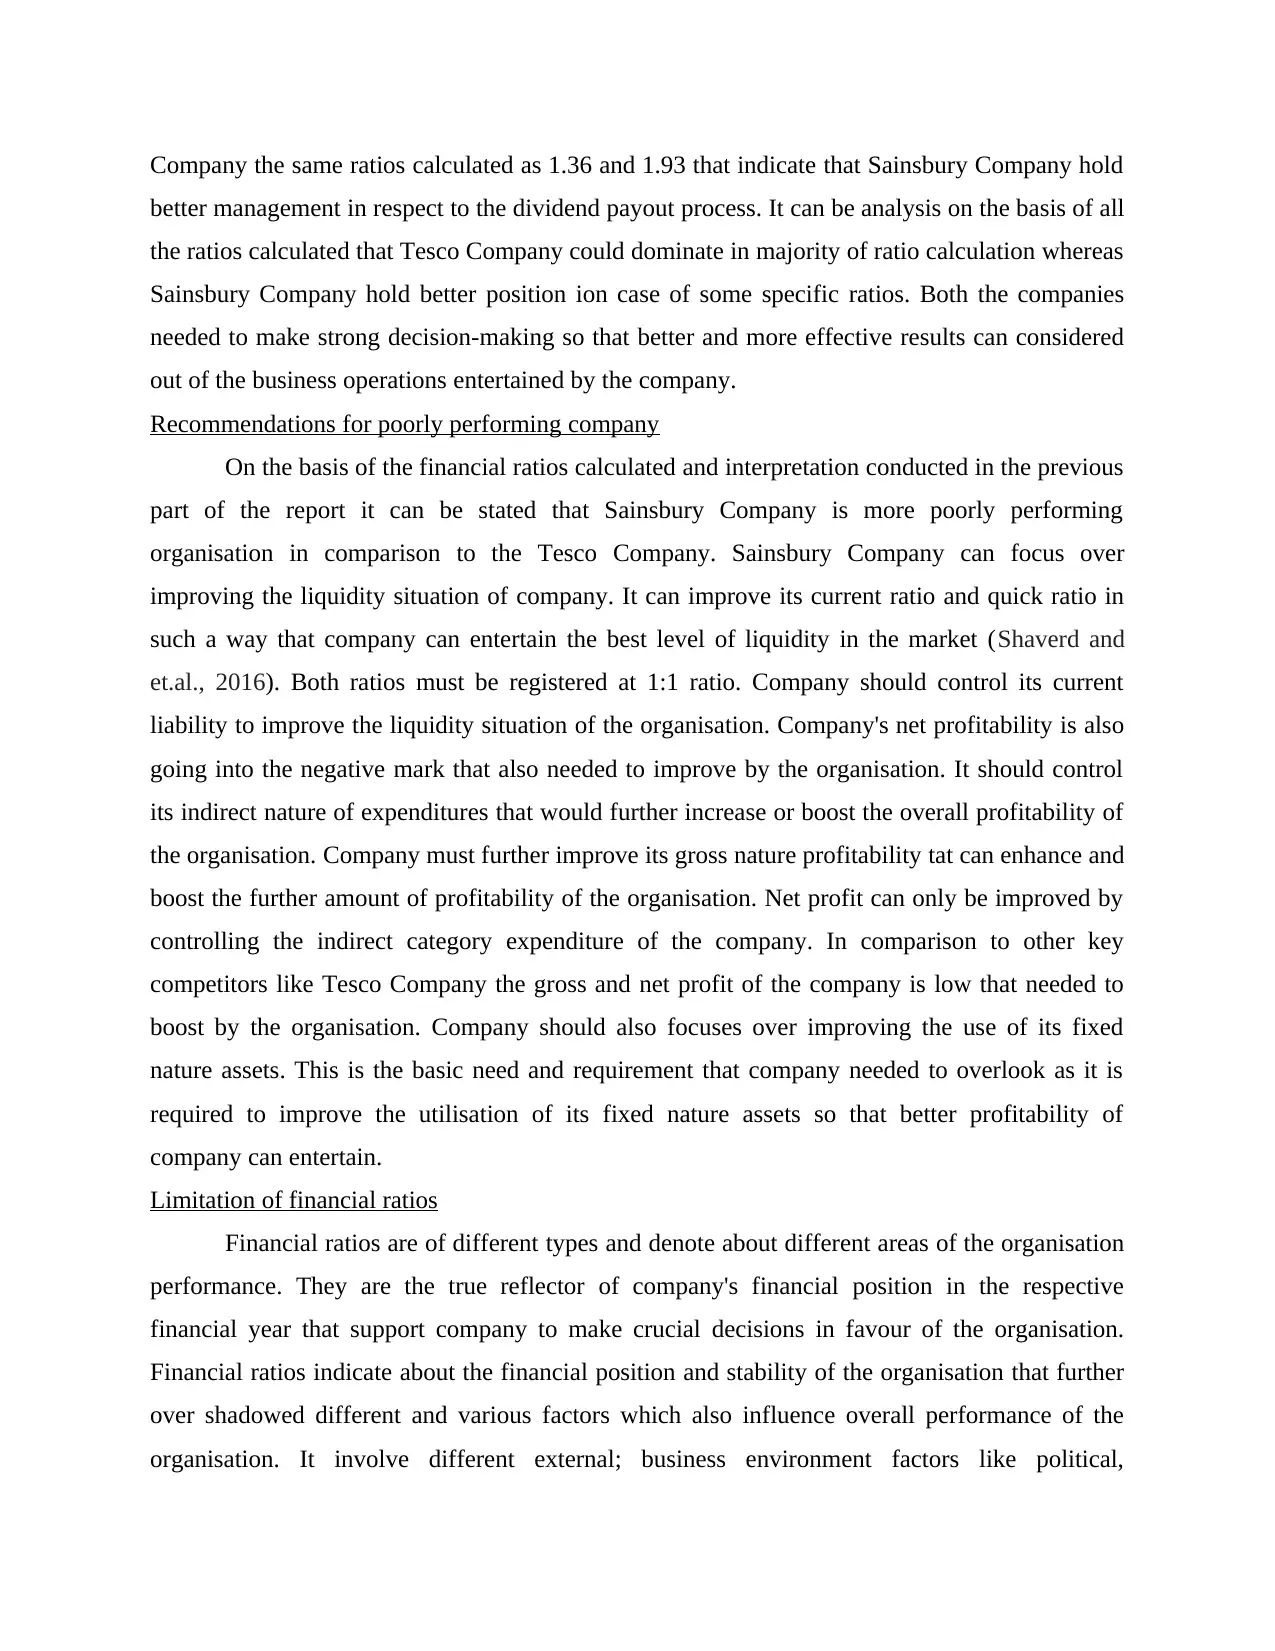
Company the same ratios calculated as 1.36 and 1.93 that indicate that Sainsbury Company hold
better management in respect to the dividend payout process. It can be analysis on the basis of all
the ratios calculated that Tesco Company could dominate in majority of ratio calculation whereas
Sainsbury Company hold better position ion case of some specific ratios. Both the companies
needed to make strong decision-making so that better and more effective results can considered
out of the business operations entertained by the company.
Recommendations for poorly performing company
On the basis of the financial ratios calculated and interpretation conducted in the previous
part of the report it can be stated that Sainsbury Company is more poorly performing
organisation in comparison to the Tesco Company. Sainsbury Company can focus over
improving the liquidity situation of company. It can improve its current ratio and quick ratio in
such a way that company can entertain the best level of liquidity in the market (Shaverd and
et.al., 2016). Both ratios must be registered at 1:1 ratio. Company should control its current
liability to improve the liquidity situation of the organisation. Company's net profitability is also
going into the negative mark that also needed to improve by the organisation. It should control
its indirect nature of expenditures that would further increase or boost the overall profitability of
the organisation. Company must further improve its gross nature profitability tat can enhance and
boost the further amount of profitability of the organisation. Net profit can only be improved by
controlling the indirect category expenditure of the company. In comparison to other key
competitors like Tesco Company the gross and net profit of the company is low that needed to
boost by the organisation. Company should also focuses over improving the use of its fixed
nature assets. This is the basic need and requirement that company needed to overlook as it is
required to improve the utilisation of its fixed nature assets so that better profitability of
company can entertain.
Limitation of financial ratios
Financial ratios are of different types and denote about different areas of the organisation
performance. They are the true reflector of company's financial position in the respective
financial year that support company to make crucial decisions in favour of the organisation.
Financial ratios indicate about the financial position and stability of the organisation that further
over shadowed different and various factors which also influence overall performance of the
organisation. It involve different external; business environment factors like political,
Paraphrase This Document
Need a fresh take? Get an instant paraphrase of this document with our AI Paraphraser
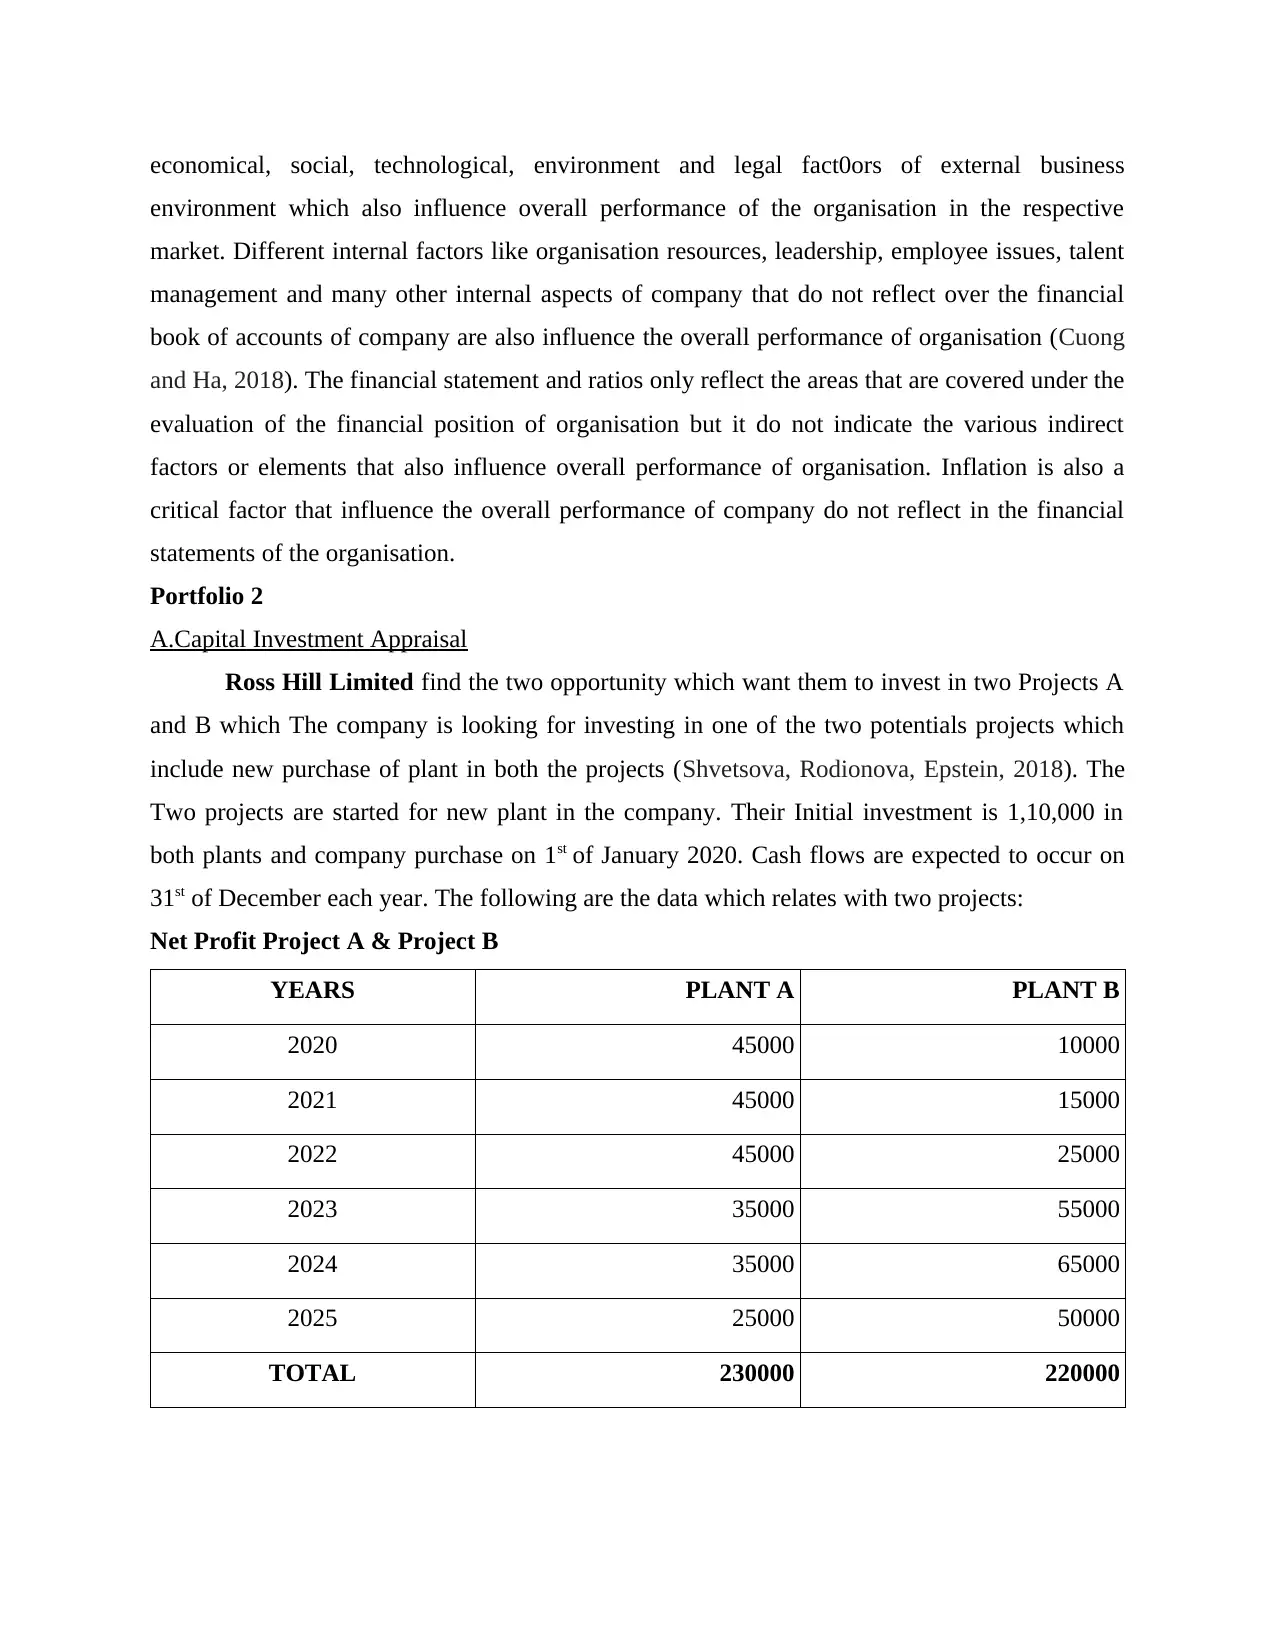
economical, social, technological, environment and legal fact0ors of external business
environment which also influence overall performance of the organisation in the respective
market. Different internal factors like organisation resources, leadership, employee issues, talent
management and many other internal aspects of company that do not reflect over the financial
book of accounts of company are also influence the overall performance of organisation (Cuong
and Ha, 2018). The financial statement and ratios only reflect the areas that are covered under the
evaluation of the financial position of organisation but it do not indicate the various indirect
factors or elements that also influence overall performance of organisation. Inflation is also a
critical factor that influence the overall performance of company do not reflect in the financial
statements of the organisation.
Portfolio 2
A.Capital Investment Appraisal
Ross Hill Limited find the two opportunity which want them to invest in two Projects A
and B which The company is looking for investing in one of the two potentials projects which
include new purchase of plant in both the projects (Shvetsova, Rodionova, Epstein, 2018). The
Two projects are started for new plant in the company. Their Initial investment is 1,10,000 in
both plants and company purchase on 1st of January 2020. Cash flows are expected to occur on
31st of December each year. The following are the data which relates with two projects:
Net Profit Project A & Project B
YEARS PLANT A PLANT B
2020 45000 10000
2021 45000 15000
2022 45000 25000
2023 35000 55000
2024 35000 65000
2025 25000 50000
TOTAL 230000 220000
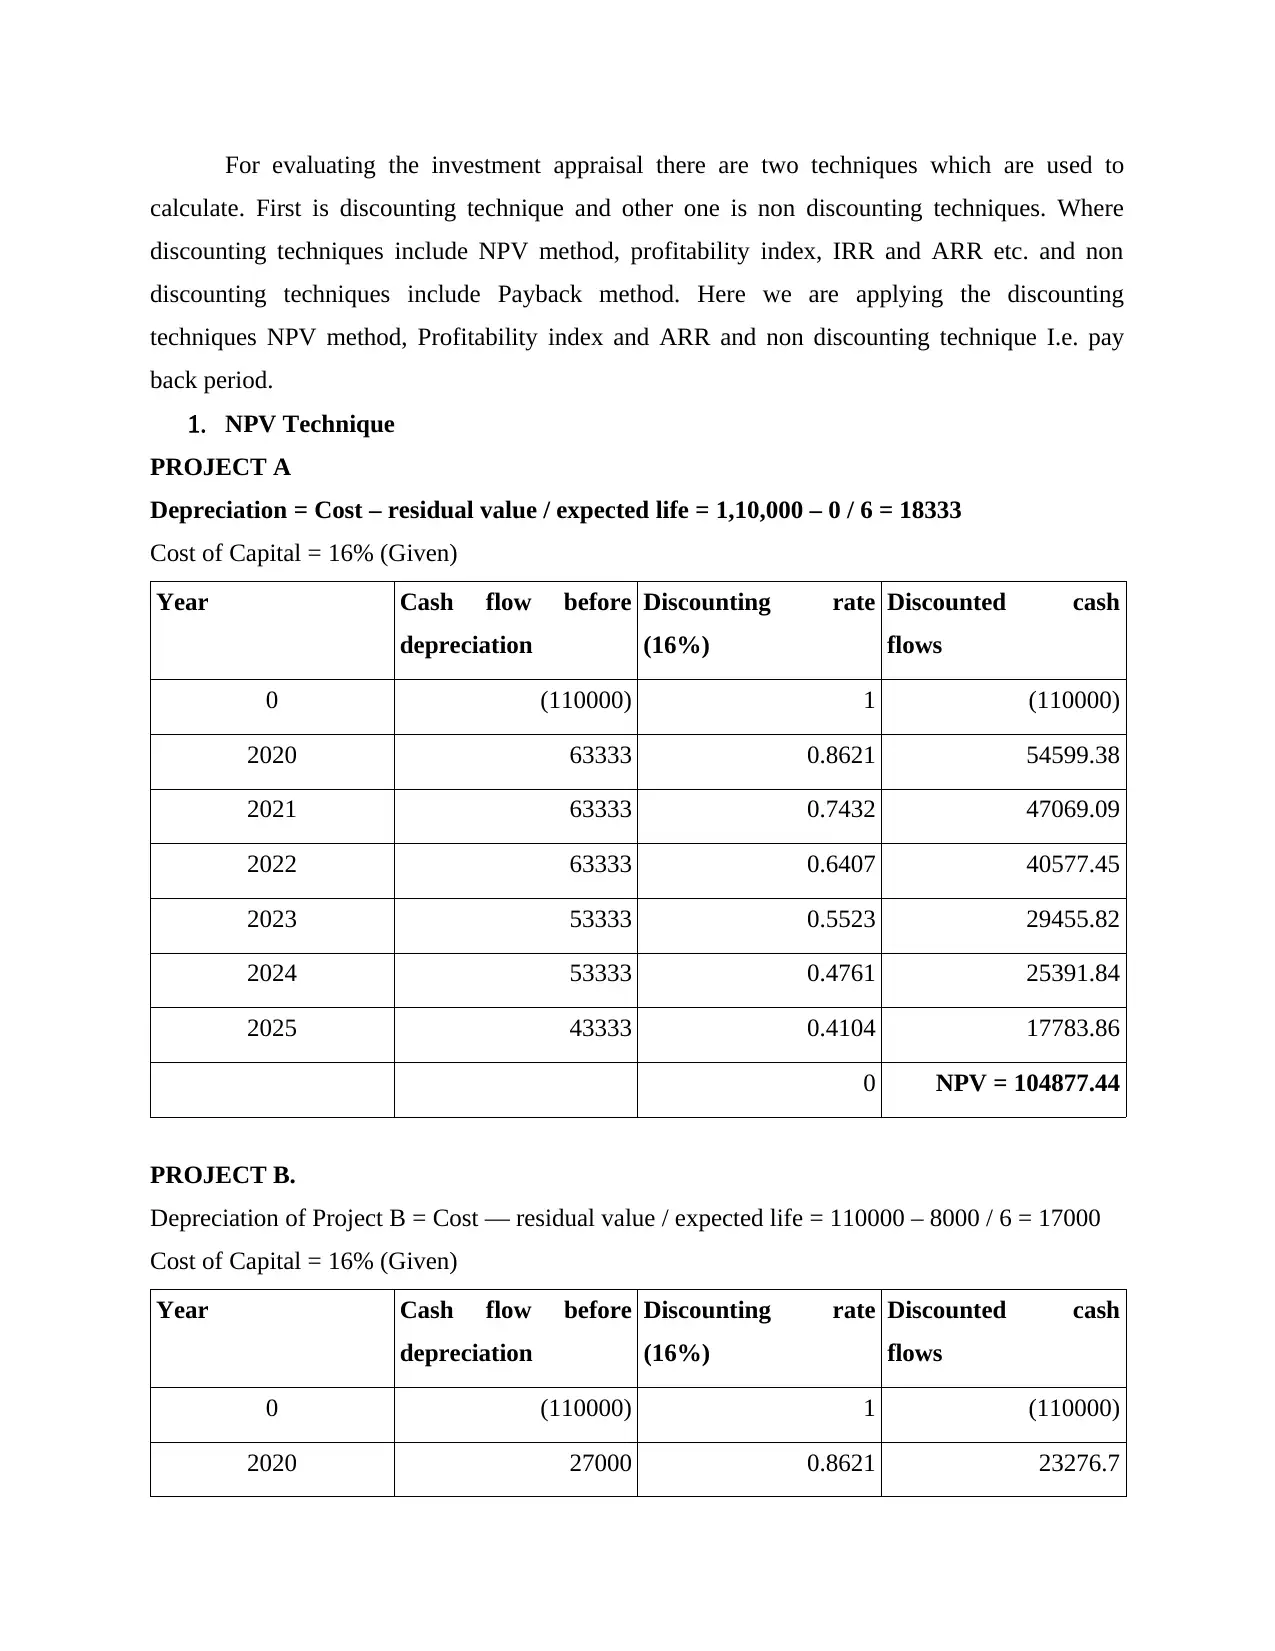
For evaluating the investment appraisal there are two techniques which are used to
calculate. First is discounting technique and other one is non discounting techniques. Where
discounting techniques include NPV method, profitability index, IRR and ARR etc. and non
discounting techniques include Payback method. Here we are applying the discounting
techniques NPV method, Profitability index and ARR and non discounting technique I.e. pay
back period.
1. NPV Technique
PROJECT A
Depreciation = Cost – residual value / expected life = 1,10,000 – 0 / 6 = 18333
Cost of Capital = 16% (Given)
Year Cash flow before
depreciation
Discounting rate
(16%)
Discounted cash
flows
0 (110000) 1 (110000)
2020 63333 0.8621 54599.38
2021 63333 0.7432 47069.09
2022 63333 0.6407 40577.45
2023 53333 0.5523 29455.82
2024 53333 0.4761 25391.84
2025 43333 0.4104 17783.86
0 NPV = 104877.44
PROJECT B.
Depreciation of Project B = Cost — residual value / expected life = 110000 – 8000 / 6 = 17000
Cost of Capital = 16% (Given)
Year Cash flow before
depreciation
Discounting rate
(16%)
Discounted cash
flows
0 (110000) 1 (110000)
2020 27000 0.8621 23276.7
⊘ This is a preview!⊘
Do you want full access?
Subscribe today to unlock all pages.
Trusted by 1+ million students worldwide
1 out of 18
Related Documents


Your All-in-One AI-Powered Toolkit for Academic Success.
+13062052269
info@desklib.com
Available 24*7 on WhatsApp / Email
![[object Object]](/_next/static/media/star-bottom.7253800d.svg)
Unlock your academic potential
Copyright © 2020–2026 A2Z Services. All Rights Reserved. Developed and managed by ZUCOL.