Capital Budgeting and Project Analysis: EFN406 Assignment - Semester 2

Verified

Added on  2022/11/14

|10
|1497
|202
Homework Assignment
AI Summary
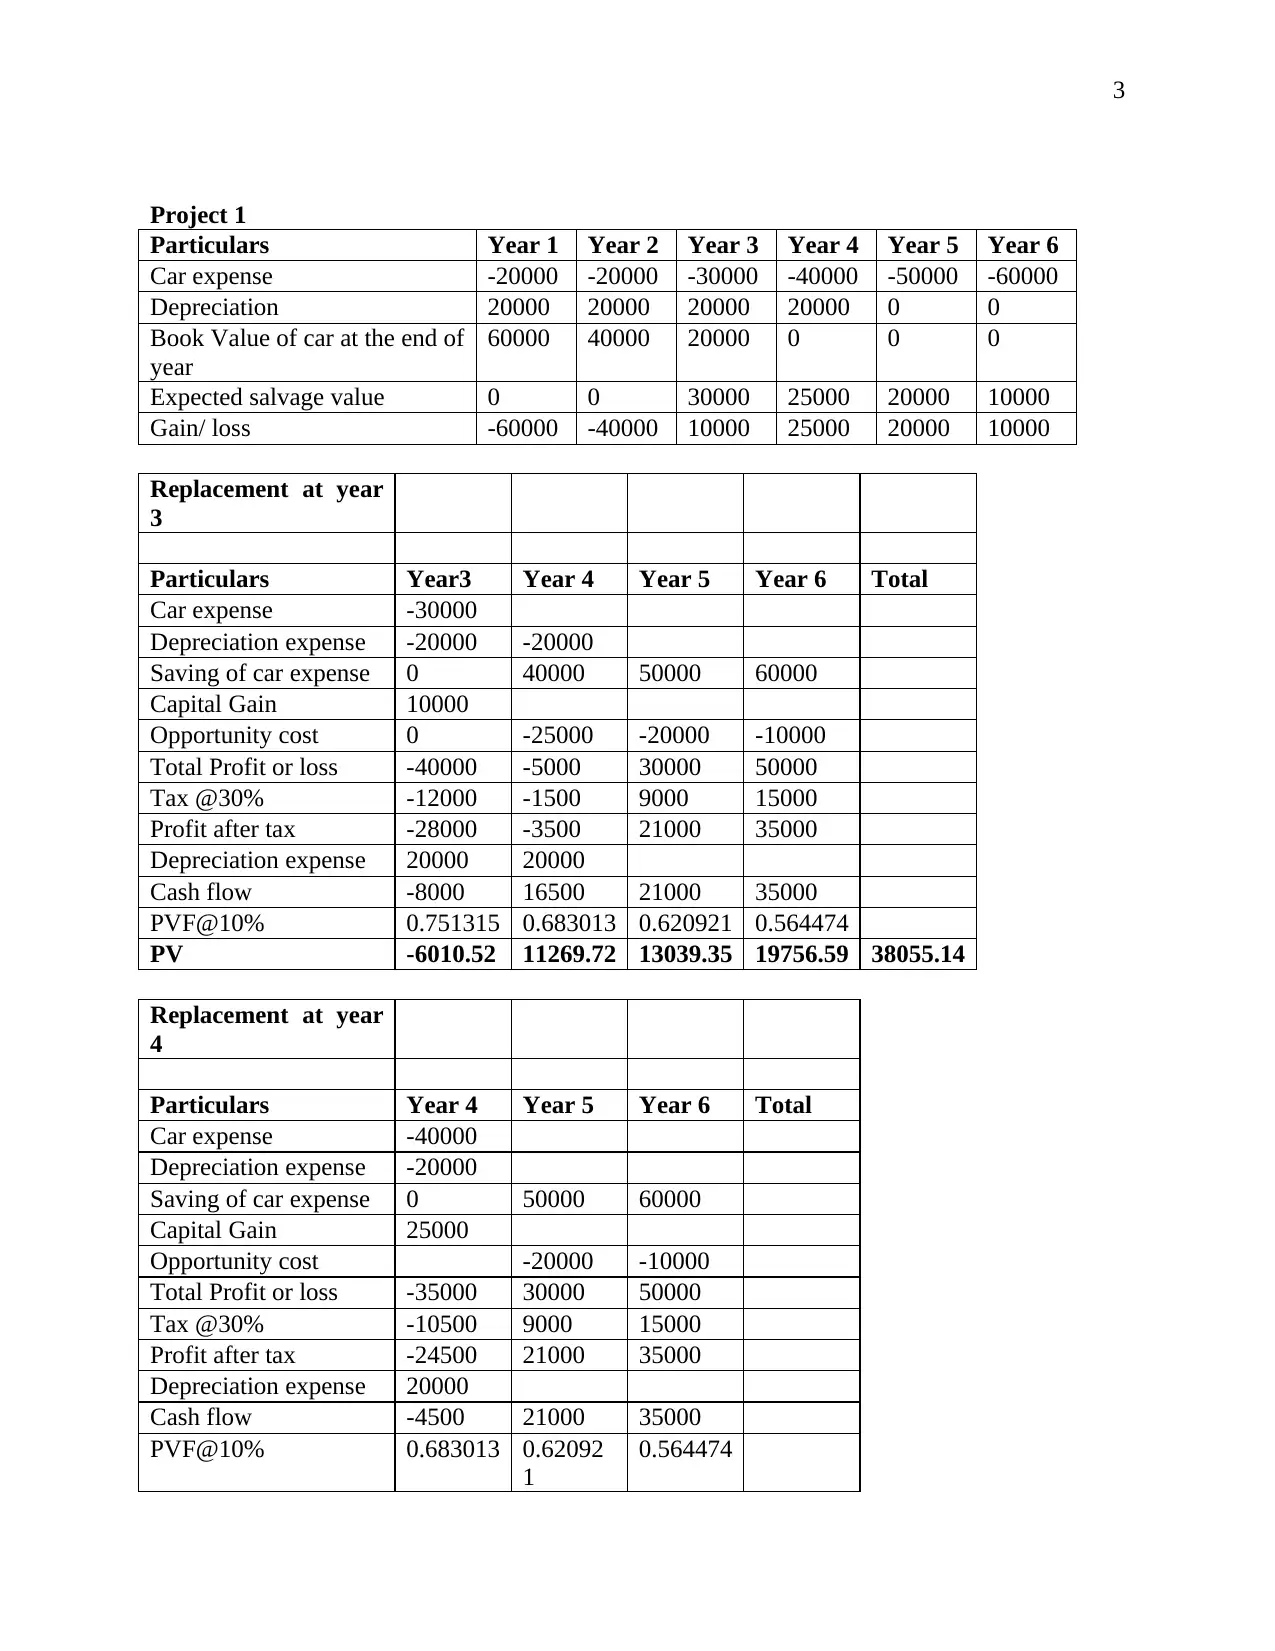
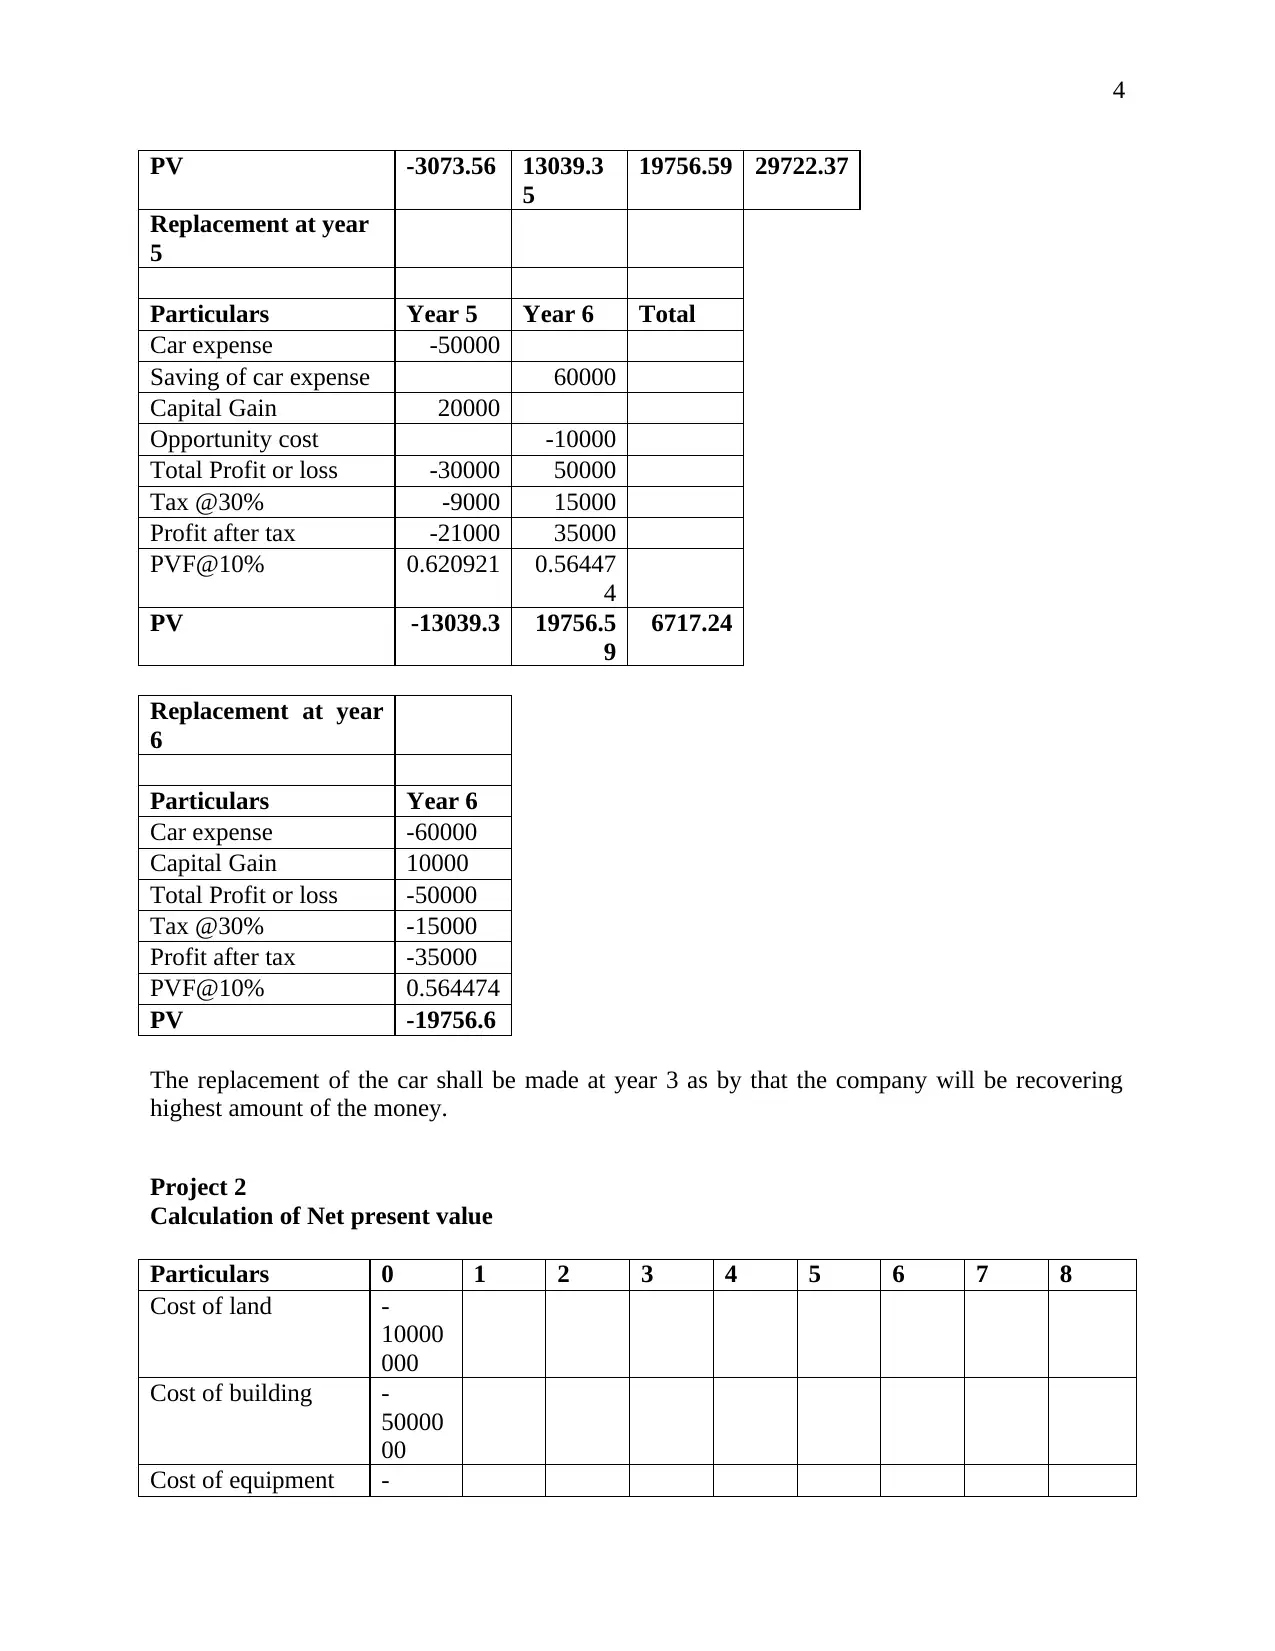
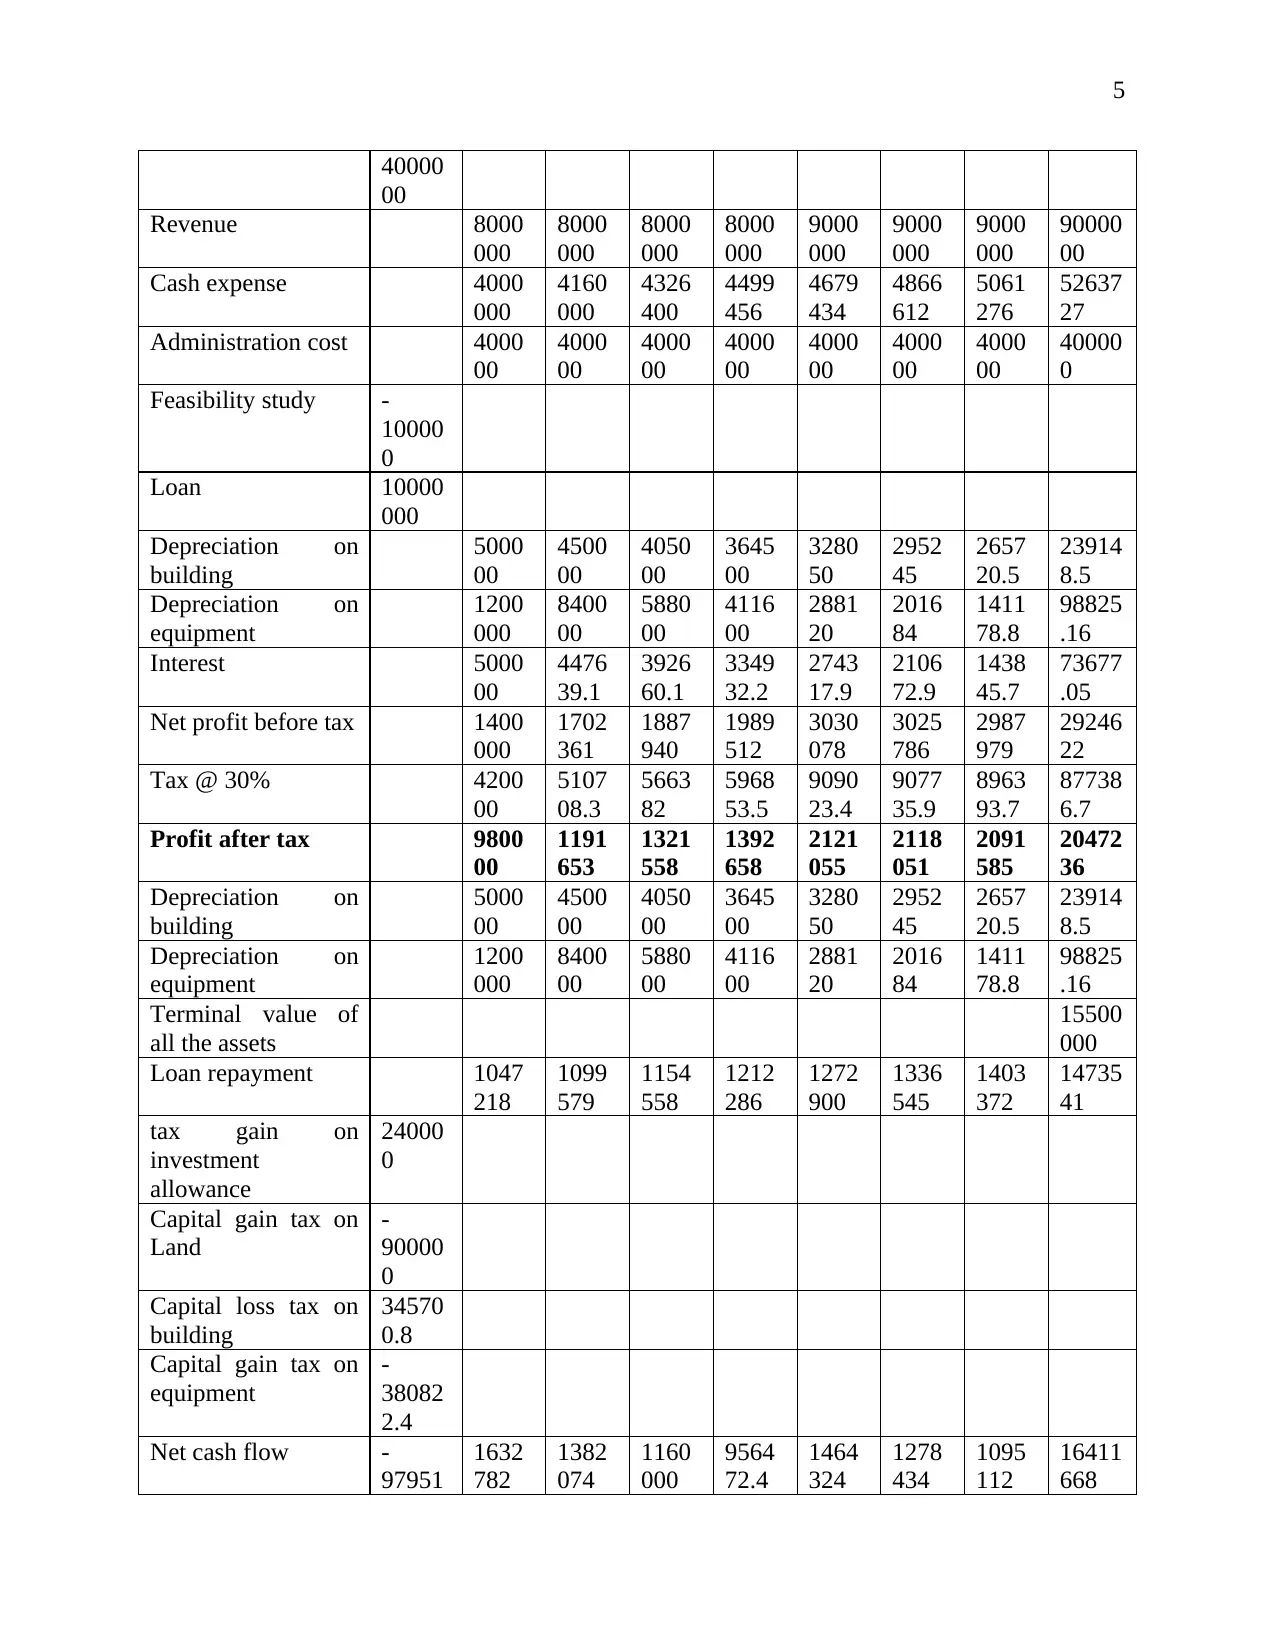
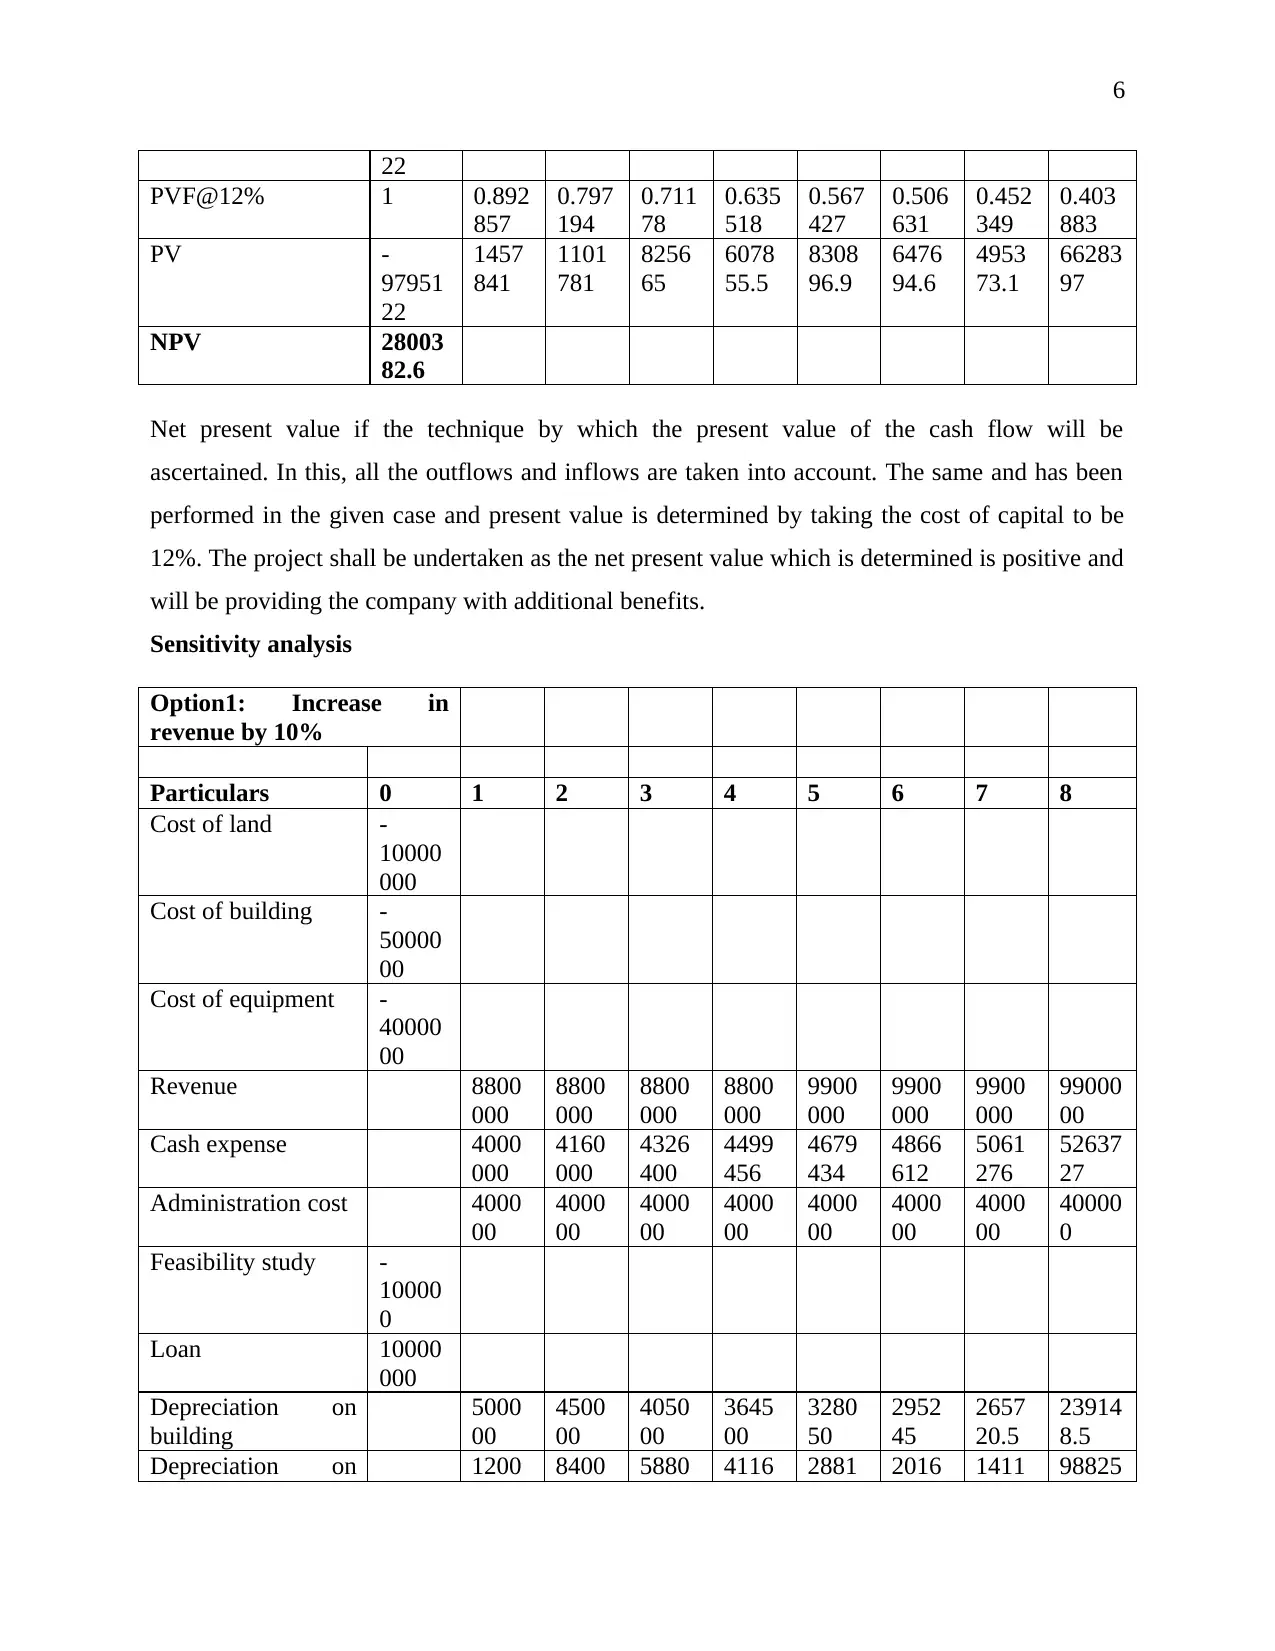
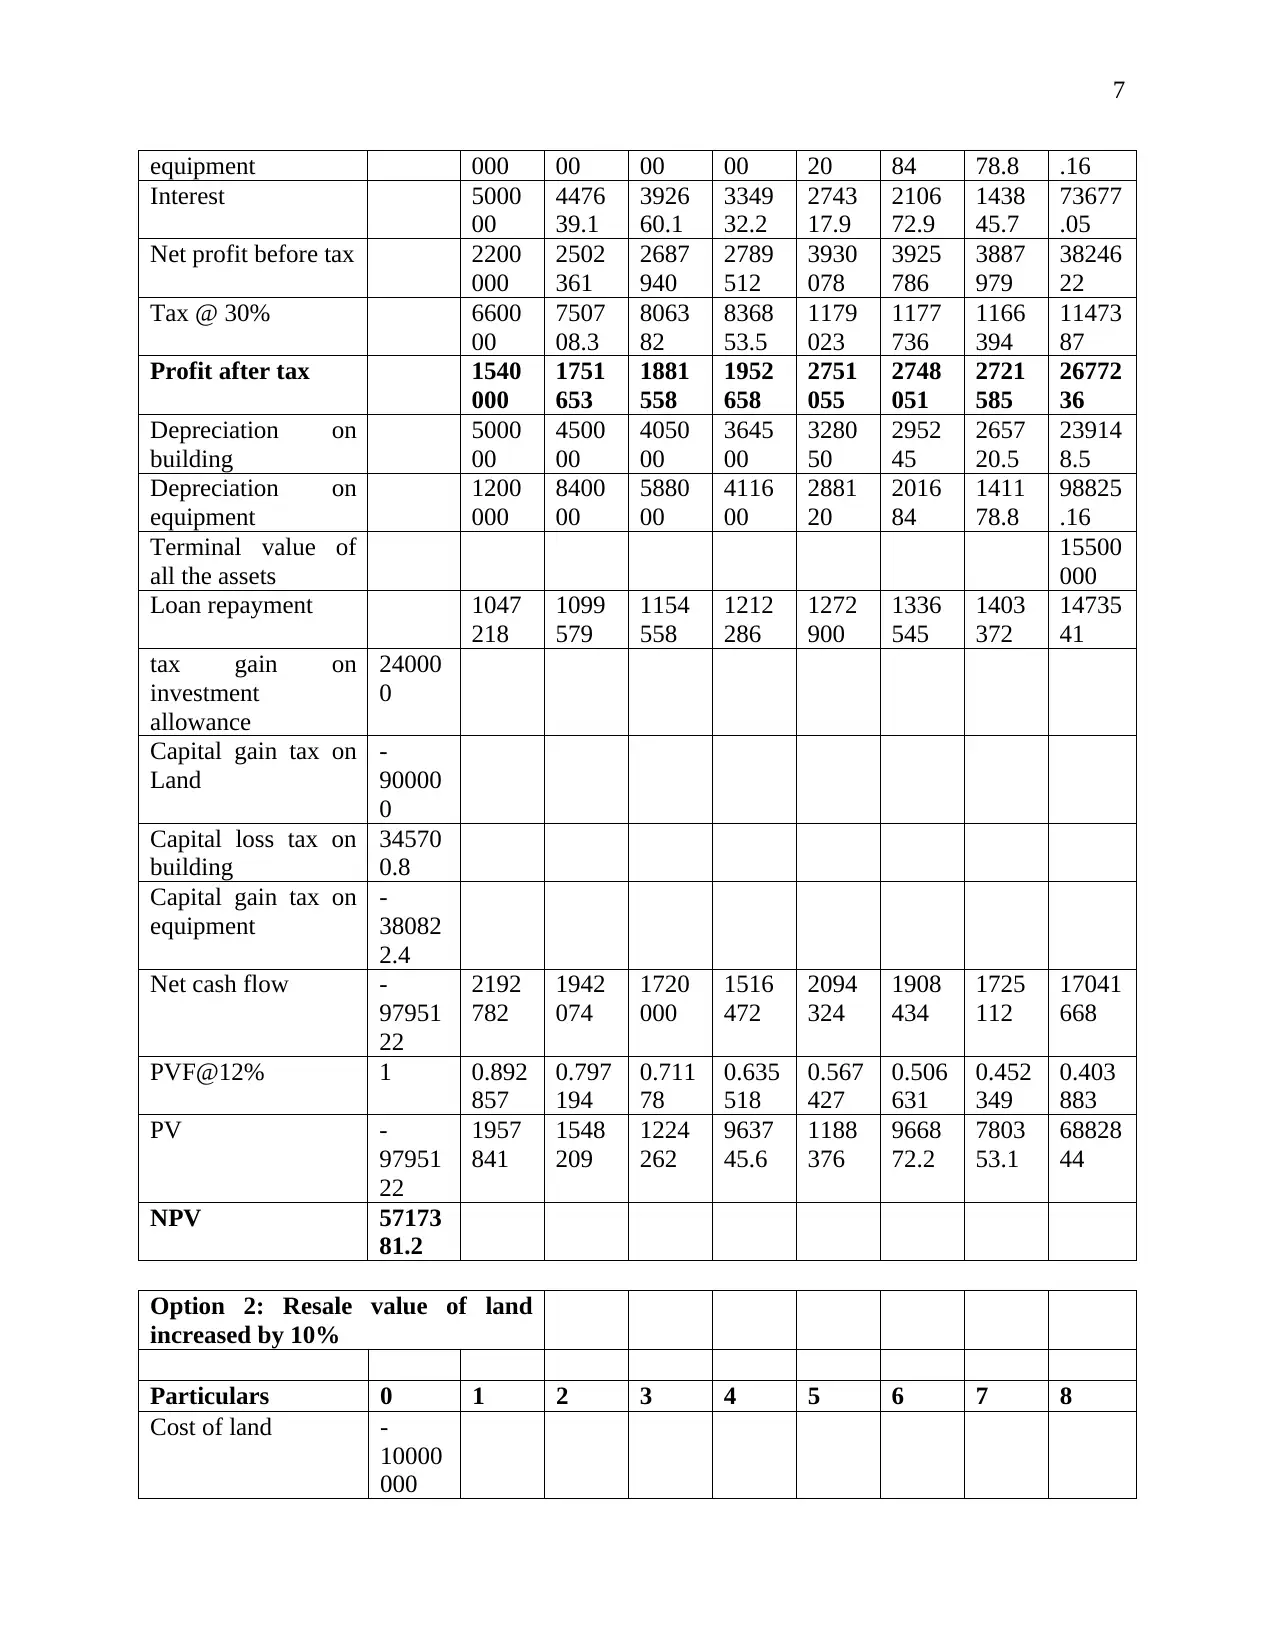
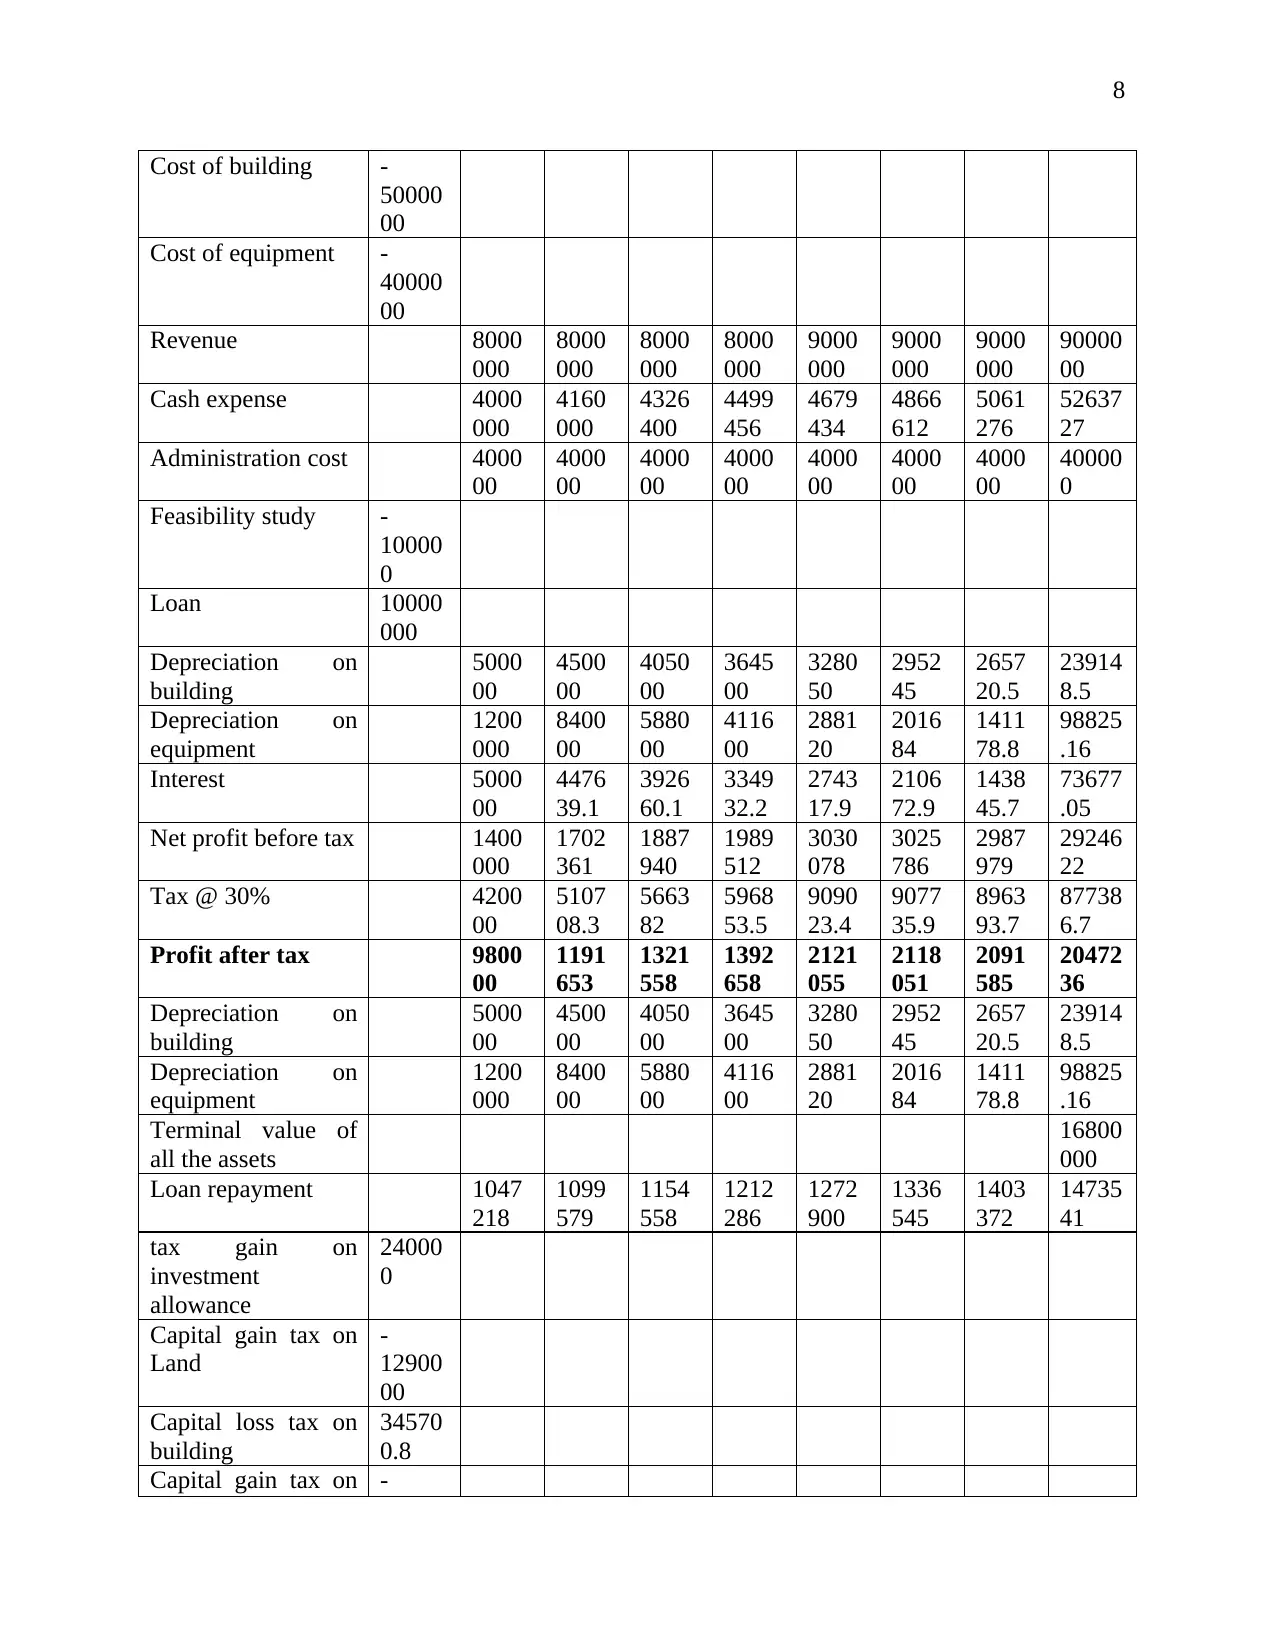
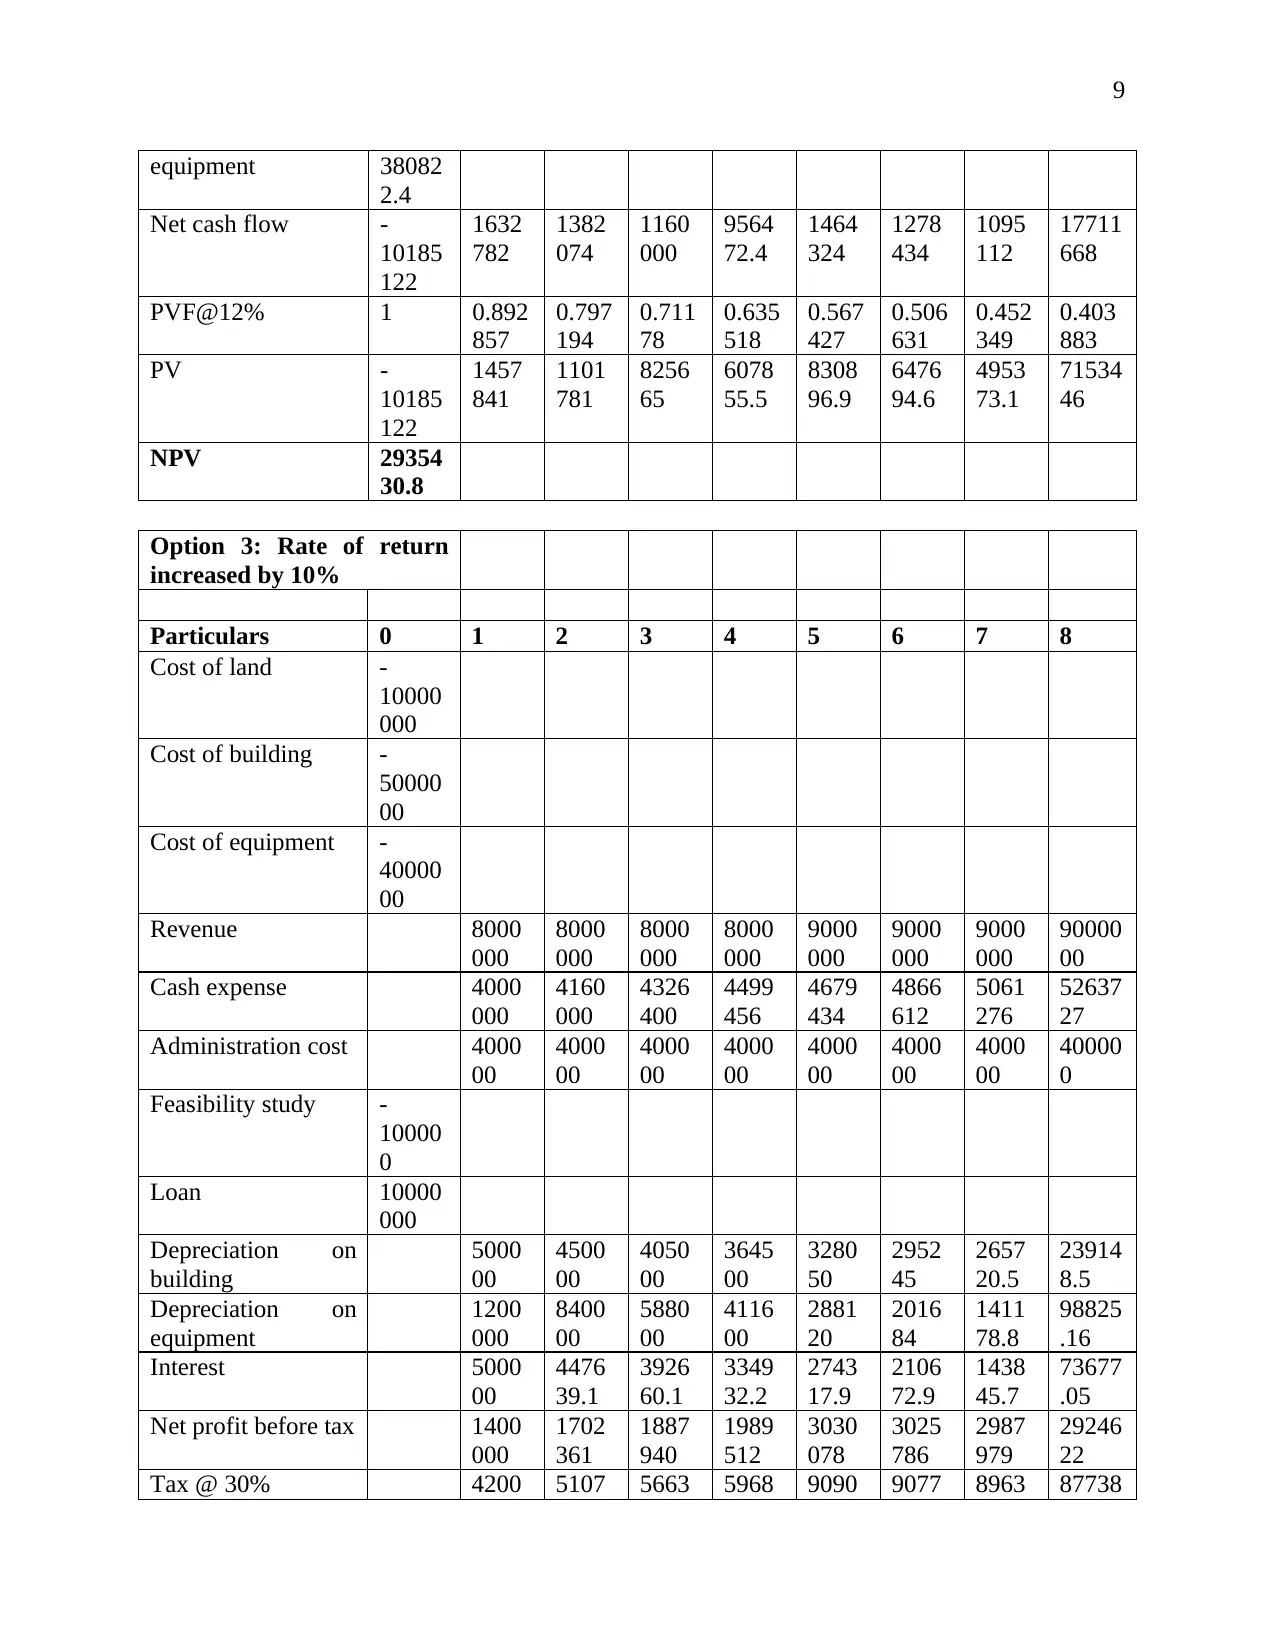
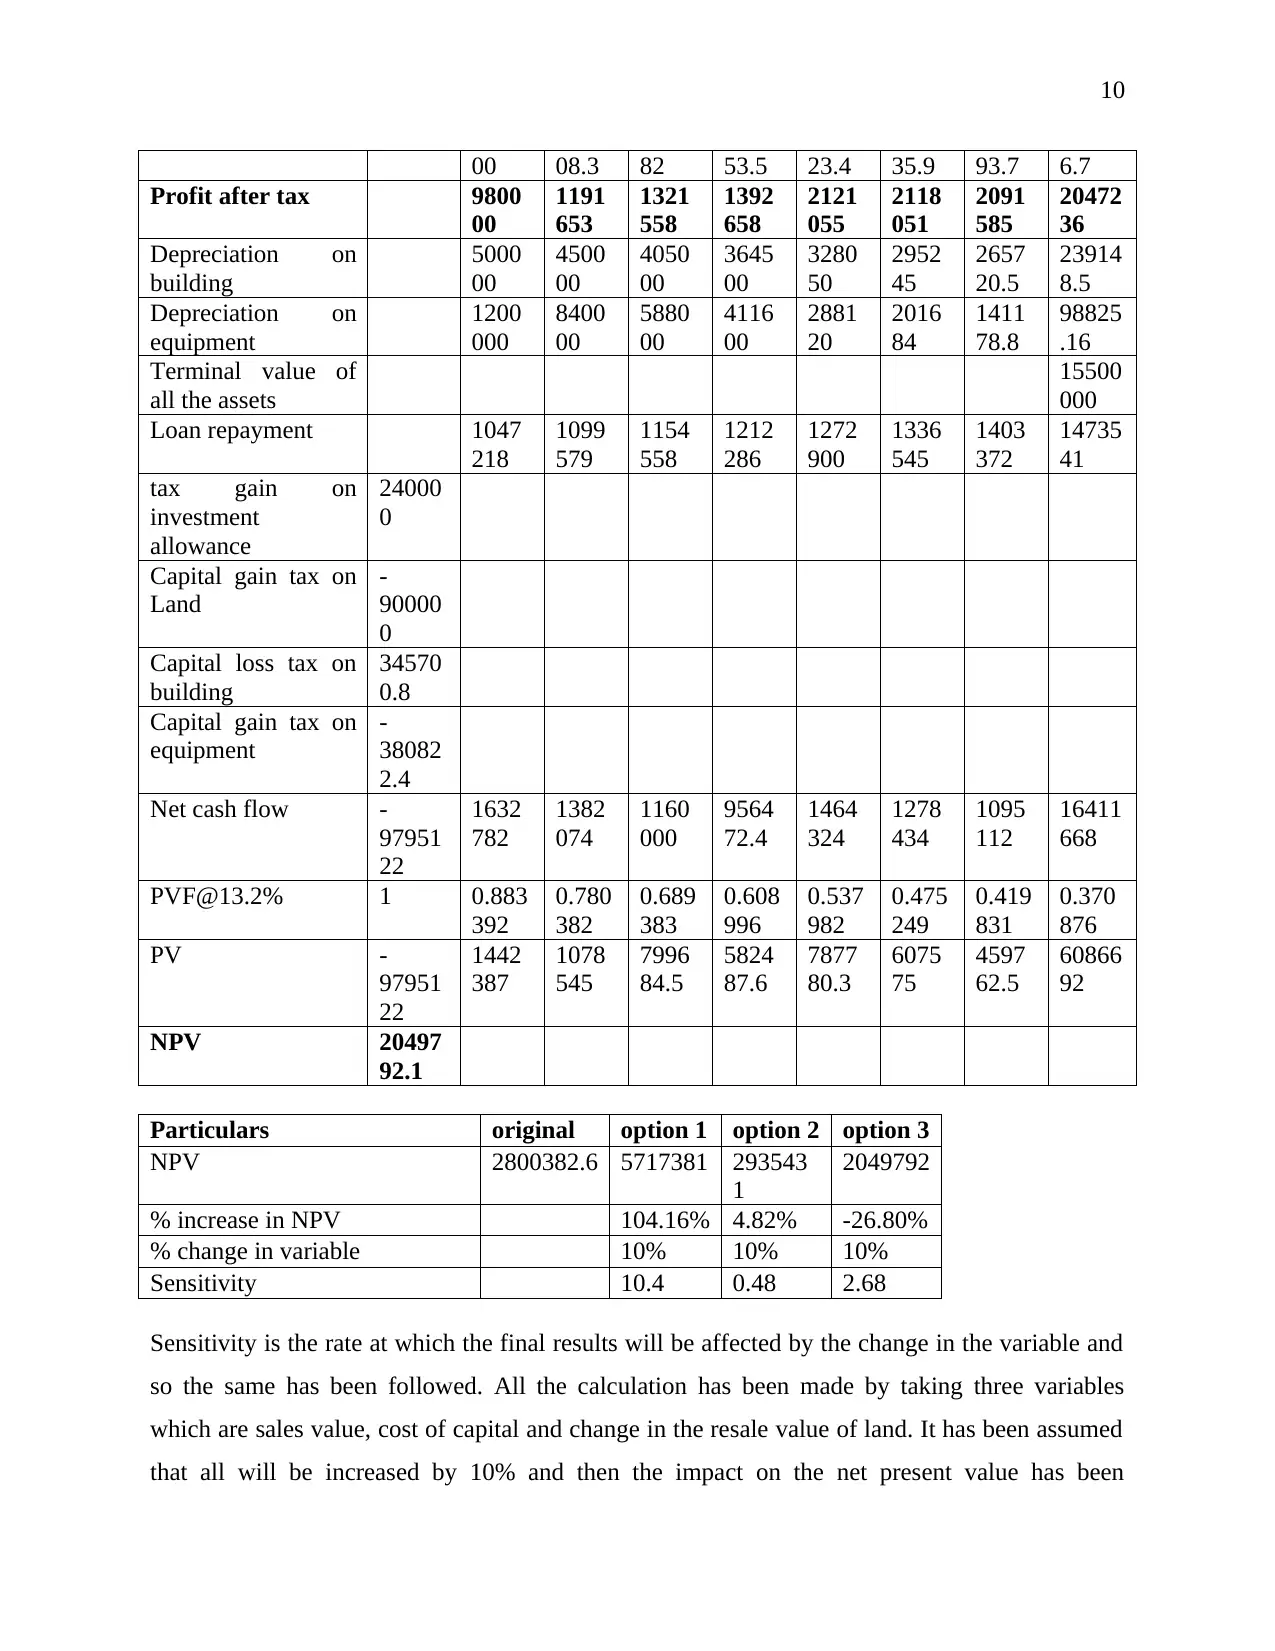
This document presents a comprehensive solution to a capital budgeting assignment, evaluating two distinct projects using financial analysis techniques. Project 1 assesses the optimal timing for car replacement, considering car expenses, depreciation, salvage value, and opportunity costs across multiple years. The analysis includes calculating cash flows, applying a 30% tax rate, and determining the present value of cash flows at a 10% discount rate to identify the most financially advantageous replacement year. Project 2 involves a detailed net present value (NPV) calculation for a new project, incorporating costs, revenues, cash expenses, administration costs, and depreciation. It accounts for loan repayments, interest, and tax implications, and also includes a sensitivity analysis to assess the impact of changes in revenue, resale value of land, and the rate of return on the project's NPV. The findings are presented in Excel format, illustrating the financial viability and sensitivity of the projects.
Document Page
1
MANAGERIAL FINANCE
tabler-icon-diamond-filled.svg

Secure Best Marks with AI Grader

Need help grading? Try our AI Grader for instant feedback on your assignments.
Document Page
2
Table of Contents
Project 1...........................................................................................................................................3
Project 2...........................................................................................................................................4
Document Page
3
Project 1
Particulars Year 1 Year 2 Year 3 Year 4 Year 5 Year 6
Car expense -20000 -20000 -30000 -40000 -50000 -60000
Depreciation 20000 20000 20000 20000 0 0
Book Value of car at the end of
year
60000 40000 20000 0 0 0
Expected salvage value 0 0 30000 25000 20000 10000
Gain/ loss -60000 -40000 10000 25000 20000 10000
Replacement at year
3
Particulars Year3 Year 4 Year 5 Year 6 Total
Car expense -30000
Depreciation expense -20000 -20000
Saving of car expense 0 40000 50000 60000
Capital Gain 10000
Opportunity cost 0 -25000 -20000 -10000
Total Profit or loss -40000 -5000 30000 50000
Tax @30% -12000 -1500 9000 15000
Profit after tax -28000 -3500 21000 35000
Depreciation expense 20000 20000
Cash flow -8000 16500 21000 35000
PVF@10% 0.751315 0.683013 0.620921 0.564474
PV -6010.52 11269.72 13039.35 19756.59 38055.14
Replacement at year
4
Particulars Year 4 Year 5 Year 6 Total
Car expense -40000
Depreciation expense -20000
Saving of car expense 0 50000 60000
Capital Gain 25000
Opportunity cost -20000 -10000
Total Profit or loss -35000 30000 50000
Tax @30% -10500 9000 15000
Profit after tax -24500 21000 35000
Depreciation expense 20000
Cash flow -4500 21000 35000
PVF@10% 0.683013 0.62092
1
0.564474
Document Page
4
PV -3073.56 13039.3
5
19756.59 29722.37
Replacement at year
5
Particulars Year 5 Year 6 Total
Car expense -50000
Saving of car expense 60000
Capital Gain 20000
Opportunity cost -10000
Total Profit or loss -30000 50000
Tax @30% -9000 15000
Profit after tax -21000 35000
PVF@10% 0.620921 0.56447
4
PV -13039.3 19756.5
9
6717.24
Replacement at year
6
Particulars Year 6
Car expense -60000
Capital Gain 10000
Total Profit or loss -50000
Tax @30% -15000
Profit after tax -35000
PVF@10% 0.564474
PV -19756.6
The replacement of the car shall be made at year 3 as by that the company will be recovering
highest amount of the money.
Project 2
Calculation of Net present value
Particulars 0 1 2 3 4 5 6 7 8
Cost of land -
10000
000
Cost of building -
50000
00
Cost of equipment -
tabler-icon-diamond-filled.svg

Secure Best Marks with AI Grader

Need help grading? Try our AI Grader for instant feedback on your assignments.
Document Page
5
40000
00
Revenue 8000
000
8000
000
8000
000
8000
000
9000
000
9000
000
9000
000
90000
00
Cash expense 4000
000
4160
000
4326
400
4499
456
4679
434
4866
612
5061
276
52637
27
Administration cost 4000
00
4000
00
4000
00
4000
00
4000
00
4000
00
4000
00
40000
0
Feasibility study -
10000
0
Loan 10000
000
Depreciation on
building
5000
00
4500
00
4050
00
3645
00
3280
50
2952
45
2657
20.5
23914
8.5
Depreciation on
equipment
1200
000
8400
00
5880
00
4116
00
2881
20
2016
84
1411
78.8
98825
.16
Interest 5000
00
4476
39.1
3926
60.1
3349
32.2
2743
17.9
2106
72.9
1438
45.7
73677
.05
Net profit before tax 1400
000
1702
361
1887
940
1989
512
3030
078
3025
786
2987
979
29246
22
Tax @ 30% 4200
00
5107
08.3
5663
82
5968
53.5
9090
23.4
9077
35.9
8963
93.7
87738
6.7
Profit after tax 9800
00
1191
653
1321
558
1392
658
2121
055
2118
051
2091
585
20472
36
Depreciation on
building
5000
00
4500
00
4050
00
3645
00
3280
50
2952
45
2657
20.5
23914
8.5
Depreciation on
equipment
1200
000
8400
00
5880
00
4116
00
2881
20
2016
84
1411
78.8
98825
.16
Terminal value of
all the assets
15500
000
Loan repayment 1047
218
1099
579
1154
558
1212
286
1272
900
1336
545
1403
372
14735
41
tax gain on
investment
allowance
24000
0
Capital gain tax on
Land
-
90000
0
Capital loss tax on
building
34570
0.8
Capital gain tax on
equipment
-
38082
2.4
Net cash flow -
97951
1632
782
1382
074
1160
000
9564
72.4
1464
324
1278
434
1095
112
16411
668
Document Page
6
22
PVF@12% 1 0.892
857
0.797
194
0.711
78
0.635
518
0.567
427
0.506
631
0.452
349
0.403
883
PV -
97951
22
1457
841
1101
781
8256
65
6078
55.5
8308
96.9
6476
94.6
4953
73.1
66283
97
NPV 28003
82.6
Net present value if the technique by which the present value of the cash flow will be
ascertained. In this, all the outflows and inflows are taken into account. The same and has been
performed in the given case and present value is determined by taking the cost of capital to be
12%. The project shall be undertaken as the net present value which is determined is positive and
will be providing the company with additional benefits.
Sensitivity analysis
Option1: Increase in
revenue by 10%
Particulars 0 1 2 3 4 5 6 7 8
Cost of land -
10000
000
Cost of building -
50000
00
Cost of equipment -
40000
00
Revenue 8800
000
8800
000
8800
000
8800
000
9900
000
9900
000
9900
000
99000
00
Cash expense 4000
000
4160
000
4326
400
4499
456
4679
434
4866
612
5061
276
52637
27
Administration cost 4000
00
4000
00
4000
00
4000
00
4000
00
4000
00
4000
00
40000
0
Feasibility study -
10000
0
Loan 10000
000
Depreciation on
building
5000
00
4500
00
4050
00
3645
00
3280
50
2952
45
2657
20.5
23914
8.5
Depreciation on 1200 8400 5880 4116 2881 2016 1411 98825
Document Page
7
equipment 000 00 00 00 20 84 78.8 .16
Interest 5000
00
4476
39.1
3926
60.1
3349
32.2
2743
17.9
2106
72.9
1438
45.7
73677
.05
Net profit before tax 2200
000
2502
361
2687
940
2789
512
3930
078
3925
786
3887
979
38246
22
Tax @ 30% 6600
00
7507
08.3
8063
82
8368
53.5
1179
023
1177
736
1166
394
11473
87
Profit after tax 1540
000
1751
653
1881
558
1952
658
2751
055
2748
051
2721
585
26772
36
Depreciation on
building
5000
00
4500
00
4050
00
3645
00
3280
50
2952
45
2657
20.5
23914
8.5
Depreciation on
equipment
1200
000
8400
00
5880
00
4116
00
2881
20
2016
84
1411
78.8
98825
.16
Terminal value of
all the assets
15500
000
Loan repayment 1047
218
1099
579
1154
558
1212
286
1272
900
1336
545
1403
372
14735
41
tax gain on
investment
allowance
24000
0
Capital gain tax on
Land
-
90000
0
Capital loss tax on
building
34570
0.8
Capital gain tax on
equipment
-
38082
2.4
Net cash flow -
97951
22
2192
782
1942
074
1720
000
1516
472
2094
324
1908
434
1725
112
17041
668
PVF@12% 1 0.892
857
0.797
194
0.711
78
0.635
518
0.567
427
0.506
631
0.452
349
0.403
883
PV -
97951
22
1957
841
1548
209
1224
262
9637
45.6
1188
376
9668
72.2
7803
53.1
68828
44
NPV 57173
81.2
Option 2: Resale value of land
increased by 10%
Particulars 0 1 2 3 4 5 6 7 8
Cost of land -
10000
000
tabler-icon-diamond-filled.svg

Paraphrase This Document

Need a fresh take? Get an instant paraphrase of this document with our AI Paraphraser
Document Page
8
Cost of building -
50000
00
Cost of equipment -
40000
00
Revenue 8000
000
8000
000
8000
000
8000
000
9000
000
9000
000
9000
000
90000
00
Cash expense 4000
000
4160
000
4326
400
4499
456
4679
434
4866
612
5061
276
52637
27
Administration cost 4000
00
4000
00
4000
00
4000
00
4000
00
4000
00
4000
00
40000
0
Feasibility study -
10000
0
Loan 10000
000
Depreciation on
building
5000
00
4500
00
4050
00
3645
00
3280
50
2952
45
2657
20.5
23914
8.5
Depreciation on
equipment
1200
000
8400
00
5880
00
4116
00
2881
20
2016
84
1411
78.8
98825
.16
Interest 5000
00
4476
39.1
3926
60.1
3349
32.2
2743
17.9
2106
72.9
1438
45.7
73677
.05
Net profit before tax 1400
000
1702
361
1887
940
1989
512
3030
078
3025
786
2987
979
29246
22
Tax @ 30% 4200
00
5107
08.3
5663
82
5968
53.5
9090
23.4
9077
35.9
8963
93.7
87738
6.7
Profit after tax 9800
00
1191
653
1321
558
1392
658
2121
055
2118
051
2091
585
20472
36
Depreciation on
building
5000
00
4500
00
4050
00
3645
00
3280
50
2952
45
2657
20.5
23914
8.5
Depreciation on
equipment
1200
000
8400
00
5880
00
4116
00
2881
20
2016
84
1411
78.8
98825
.16
Terminal value of
all the assets
16800
000
Loan repayment 1047
218
1099
579
1154
558
1212
286
1272
900
1336
545
1403
372
14735
41
tax gain on
investment
allowance
24000
0
Capital gain tax on
Land
-
12900
00
Capital loss tax on
building
34570
0.8
Capital gain tax on -
Document Page
9
equipment 38082
2.4
Net cash flow -
10185
122
1632
782
1382
074
1160
000
9564
72.4
1464
324
1278
434
1095
112
17711
668
PVF@12% 1 0.892
857
0.797
194
0.711
78
0.635
518
0.567
427
0.506
631
0.452
349
0.403
883
PV -
10185
122
1457
841
1101
781
8256
65
6078
55.5
8308
96.9
6476
94.6
4953
73.1
71534
46
NPV 29354
30.8
Option 3: Rate of return
increased by 10%
Particulars 0 1 2 3 4 5 6 7 8
Cost of land -
10000
000
Cost of building -
50000
00
Cost of equipment -
40000
00
Revenue 8000
000
8000
000
8000
000
8000
000
9000
000
9000
000
9000
000
90000
00
Cash expense 4000
000
4160
000
4326
400
4499
456
4679
434
4866
612
5061
276
52637
27
Administration cost 4000
00
4000
00
4000
00
4000
00
4000
00
4000
00
4000
00
40000
0
Feasibility study -
10000
0
Loan 10000
000
Depreciation on
building
5000
00
4500
00
4050
00
3645
00
3280
50
2952
45
2657
20.5
23914
8.5
Depreciation on
equipment
1200
000
8400
00
5880
00
4116
00
2881
20
2016
84
1411
78.8
98825
.16
Interest 5000
00
4476
39.1
3926
60.1
3349
32.2
2743
17.9
2106
72.9
1438
45.7
73677
.05
Net profit before tax 1400
000
1702
361
1887
940
1989
512
3030
078
3025
786
2987
979
29246
22
Tax @ 30% 4200 5107 5663 5968 9090 9077 8963 87738
Document Page
10
00 08.3 82 53.5 23.4 35.9 93.7 6.7
Profit after tax 9800
00
1191
653
1321
558
1392
658
2121
055
2118
051
2091
585
20472
36
Depreciation on
building
5000
00
4500
00
4050
00
3645
00
3280
50
2952
45
2657
20.5
23914
8.5
Depreciation on
equipment
1200
000
8400
00
5880
00
4116
00
2881
20
2016
84
1411
78.8
98825
.16
Terminal value of
all the assets
15500
000
Loan repayment 1047
218
1099
579
1154
558
1212
286
1272
900
1336
545
1403
372
14735
41
tax gain on
investment
allowance
24000
0
Capital gain tax on
Land
-
90000
0
Capital loss tax on
building
34570
0.8
Capital gain tax on
equipment
-
38082
2.4
Net cash flow -
97951
22
1632
782
1382
074
1160
000
9564
72.4
1464
324
1278
434
1095
112
16411
668
PVF@13.2% 1 0.883
392
0.780
382
0.689
383
0.608
996
0.537
982
0.475
249
0.419
831
0.370
876
PV -
97951
22
1442
387
1078
545
7996
84.5
5824
87.6
7877
80.3
6075
75
4597
62.5
60866
92
NPV 20497
92.1
Particulars original option 1 option 2 option 3
NPV 2800382.6 5717381 293543
1
2049792
% increase in NPV 104.16% 4.82% -26.80%
% change in variable 10% 10% 10%
Sensitivity 10.4 0.48 2.68
Sensitivity is the rate at which the final results will be affected by the change in the variable and
so the same has been followed. All the calculation has been made by taking three variables
which are sales value, cost of capital and change in the resale value of land. It has been assumed
that all will be increased by 10% and then the impact on the net present value has been
chevron_up_icon
1 out of 10
circle_padding
hide_on_mobile
zoom_out_icon
[object Object]