Managerial Finance Report: Financial Performance of Sainsbury & Tesco
VerifiedAdded on 2020/01/07
|20
|4362
|182
Report
AI Summary
This report presents a comprehensive analysis of the financial performance of two major retail companies, Sainsbury and Tesco, using various financial ratios. The analysis includes the calculation and interpretation of key ratios such as current ratio, quick ratio, net profit ratio, gross profit ratio, debt-equity ratio, price-earnings ratio, ROCE, inventory turnover ratio, dividend payout ratio, and gearing ratio. The report compares the performance of the two companies across these metrics, highlighting their strengths and weaknesses. Furthermore, it explores potential strategies for improving the performance of poorly performing businesses. The second part of the report delves into project evaluation methods, including payback period, average rate of return (ARR), net present value (NPV), and internal rate of return (IRR), along with a discussion of the limitations of using investment appraisal techniques for long-term decision-making.
MANAGERIAL FINANCE
Paraphrase This Document
Need a fresh take? Get an instant paraphrase of this document with our AI Paraphraser
TABLE OF CONTENTS
INTRODUCTION.....................................................................................................................................3
Portfolio1...................................................................................................................................................3
(a) Calculation of ratios..........................................................................................................................3
(b) Way in which performance of poorly performing business can be improved.................................13
© Limitation of relying on ratios to measure firm performance...........................................................14
Portfolio 2................................................................................................................................................15
(a)Project evaluation method...............................................................................................................15
(b) Limitations of using investment appraisal techniques for long term decision making....................17
CONCLUSION........................................................................................................................................18
REFERENCES........................................................................................................................................19
Figure 1Current ratio of Tesco and Sainsbury...........................................................................................3
Figure 2 Quick ratio of Sainsbury and Tesco.............................................................................................4
Figure 3 Net profit ratio of Sainsbury and Tesco.......................................................................................5
Figure 4 Gross profit ratio of Sainsbury and Tesco....................................................................................6
Figure 6 PE ratio of Sainsbury and Tesco..................................................................................................7
Figure 7 ROCE of Sainsbury and Tesco....................................................................................................8
Figure 8 Inventory turnover ratio of Sainsbury and Tesco.........................................................................9
Figure 9 Dividend payout ratio of Tesco and Sainsbury............................................................................9
Figure 10 Gearing ratio of Sainsbury and Tesco......................................................................................10
Table 1 Ratio analysis of Sainsbury...........................................................................................................4
Table 2 Ratio analysis of Tesco.................................................................................................................5
Table 3 Calculation of payback period.....................................................................................................16
Table 4 Calculation of ARR....................................................................................................................16
Table 5 Calculation of NPV.....................................................................................................................17
Table 6 Calculation of IRR......................................................................................................................18
INTRODUCTION
Making an investment in the business firm is a very tough task and lots of decisions
need to be made in respect to making an investment in the shares. In the current report ratio
analysis is done and comments are made on the firm ratios. In this respect two firms are taken
which are Sainsbury and Tesco. Comparison of both firms’ ratios is done and recommendations
are given in respect to improvements that can be done in specific area. In second part of the
report project evaluation is done and on that basis specific project is selected. Limitation of
project evaluation methods are also explained briefly at end of the report.
Portfolio1
(a) Calculation of ratios
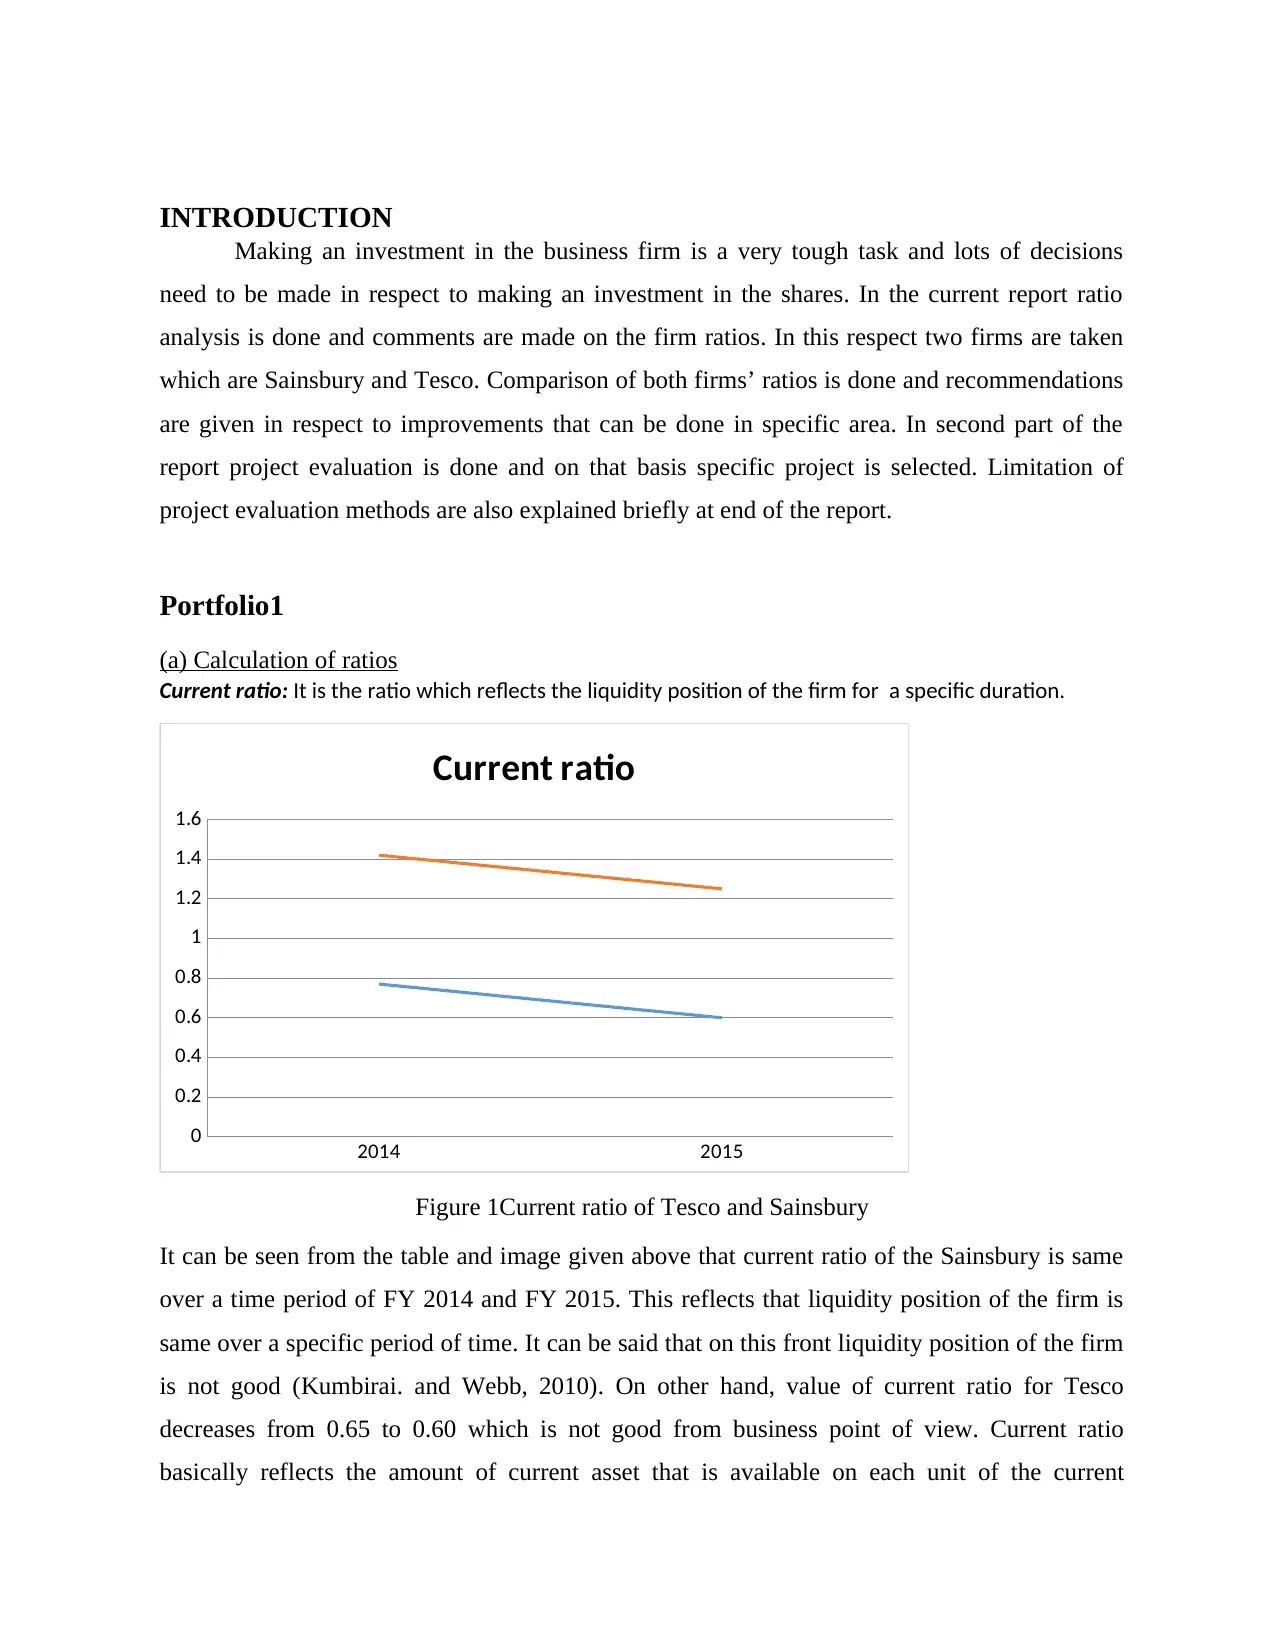
Current ratio: It is the ratio which reflects the liquidity position of the firm for a specific duration.
2014 2015
0
0.2
0.4
0.6
0.8
1
1.2
1.4
1.6
Current ratio
Figure 1Current ratio of Tesco and Sainsbury
It can be seen from the table and image given above that current ratio of the Sainsbury is same
over a time period of FY 2014 and FY 2015. This reflects that liquidity position of the firm is
same over a specific period of time. It can be said that on this front liquidity position of the firm
is not good (Kumbirai. and Webb, 2010). On other hand, value of current ratio for Tesco
decreases from 0.65 to 0.60 which is not good from business point of view. Current ratio
basically reflects the amount of current asset that is available on each unit of the current
Making an investment in the business firm is a very tough task and lots of decisions
need to be made in respect to making an investment in the shares. In the current report ratio
analysis is done and comments are made on the firm ratios. In this respect two firms are taken
which are Sainsbury and Tesco. Comparison of both firms’ ratios is done and recommendations
are given in respect to improvements that can be done in specific area. In second part of the
report project evaluation is done and on that basis specific project is selected. Limitation of
project evaluation methods are also explained briefly at end of the report.
Portfolio1
(a) Calculation of ratios
Current ratio: It is the ratio which reflects the liquidity position of the firm for a specific duration.
2014 2015
0
0.2
0.4
0.6
0.8
1
1.2
1.4
1.6
Current ratio
Figure 1Current ratio of Tesco and Sainsbury
It can be seen from the table and image given above that current ratio of the Sainsbury is same
over a time period of FY 2014 and FY 2015. This reflects that liquidity position of the firm is
same over a specific period of time. It can be said that on this front liquidity position of the firm
is not good (Kumbirai. and Webb, 2010). On other hand, value of current ratio for Tesco
decreases from 0.65 to 0.60 which is not good from business point of view. Current ratio
basically reflects the amount of current asset that is available on each unit of the current
⊘ This is a preview!⊘
Do you want full access?
Subscribe today to unlock all pages.
Trusted by 1+ million students worldwide
liability. It can be said that for every one pound of current liability Sainsbury have 0.33 current
asset. This reflects that firm does not have sufficient amount of money to pay its current liability
on time by using current asset.This happened because it failed to make and implement good
cash management strategy for the business. The availability of current asset in Tesco business
also decline. In case of both firms insufficient cash is available which is matter of concern for
them in terms of timely payment of current liability. However, on comparison it can be said that
Tesco liquidity position is better than Sainsbury. Due to decline in current ratio firm may face
shortage of cash in its business and may find it difficult to pay current liability on time.
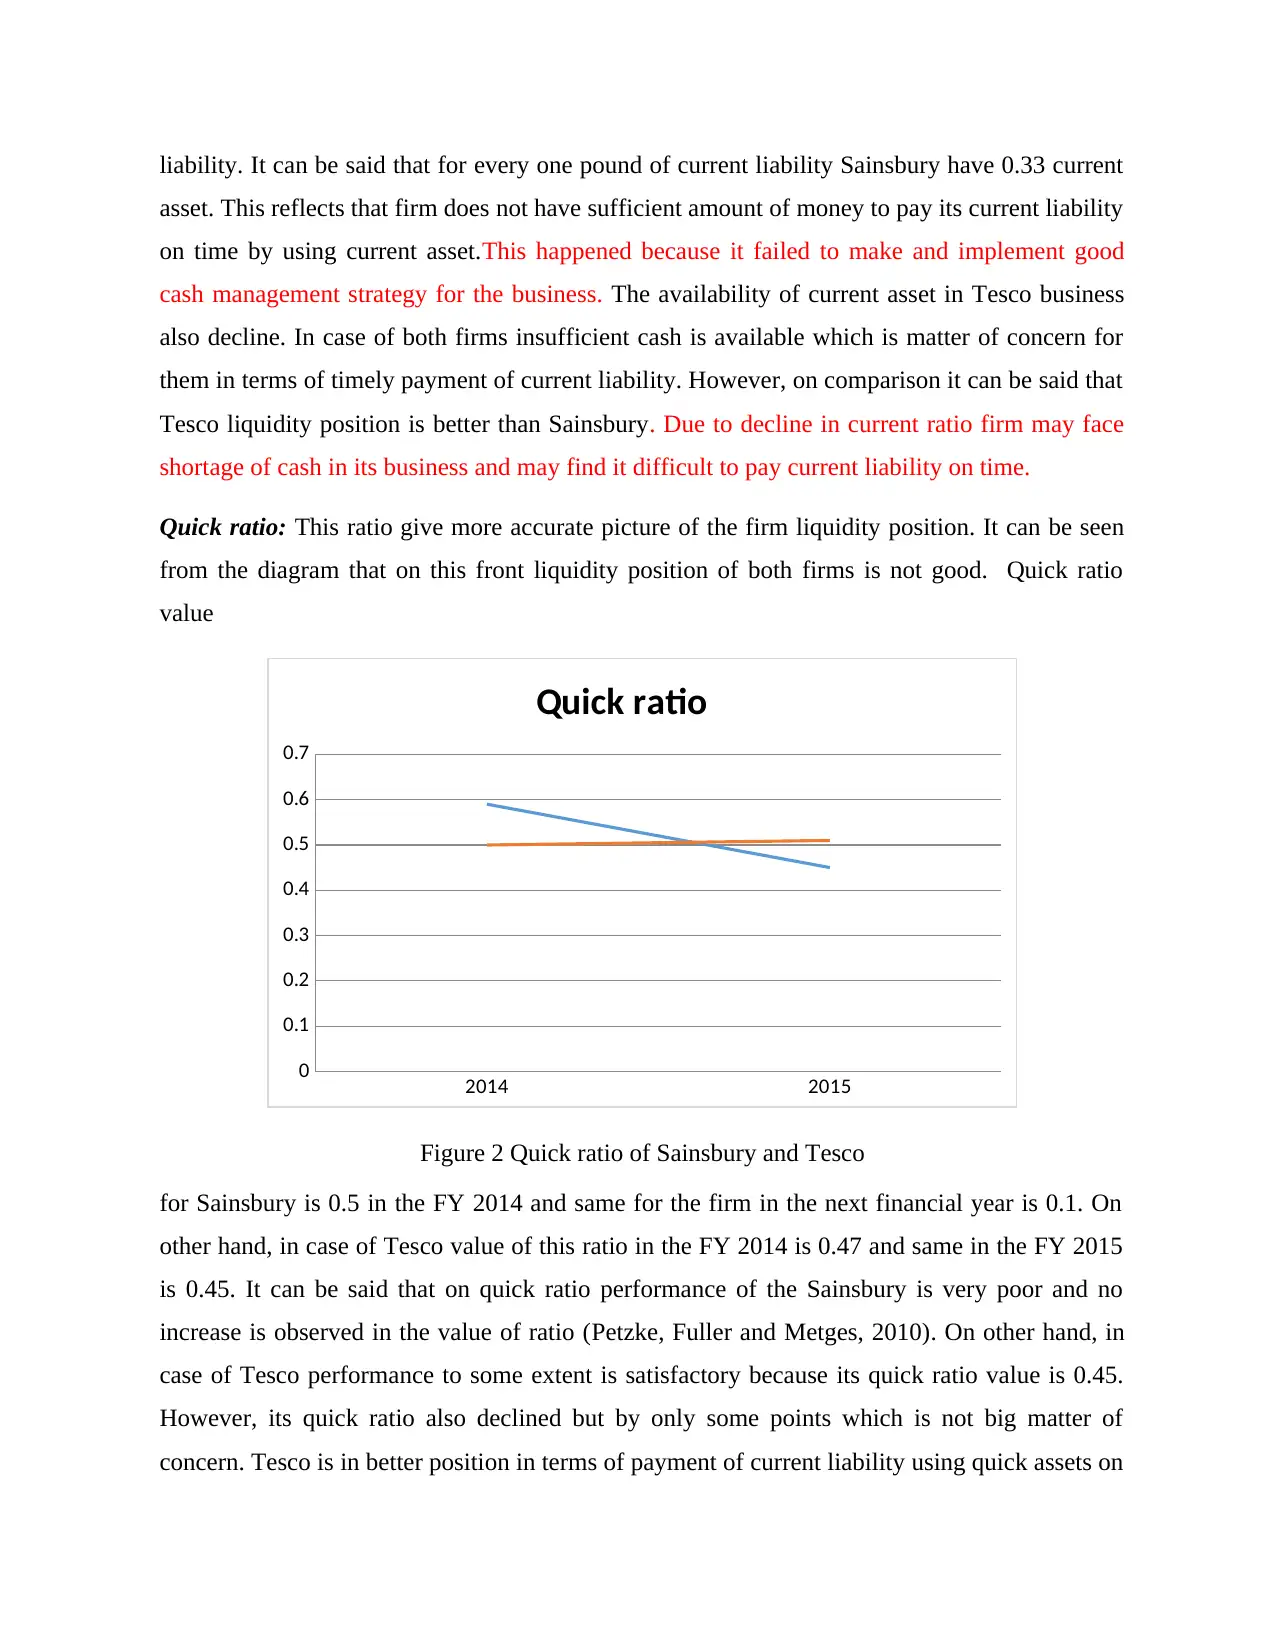
Quick ratio: This ratio give more accurate picture of the firm liquidity position. It can be seen
from the diagram that on this front liquidity position of both firms is not good. Quick ratio
value
2014 2015
0
0.1
0.2
0.3
0.4
0.5
0.6
0.7
Quick ratio
Figure 2 Quick ratio of Sainsbury and Tesco
for Sainsbury is 0.5 in the FY 2014 and same for the firm in the next financial year is 0.1. On
other hand, in case of Tesco value of this ratio in the FY 2014 is 0.47 and same in the FY 2015
is 0.45. It can be said that on quick ratio performance of the Sainsbury is very poor and no
increase is observed in the value of ratio (Petzke, Fuller and Metges, 2010). On other hand, in
case of Tesco performance to some extent is satisfactory because its quick ratio value is 0.45.
However, its quick ratio also declined but by only some points which is not big matter of
concern. Tesco is in better position in terms of payment of current liability using quick assets on
asset. This reflects that firm does not have sufficient amount of money to pay its current liability
on time by using current asset.This happened because it failed to make and implement good
cash management strategy for the business. The availability of current asset in Tesco business
also decline. In case of both firms insufficient cash is available which is matter of concern for
them in terms of timely payment of current liability. However, on comparison it can be said that
Tesco liquidity position is better than Sainsbury. Due to decline in current ratio firm may face
shortage of cash in its business and may find it difficult to pay current liability on time.
Quick ratio: This ratio give more accurate picture of the firm liquidity position. It can be seen
from the diagram that on this front liquidity position of both firms is not good. Quick ratio
value
2014 2015
0
0.1
0.2
0.3
0.4
0.5
0.6
0.7
Quick ratio
Figure 2 Quick ratio of Sainsbury and Tesco
for Sainsbury is 0.5 in the FY 2014 and same for the firm in the next financial year is 0.1. On
other hand, in case of Tesco value of this ratio in the FY 2014 is 0.47 and same in the FY 2015
is 0.45. It can be said that on quick ratio performance of the Sainsbury is very poor and no
increase is observed in the value of ratio (Petzke, Fuller and Metges, 2010). On other hand, in
case of Tesco performance to some extent is satisfactory because its quick ratio value is 0.45.
However, its quick ratio also declined but by only some points which is not big matter of
concern. Tesco is in better position in terms of payment of current liability using quick assets on
Paraphrase This Document
Need a fresh take? Get an instant paraphrase of this document with our AI Paraphraser
time. However, it can only pay 50% of its liability by using current assets. It can be said that
Tesco perform better then Sainsbury.
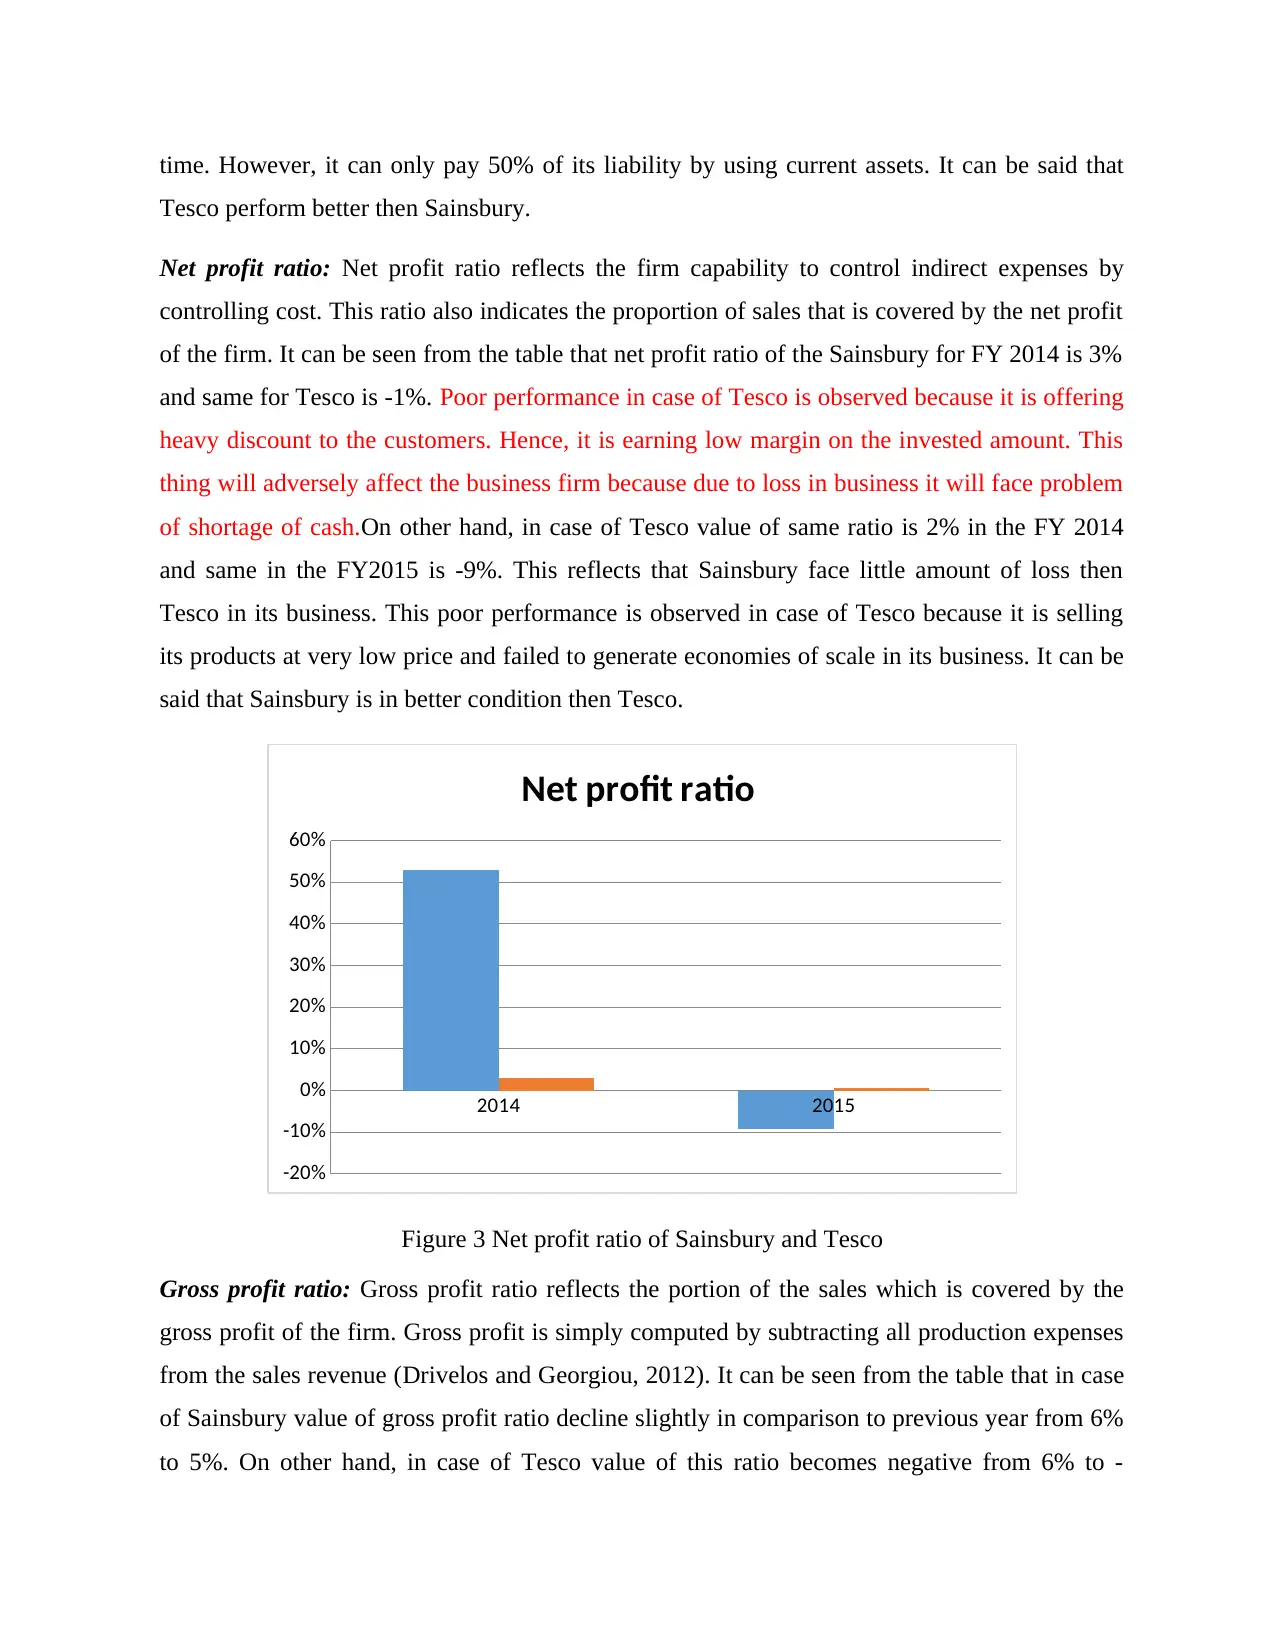
Net profit ratio: Net profit ratio reflects the firm capability to control indirect expenses by
controlling cost. This ratio also indicates the proportion of sales that is covered by the net profit
of the firm. It can be seen from the table that net profit ratio of the Sainsbury for FY 2014 is 3%
and same for Tesco is -1%. Poor performance in case of Tesco is observed because it is offering
heavy discount to the customers. Hence, it is earning low margin on the invested amount. This
thing will adversely affect the business firm because due to loss in business it will face problem
of shortage of cash.On other hand, in case of Tesco value of same ratio is 2% in the FY 2014
and same in the FY2015 is -9%. This reflects that Sainsbury face little amount of loss then
Tesco in its business. This poor performance is observed in case of Tesco because it is selling
its products at very low price and failed to generate economies of scale in its business. It can be
said that Sainsbury is in better condition then Tesco.
2014 2015
-20%
-10%
0%
10%
20%
30%
40%
50%
60%
Net profit ratio
Figure 3 Net profit ratio of Sainsbury and Tesco
Gross profit ratio: Gross profit ratio reflects the portion of the sales which is covered by the
gross profit of the firm. Gross profit is simply computed by subtracting all production expenses
from the sales revenue (Drivelos and Georgiou, 2012). It can be seen from the table that in case
of Sainsbury value of gross profit ratio decline slightly in comparison to previous year from 6%
to 5%. On other hand, in case of Tesco value of this ratio becomes negative from 6% to -
Tesco perform better then Sainsbury.
Net profit ratio: Net profit ratio reflects the firm capability to control indirect expenses by
controlling cost. This ratio also indicates the proportion of sales that is covered by the net profit
of the firm. It can be seen from the table that net profit ratio of the Sainsbury for FY 2014 is 3%
and same for Tesco is -1%. Poor performance in case of Tesco is observed because it is offering
heavy discount to the customers. Hence, it is earning low margin on the invested amount. This
thing will adversely affect the business firm because due to loss in business it will face problem
of shortage of cash.On other hand, in case of Tesco value of same ratio is 2% in the FY 2014
and same in the FY2015 is -9%. This reflects that Sainsbury face little amount of loss then
Tesco in its business. This poor performance is observed in case of Tesco because it is selling
its products at very low price and failed to generate economies of scale in its business. It can be
said that Sainsbury is in better condition then Tesco.
2014 2015
-20%
-10%
0%
10%
20%
30%
40%
50%
60%
Net profit ratio
Figure 3 Net profit ratio of Sainsbury and Tesco
Gross profit ratio: Gross profit ratio reflects the portion of the sales which is covered by the
gross profit of the firm. Gross profit is simply computed by subtracting all production expenses
from the sales revenue (Drivelos and Georgiou, 2012). It can be seen from the table that in case
of Sainsbury value of gross profit ratio decline slightly in comparison to previous year from 6%
to 5%. On other hand, in case of Tesco value of this ratio becomes negative from 6% to -
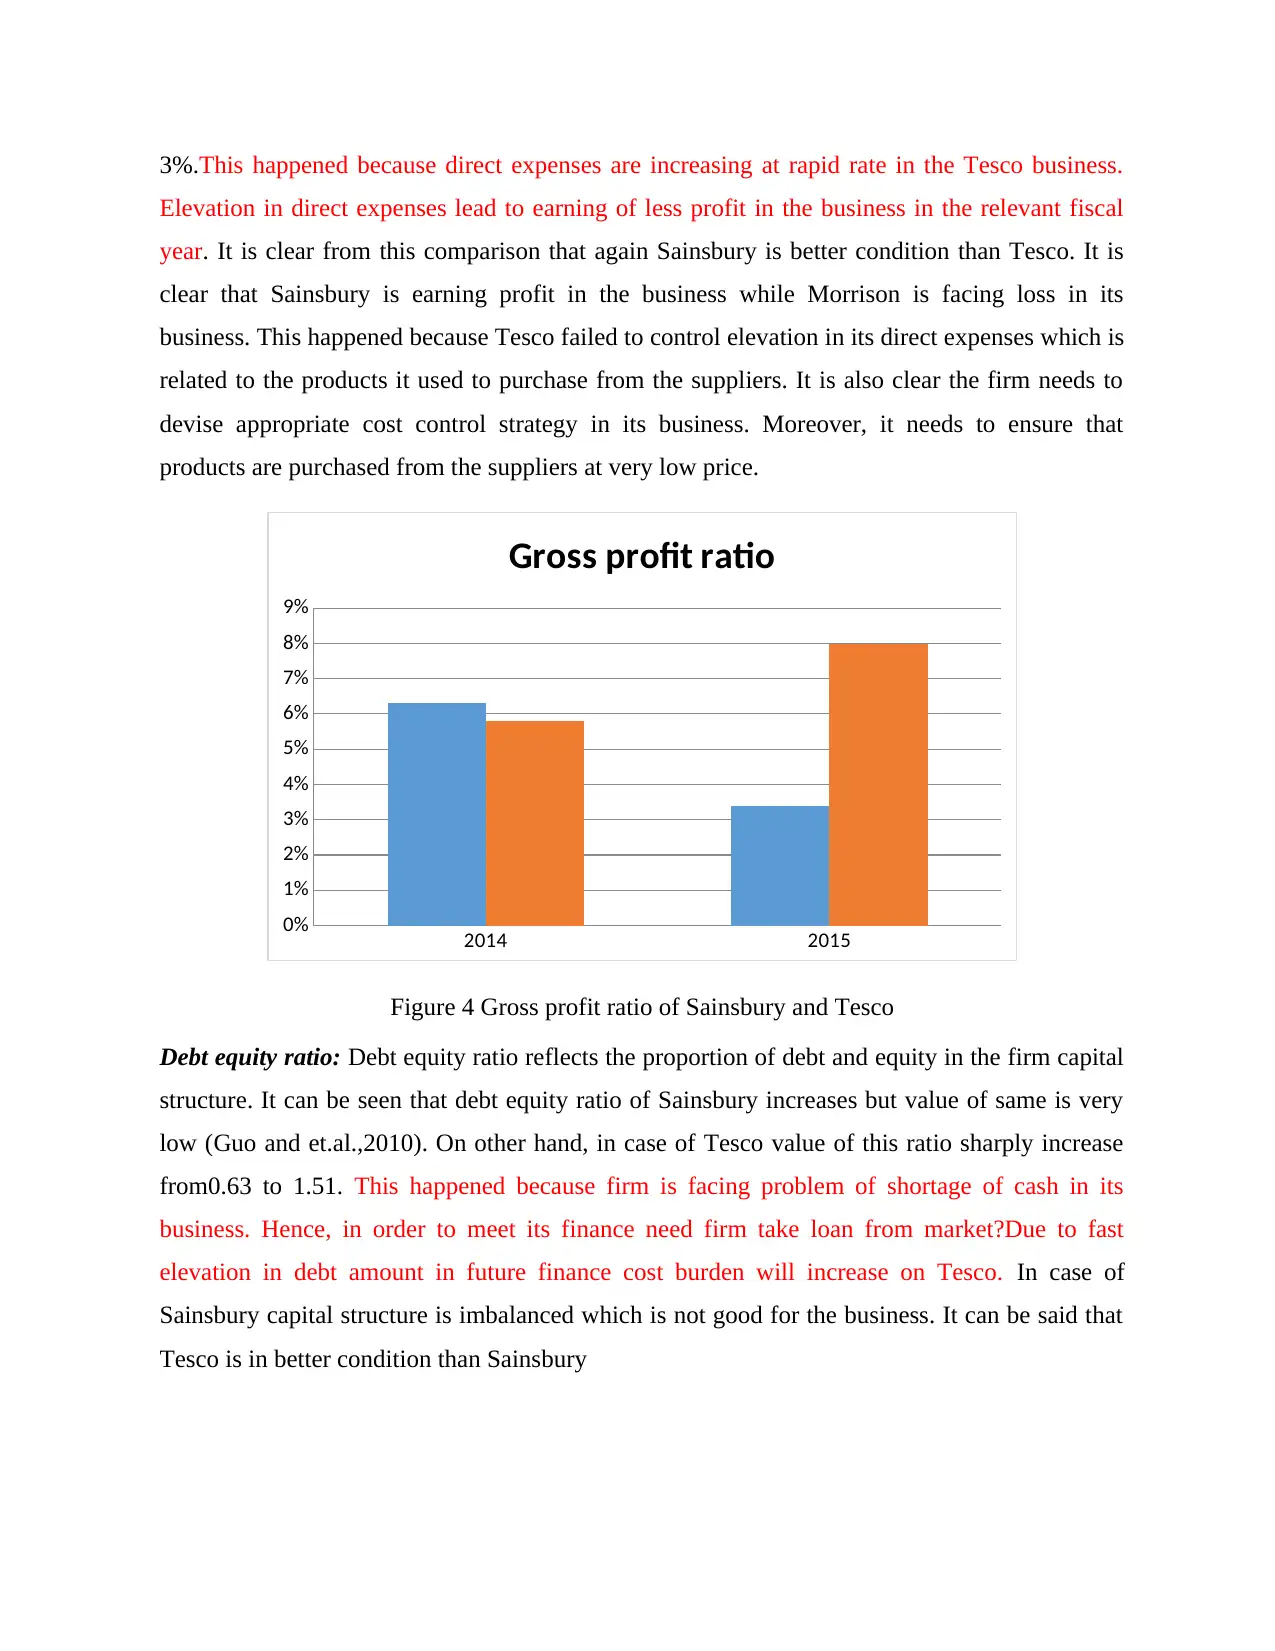
3%.This happened because direct expenses are increasing at rapid rate in the Tesco business.
Elevation in direct expenses lead to earning of less profit in the business in the relevant fiscal
year. It is clear from this comparison that again Sainsbury is better condition than Tesco. It is
clear that Sainsbury is earning profit in the business while Morrison is facing loss in its
business. This happened because Tesco failed to control elevation in its direct expenses which is
related to the products it used to purchase from the suppliers. It is also clear the firm needs to
devise appropriate cost control strategy in its business. Moreover, it needs to ensure that
products are purchased from the suppliers at very low price.
2014 2015
0%
1%
2%
3%
4%
5%
6%
7%
8%
9%
Gross profit ratio
Figure 4 Gross profit ratio of Sainsbury and Tesco
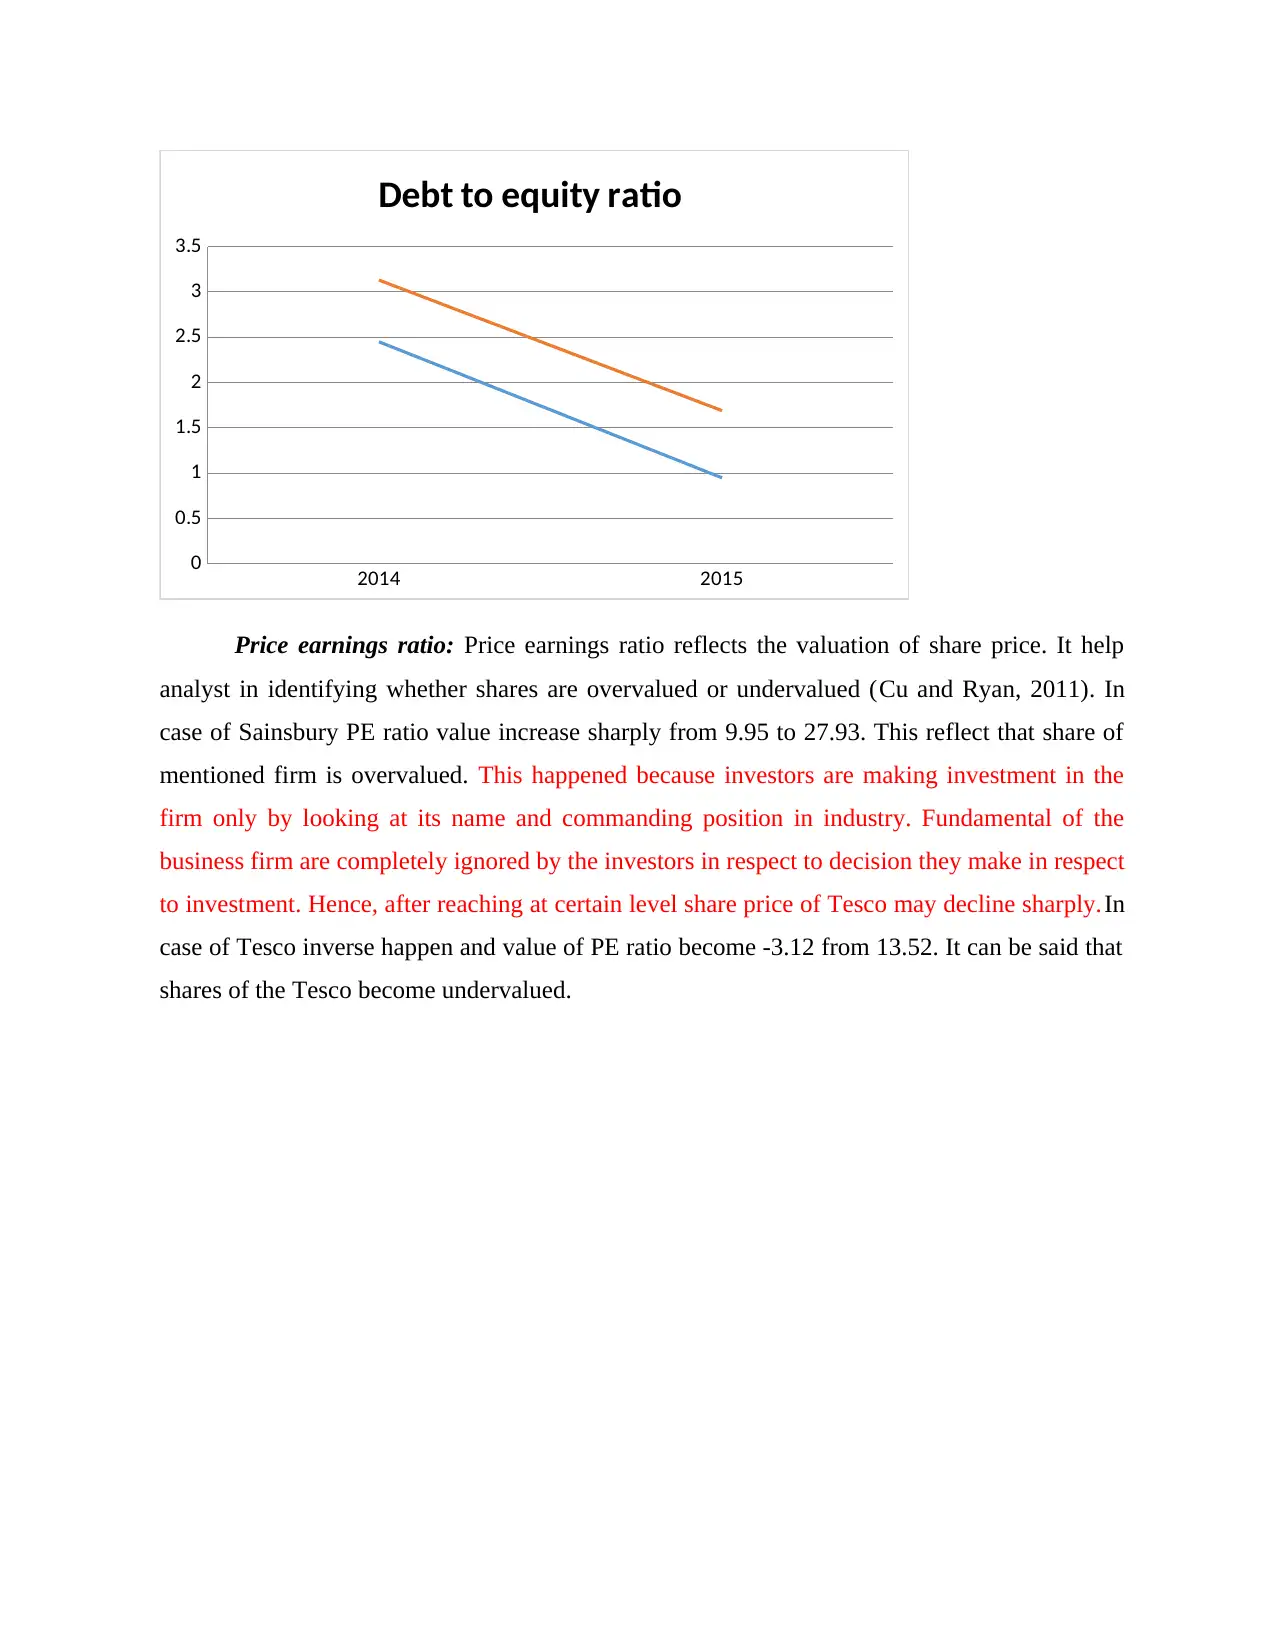
Debt equity ratio: Debt equity ratio reflects the proportion of debt and equity in the firm capital
structure. It can be seen that debt equity ratio of Sainsbury increases but value of same is very
low (Guo and et.al.,2010). On other hand, in case of Tesco value of this ratio sharply increase
from0.63 to 1.51. This happened because firm is facing problem of shortage of cash in its
business. Hence, in order to meet its finance need firm take loan from market?Due to fast
elevation in debt amount in future finance cost burden will increase on Tesco. In case of
Sainsbury capital structure is imbalanced which is not good for the business. It can be said that
Tesco is in better condition than Sainsbury
Elevation in direct expenses lead to earning of less profit in the business in the relevant fiscal
year. It is clear from this comparison that again Sainsbury is better condition than Tesco. It is
clear that Sainsbury is earning profit in the business while Morrison is facing loss in its
business. This happened because Tesco failed to control elevation in its direct expenses which is
related to the products it used to purchase from the suppliers. It is also clear the firm needs to
devise appropriate cost control strategy in its business. Moreover, it needs to ensure that
products are purchased from the suppliers at very low price.
2014 2015
0%
1%
2%
3%
4%
5%
6%
7%
8%
9%
Gross profit ratio
Figure 4 Gross profit ratio of Sainsbury and Tesco
Debt equity ratio: Debt equity ratio reflects the proportion of debt and equity in the firm capital
structure. It can be seen that debt equity ratio of Sainsbury increases but value of same is very
low (Guo and et.al.,2010). On other hand, in case of Tesco value of this ratio sharply increase
from0.63 to 1.51. This happened because firm is facing problem of shortage of cash in its
business. Hence, in order to meet its finance need firm take loan from market?Due to fast
elevation in debt amount in future finance cost burden will increase on Tesco. In case of
Sainsbury capital structure is imbalanced which is not good for the business. It can be said that
Tesco is in better condition than Sainsbury
⊘ This is a preview!⊘
Do you want full access?
Subscribe today to unlock all pages.
Trusted by 1+ million students worldwide
2014 2015
0
0.5
1
1.5
2
2.5
3
3.5
Debt to equity ratio
Price earnings ratio: Price earnings ratio reflects the valuation of share price. It help
analyst in identifying whether shares are overvalued or undervalued (Cu and Ryan, 2011). In
case of Sainsbury PE ratio value increase sharply from 9.95 to 27.93. This reflect that share of
mentioned firm is overvalued. This happened because investors are making investment in the
firm only by looking at its name and commanding position in industry. Fundamental of the
business firm are completely ignored by the investors in respect to decision they make in respect
to investment. Hence, after reaching at certain level share price of Tesco may decline sharply.In
case of Tesco inverse happen and value of PE ratio become -3.12 from 13.52. It can be said that
shares of the Tesco become undervalued.
Paraphrase This Document
Need a fresh take? Get an instant paraphrase of this document with our AI Paraphraser
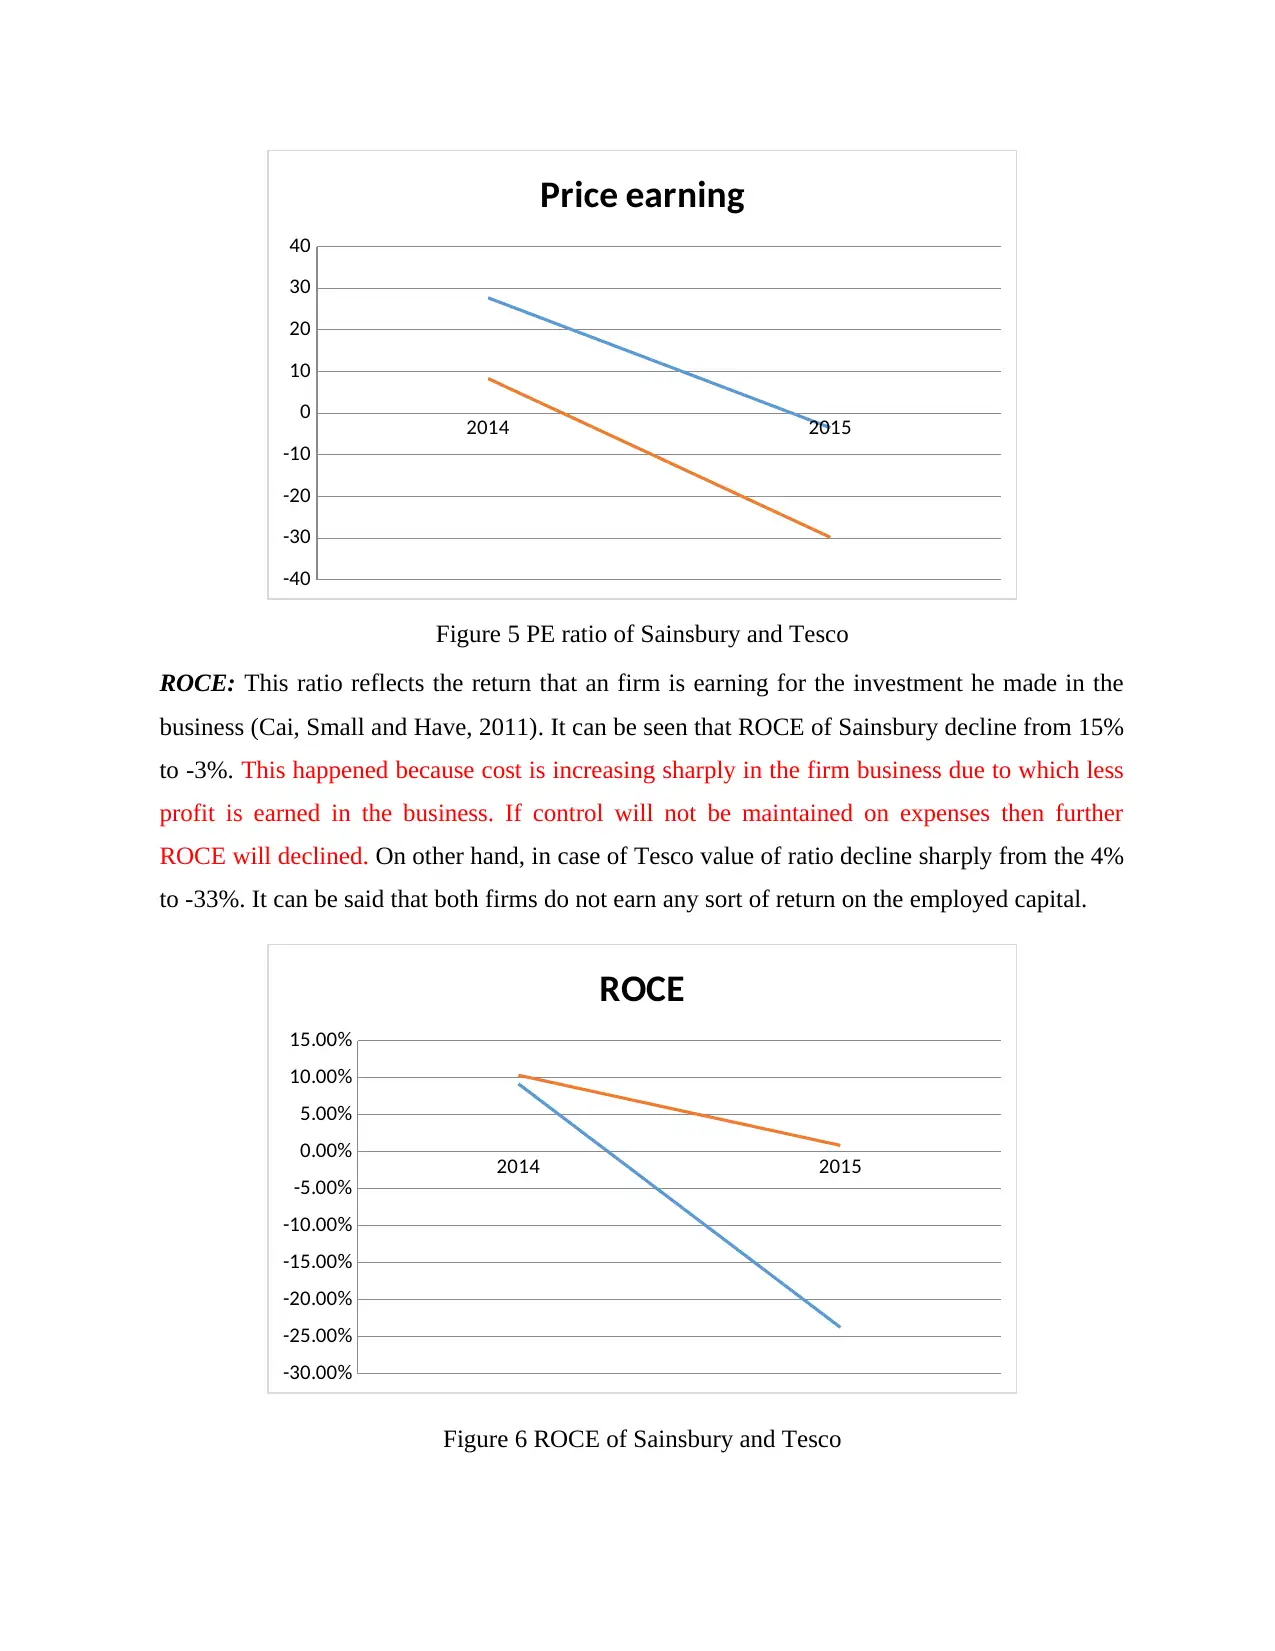
2014 2015
-40
-30
-20
-10
0
10
20
30
40
Price earning
Figure 5 PE ratio of Sainsbury and Tesco
ROCE: This ratio reflects the return that an firm is earning for the investment he made in the
business (Cai, Small and Have, 2011). It can be seen that ROCE of Sainsbury decline from 15%
to -3%. This happened because cost is increasing sharply in the firm business due to which less
profit is earned in the business. If control will not be maintained on expenses then further
ROCE will declined. On other hand, in case of Tesco value of ratio decline sharply from the 4%
to -33%. It can be said that both firms do not earn any sort of return on the employed capital.
2014 2015
-30.00%
-25.00%
-20.00%
-15.00%
-10.00%
-5.00%
0.00%
5.00%
10.00%
15.00%
ROCE
Figure 6 ROCE of Sainsbury and Tesco
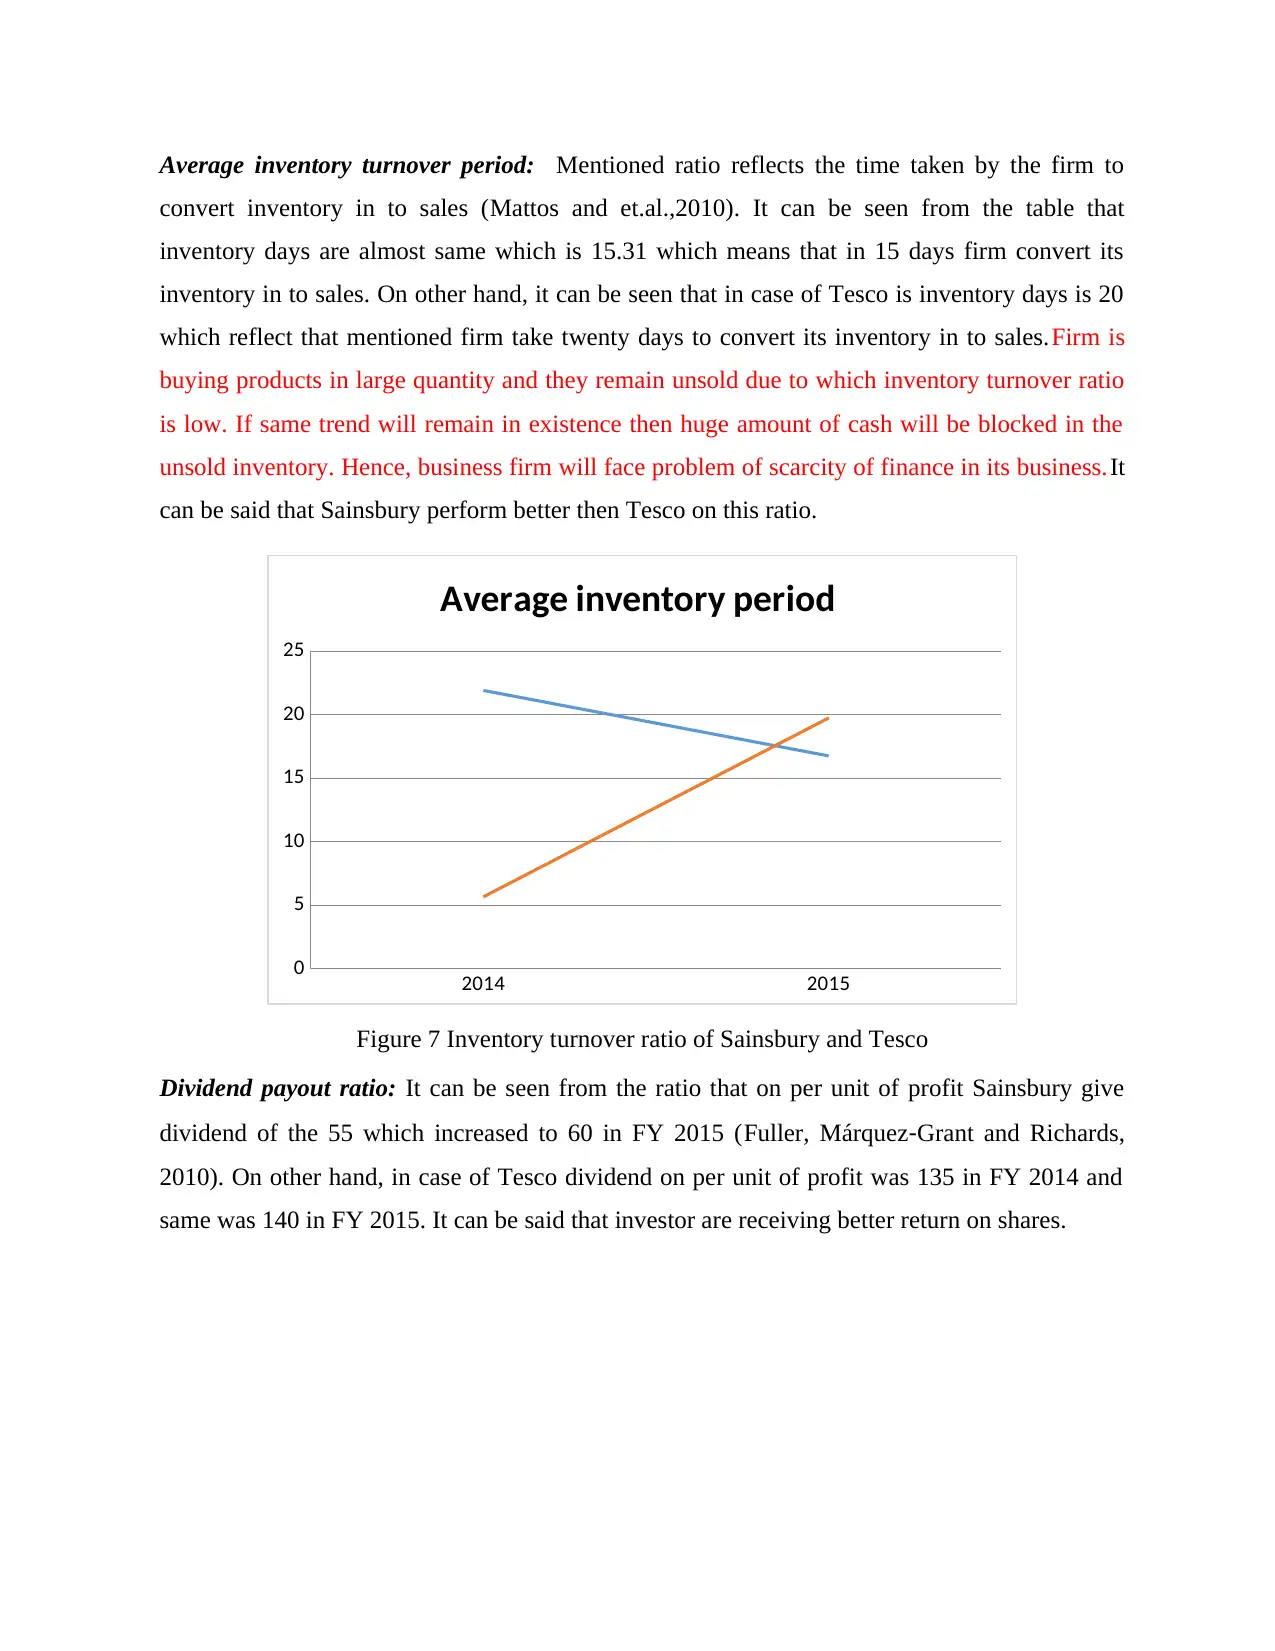
Average inventory turnover period: Mentioned ratio reflects the time taken by the firm to
convert inventory in to sales (Mattos and et.al.,2010). It can be seen from the table that
inventory days are almost same which is 15.31 which means that in 15 days firm convert its
inventory in to sales. On other hand, it can be seen that in case of Tesco is inventory days is 20
which reflect that mentioned firm take twenty days to convert its inventory in to sales.Firm is
buying products in large quantity and they remain unsold due to which inventory turnover ratio
is low. If same trend will remain in existence then huge amount of cash will be blocked in the
unsold inventory. Hence, business firm will face problem of scarcity of finance in its business.It
can be said that Sainsbury perform better then Tesco on this ratio.
2014 2015
0
5
10
15
20
25
Average inventory period
Figure 7 Inventory turnover ratio of Sainsbury and Tesco
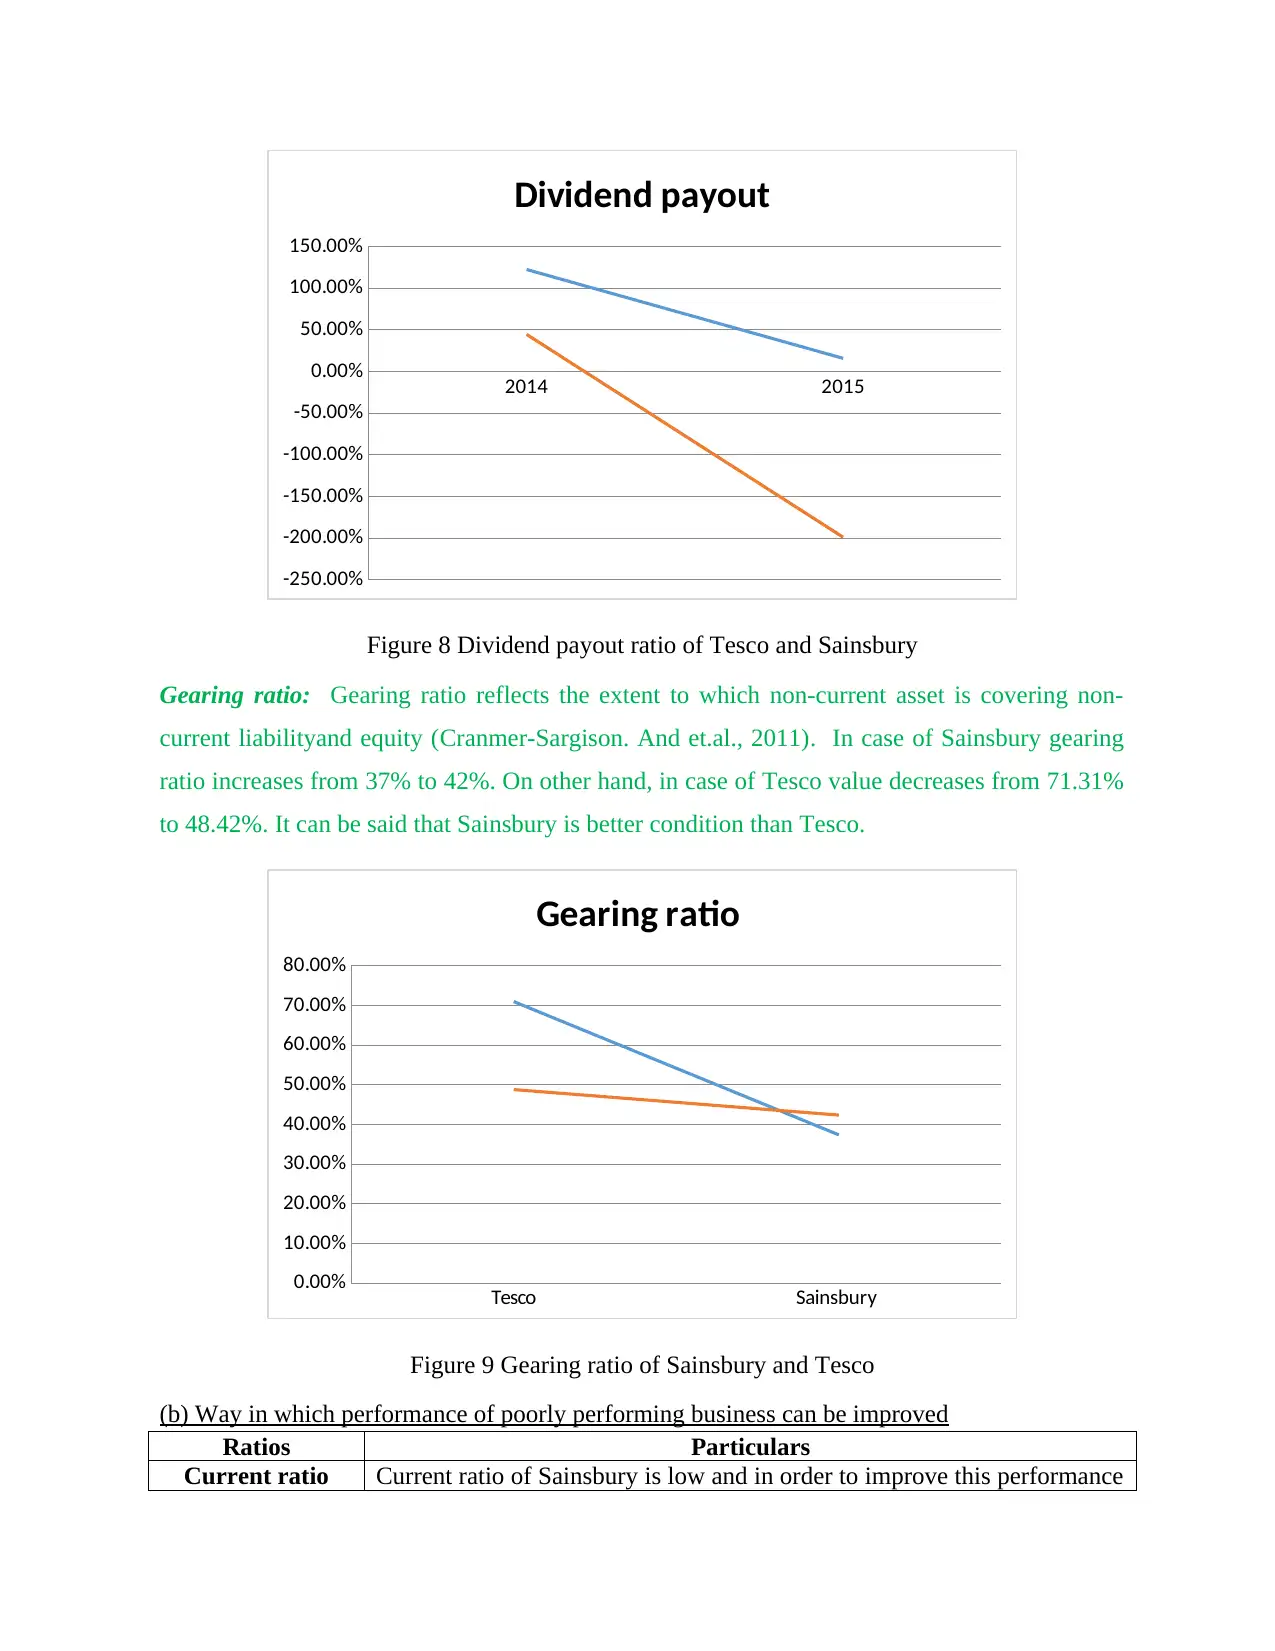
Dividend payout ratio: It can be seen from the ratio that on per unit of profit Sainsbury give
dividend of the 55 which increased to 60 in FY 2015 (Fuller, Márquez‐Grant and Richards,
2010). On other hand, in case of Tesco dividend on per unit of profit was 135 in FY 2014 and
same was 140 in FY 2015. It can be said that investor are receiving better return on shares.
convert inventory in to sales (Mattos and et.al.,2010). It can be seen from the table that
inventory days are almost same which is 15.31 which means that in 15 days firm convert its
inventory in to sales. On other hand, it can be seen that in case of Tesco is inventory days is 20
which reflect that mentioned firm take twenty days to convert its inventory in to sales.Firm is
buying products in large quantity and they remain unsold due to which inventory turnover ratio
is low. If same trend will remain in existence then huge amount of cash will be blocked in the
unsold inventory. Hence, business firm will face problem of scarcity of finance in its business.It
can be said that Sainsbury perform better then Tesco on this ratio.
2014 2015
0
5
10
15
20
25
Average inventory period
Figure 7 Inventory turnover ratio of Sainsbury and Tesco
Dividend payout ratio: It can be seen from the ratio that on per unit of profit Sainsbury give
dividend of the 55 which increased to 60 in FY 2015 (Fuller, Márquez‐Grant and Richards,
2010). On other hand, in case of Tesco dividend on per unit of profit was 135 in FY 2014 and
same was 140 in FY 2015. It can be said that investor are receiving better return on shares.
⊘ This is a preview!⊘
Do you want full access?
Subscribe today to unlock all pages.
Trusted by 1+ million students worldwide
2014 2015
-250.00%
-200.00%
-150.00%
-100.00%
-50.00%
0.00%
50.00%
100.00%
150.00%
Dividend payout
Figure 8 Dividend payout ratio of Tesco and Sainsbury
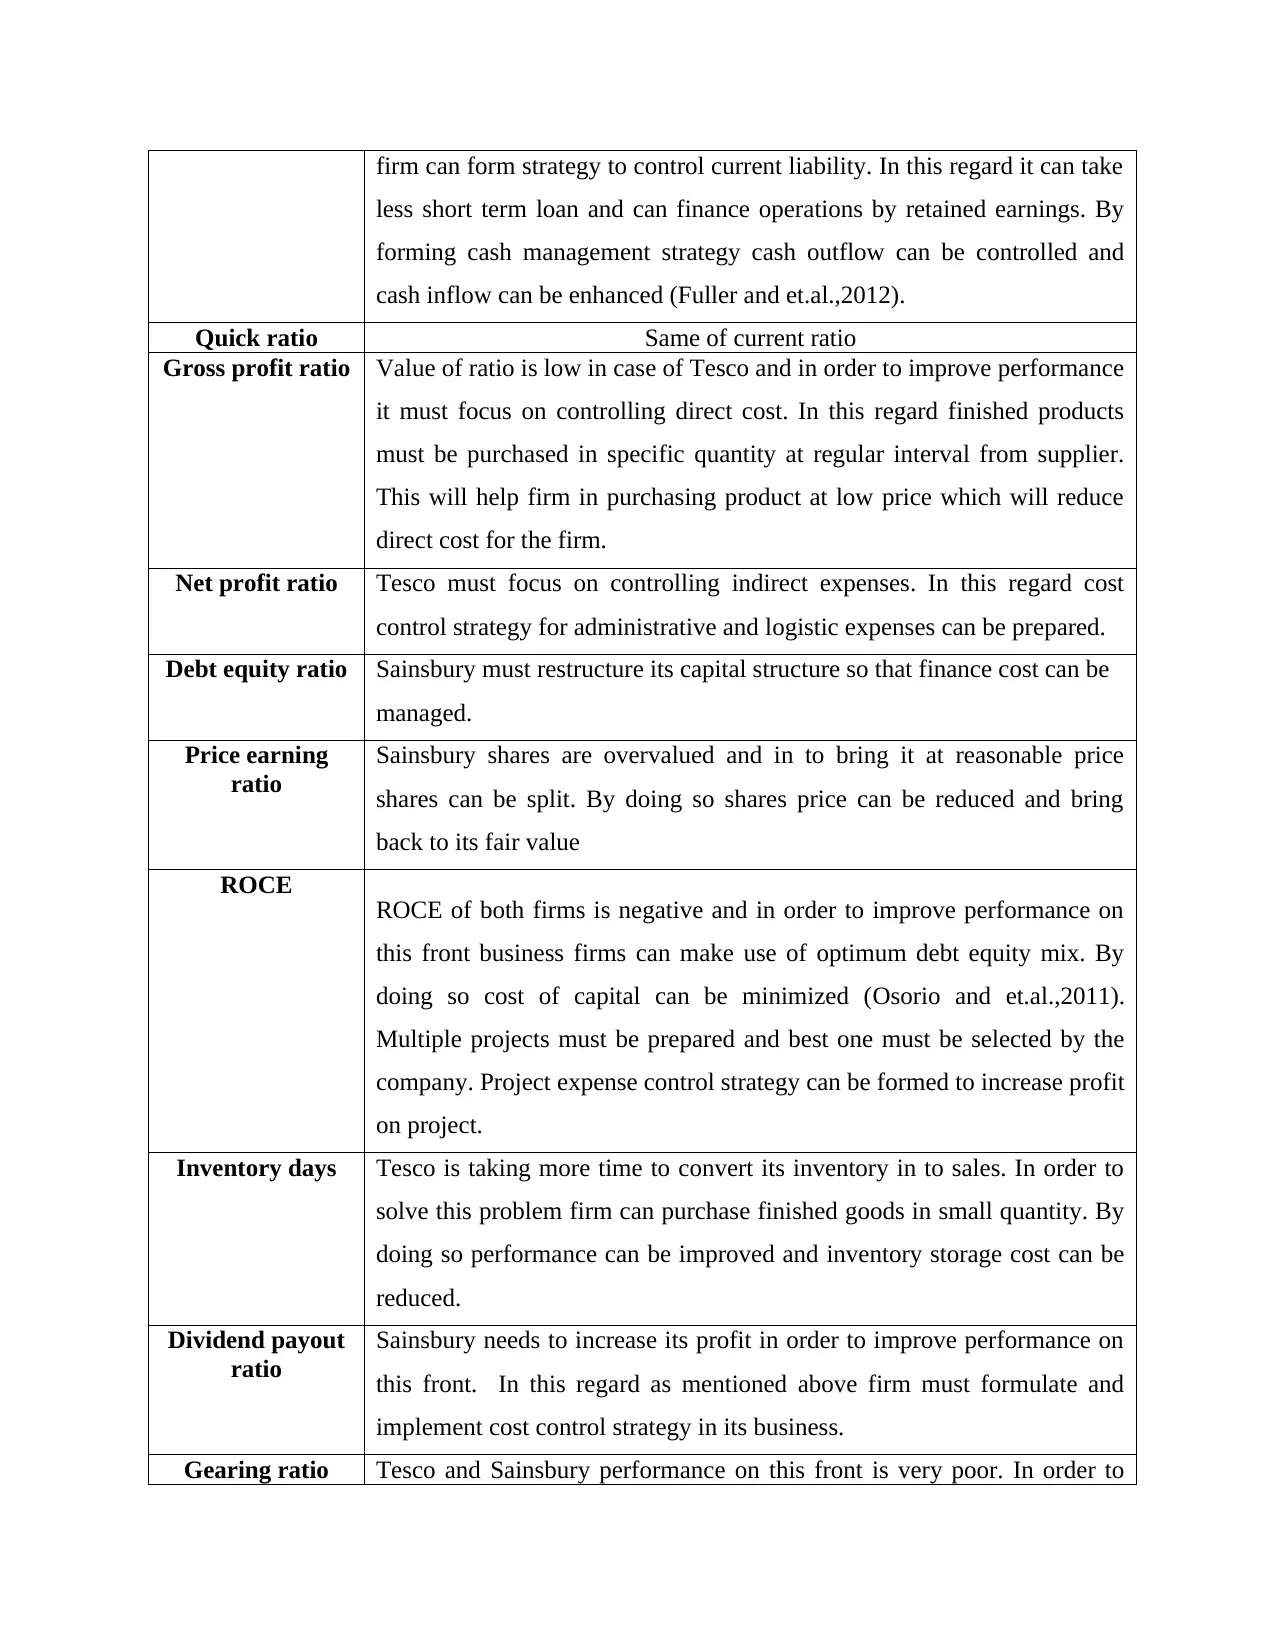
Gearing ratio: Gearing ratio reflects the extent to which non-current asset is covering non-
current liabilityand equity (Cranmer-Sargison. And et.al., 2011). In case of Sainsbury gearing
ratio increases from 37% to 42%. On other hand, in case of Tesco value decreases from 71.31%
to 48.42%. It can be said that Sainsbury is better condition than Tesco.
Tesco Sainsbury
0.00%
10.00%
20.00%
30.00%
40.00%
50.00%
60.00%
70.00%
80.00%
Gearing ratio
Figure 9 Gearing ratio of Sainsbury and Tesco
(b) Way in which performance of poorly performing business can be improved
Ratios Particulars
Current ratio Current ratio of Sainsbury is low and in order to improve this performance
-250.00%
-200.00%
-150.00%
-100.00%
-50.00%
0.00%
50.00%
100.00%
150.00%
Dividend payout
Figure 8 Dividend payout ratio of Tesco and Sainsbury
Gearing ratio: Gearing ratio reflects the extent to which non-current asset is covering non-
current liabilityand equity (Cranmer-Sargison. And et.al., 2011). In case of Sainsbury gearing
ratio increases from 37% to 42%. On other hand, in case of Tesco value decreases from 71.31%
to 48.42%. It can be said that Sainsbury is better condition than Tesco.
Tesco Sainsbury
0.00%
10.00%
20.00%
30.00%
40.00%
50.00%
60.00%
70.00%
80.00%
Gearing ratio
Figure 9 Gearing ratio of Sainsbury and Tesco
(b) Way in which performance of poorly performing business can be improved
Ratios Particulars
Current ratio Current ratio of Sainsbury is low and in order to improve this performance
Paraphrase This Document
Need a fresh take? Get an instant paraphrase of this document with our AI Paraphraser
firm can form strategy to control current liability. In this regard it can take
less short term loan and can finance operations by retained earnings. By
forming cash management strategy cash outflow can be controlled and
cash inflow can be enhanced (Fuller and et.al.,2012).
Quick ratio Same of current ratio
Gross profit ratio Value of ratio is low in case of Tesco and in order to improve performance
it must focus on controlling direct cost. In this regard finished products
must be purchased in specific quantity at regular interval from supplier.
This will help firm in purchasing product at low price which will reduce
direct cost for the firm.
Net profit ratio Tesco must focus on controlling indirect expenses. In this regard cost
control strategy for administrative and logistic expenses can be prepared.
Debt equity ratio Sainsbury must restructure its capital structure so that finance cost can be
managed.
Price earning
ratio
Sainsbury shares are overvalued and in to bring it at reasonable price
shares can be split. By doing so shares price can be reduced and bring
back to its fair value
ROCE ROCE of both firms is negative and in order to improve performance on
this front business firms can make use of optimum debt equity mix. By
doing so cost of capital can be minimized (Osorio and et.al.,2011).
Multiple projects must be prepared and best one must be selected by the
company. Project expense control strategy can be formed to increase profit
on project.
Inventory days Tesco is taking more time to convert its inventory in to sales. In order to
solve this problem firm can purchase finished goods in small quantity. By
doing so performance can be improved and inventory storage cost can be
reduced.
Dividend payout
ratio
Sainsbury needs to increase its profit in order to improve performance on
this front. In this regard as mentioned above firm must formulate and
implement cost control strategy in its business.
Gearing ratio Tesco and Sainsbury performance on this front is very poor. In order to
improve performance on this front firm must try to reduce its finance cost.
Cost control strategy must be formulated in order to increase EBIT in the
business.
© Limitation of relying on ratios to measure firm performance
There is very big limitation of relying on ratios to measure firm financial performance.
For current ratio standard value is 2:1 which means that for every one unit of current liability
there must be two units of the current asset. When economy is in recession it is not possible to
maintain this standard (Mattos and et.al.,2010). This is because at that time cash outflow takes
place at rapid pace and cash inflow happen in the business at low rate. But whenever manager
will measure firm performance he will use standard value 2:1 in order to find out whether firm
liquidity position is good or bad. Same thing applied on other ratios. It can be said that one
cannot rely entirely on the ratios to measure firm performance.The other limitations of ratio
analysis method is that ratios are based on historical figures. It is not necessary that past will
repeat in future. Hence, results generated by ratios are not highly reliable. Ratio analysis
formula does not consider inflation. Hence, accurate performance of the firm cannot be
measured by using ratio analysis. Ratios results can be manipulated easily. Hence, due to this
reason results of ratios are not highly reliable.
Portfolio 2
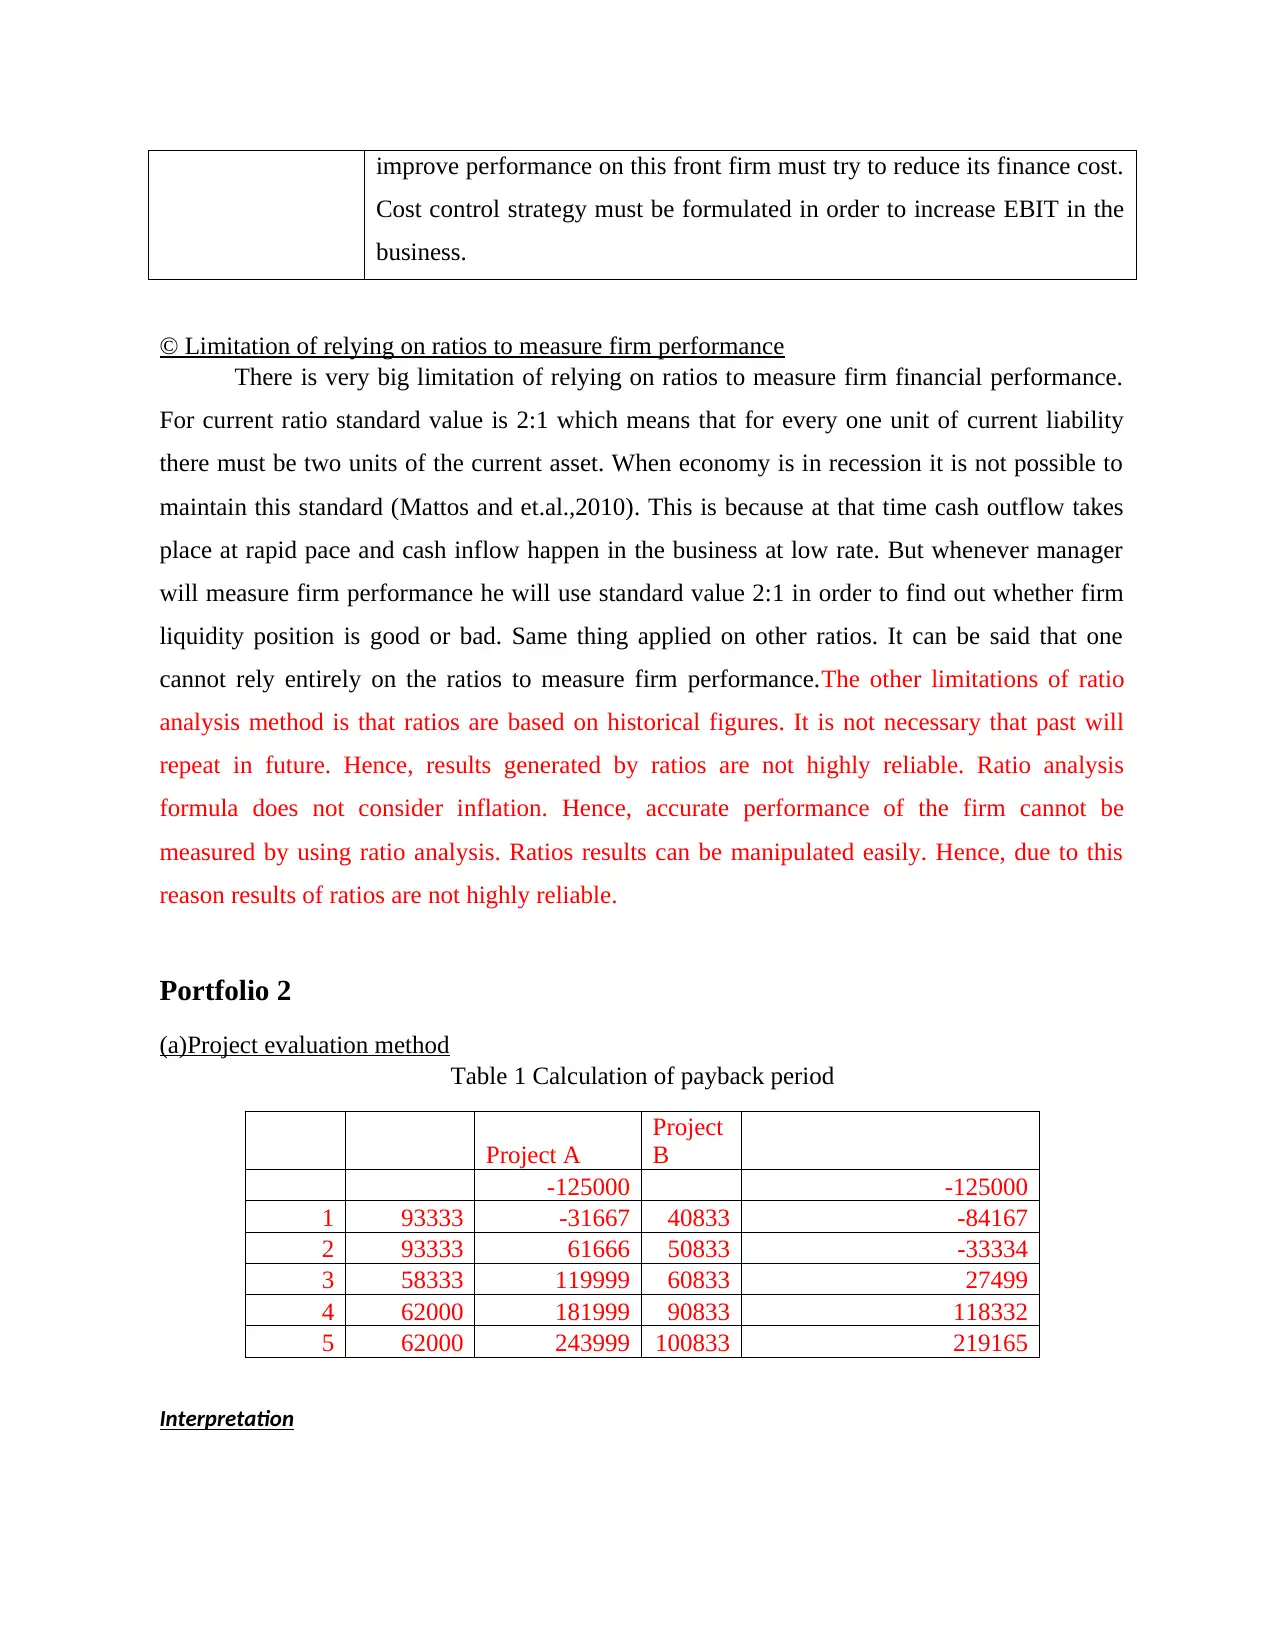
(a)Project evaluation method
Table 1 Calculation of payback period
Project A
Project
B
-125000 -125000
1 93333 -31667 40833 -84167
2 93333 61666 50833 -33334
3 58333 119999 60833 27499
4 62000 181999 90833 118332
5 62000 243999 100833 219165
Interpretation
Cost control strategy must be formulated in order to increase EBIT in the
business.
© Limitation of relying on ratios to measure firm performance
There is very big limitation of relying on ratios to measure firm financial performance.
For current ratio standard value is 2:1 which means that for every one unit of current liability
there must be two units of the current asset. When economy is in recession it is not possible to
maintain this standard (Mattos and et.al.,2010). This is because at that time cash outflow takes
place at rapid pace and cash inflow happen in the business at low rate. But whenever manager
will measure firm performance he will use standard value 2:1 in order to find out whether firm
liquidity position is good or bad. Same thing applied on other ratios. It can be said that one
cannot rely entirely on the ratios to measure firm performance.The other limitations of ratio
analysis method is that ratios are based on historical figures. It is not necessary that past will
repeat in future. Hence, results generated by ratios are not highly reliable. Ratio analysis
formula does not consider inflation. Hence, accurate performance of the firm cannot be
measured by using ratio analysis. Ratios results can be manipulated easily. Hence, due to this
reason results of ratios are not highly reliable.
Portfolio 2
(a)Project evaluation method
Table 1 Calculation of payback period
Project A
Project
B
-125000 -125000
1 93333 -31667 40833 -84167
2 93333 61666 50833 -33334
3 58333 119999 60833 27499
4 62000 181999 90833 118332
5 62000 243999 100833 219165
Interpretation
⊘ This is a preview!⊘
Do you want full access?
Subscribe today to unlock all pages.
Trusted by 1+ million students worldwide
1 out of 20
Related Documents


Your All-in-One AI-Powered Toolkit for Academic Success.
+13062052269
info@desklib.com
Available 24*7 on WhatsApp / Email
![[object Object]](/_next/static/media/star-bottom.7253800d.svg)
Unlock your academic potential
Copyright © 2020–2026 A2Z Services. All Rights Reserved. Developed and managed by ZUCOL.