Financial Ratio Analysis of Sports Direct vs JD Sports Fashion

Verified

Added on  2023/01/11

|27
|4025
|26
Report
AI Summary
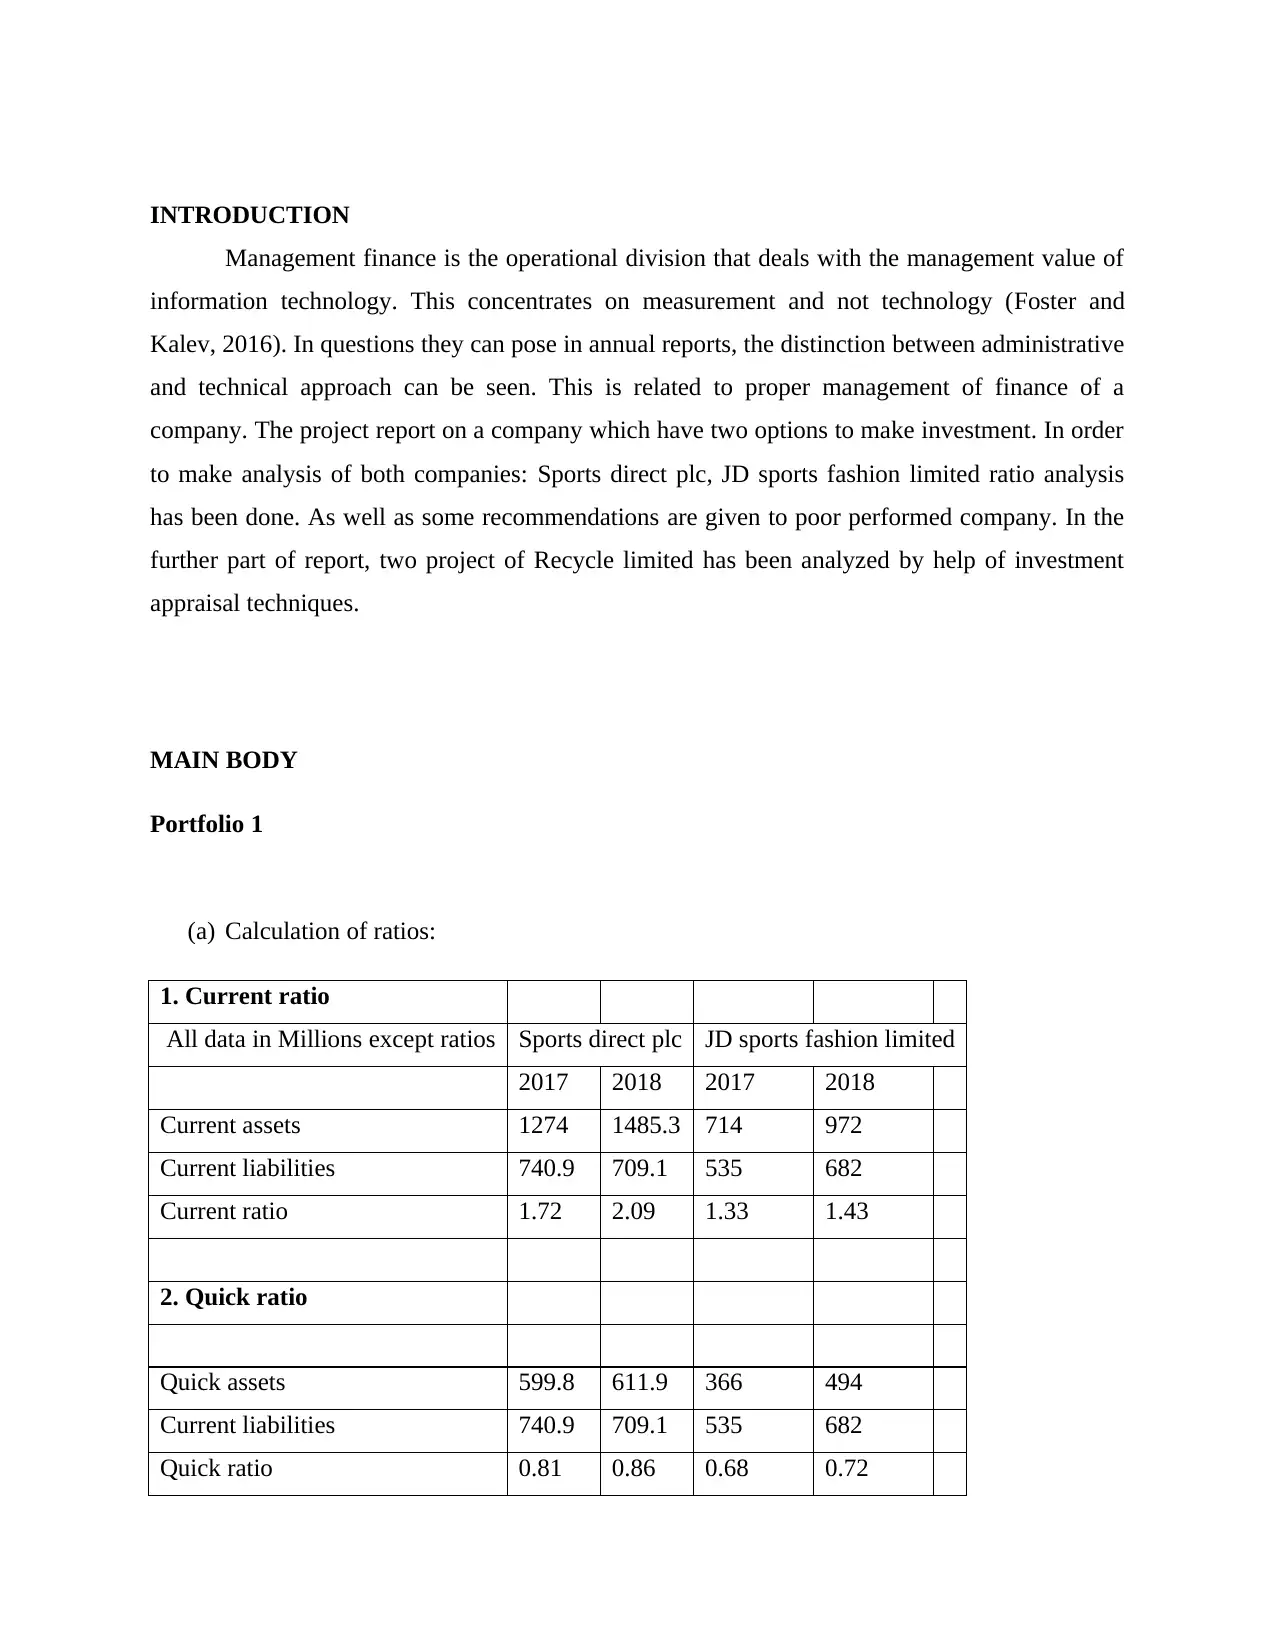
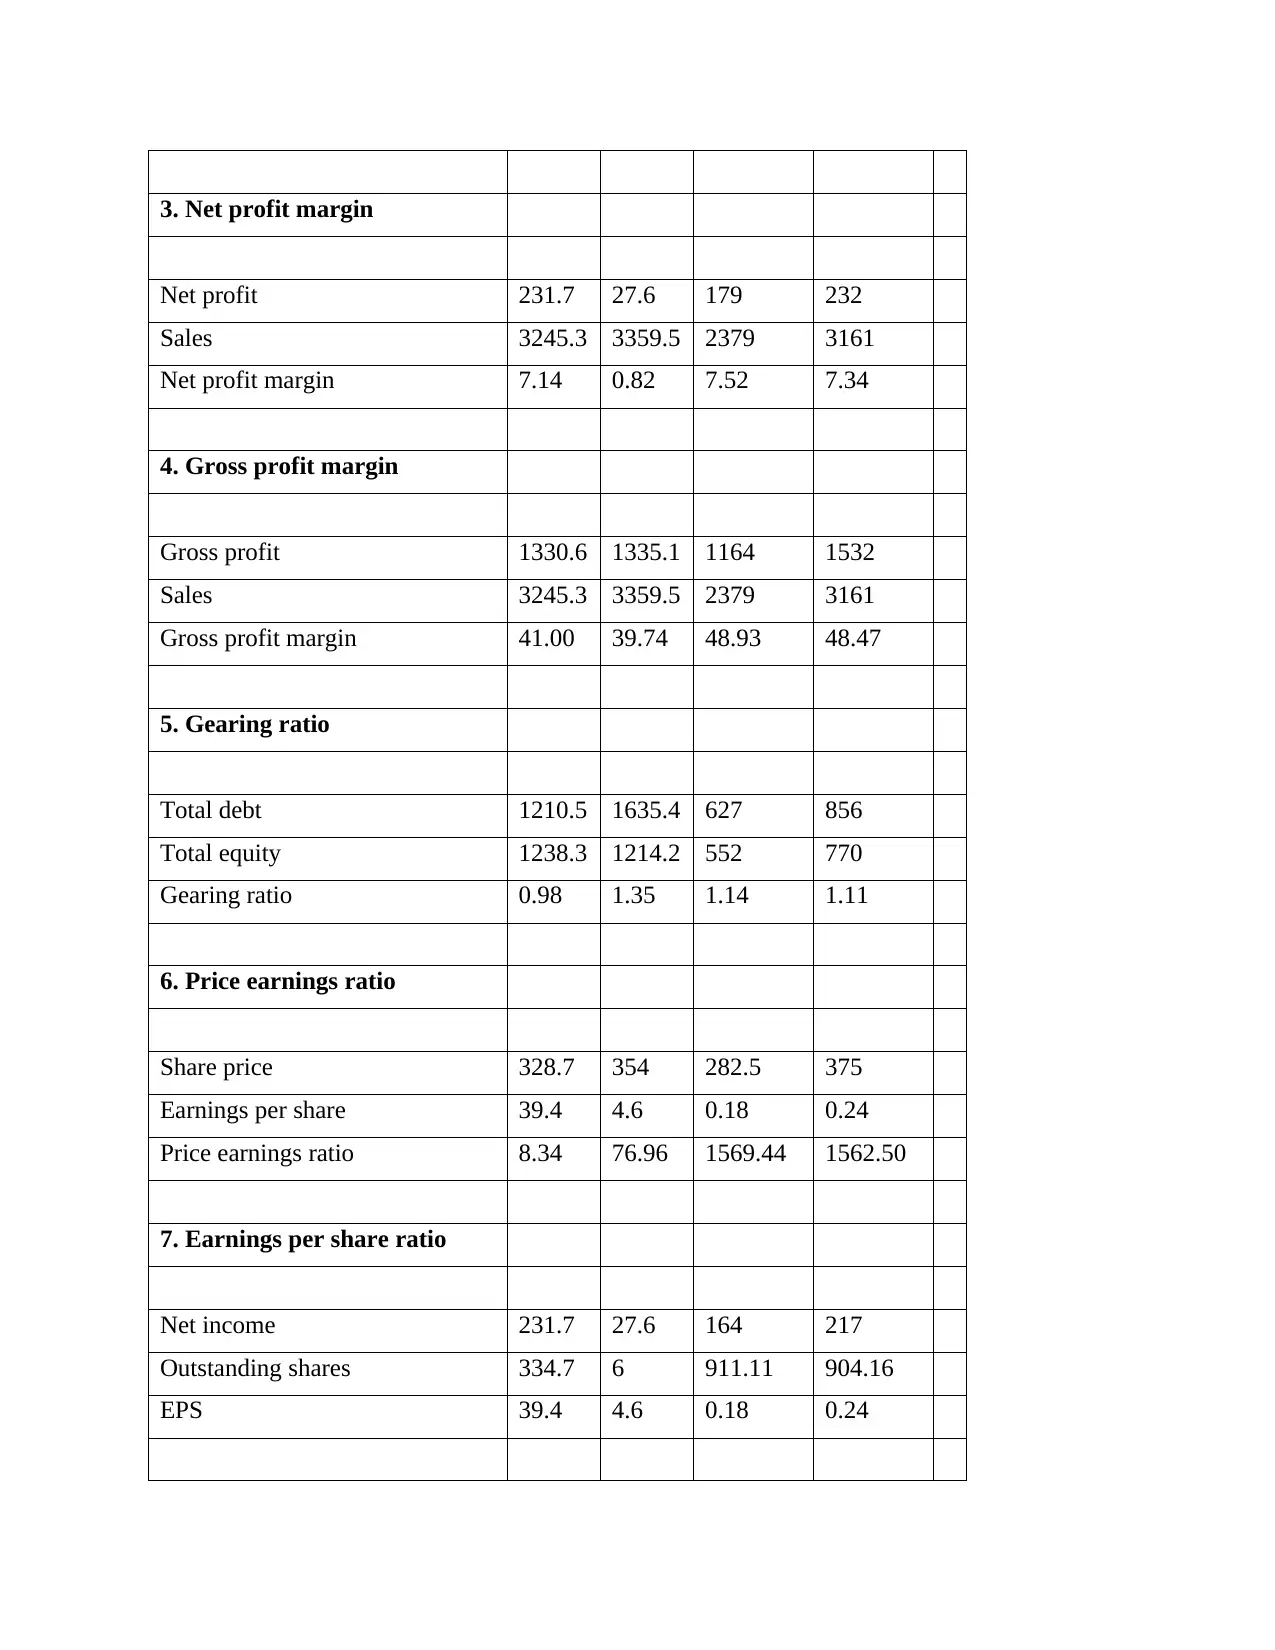
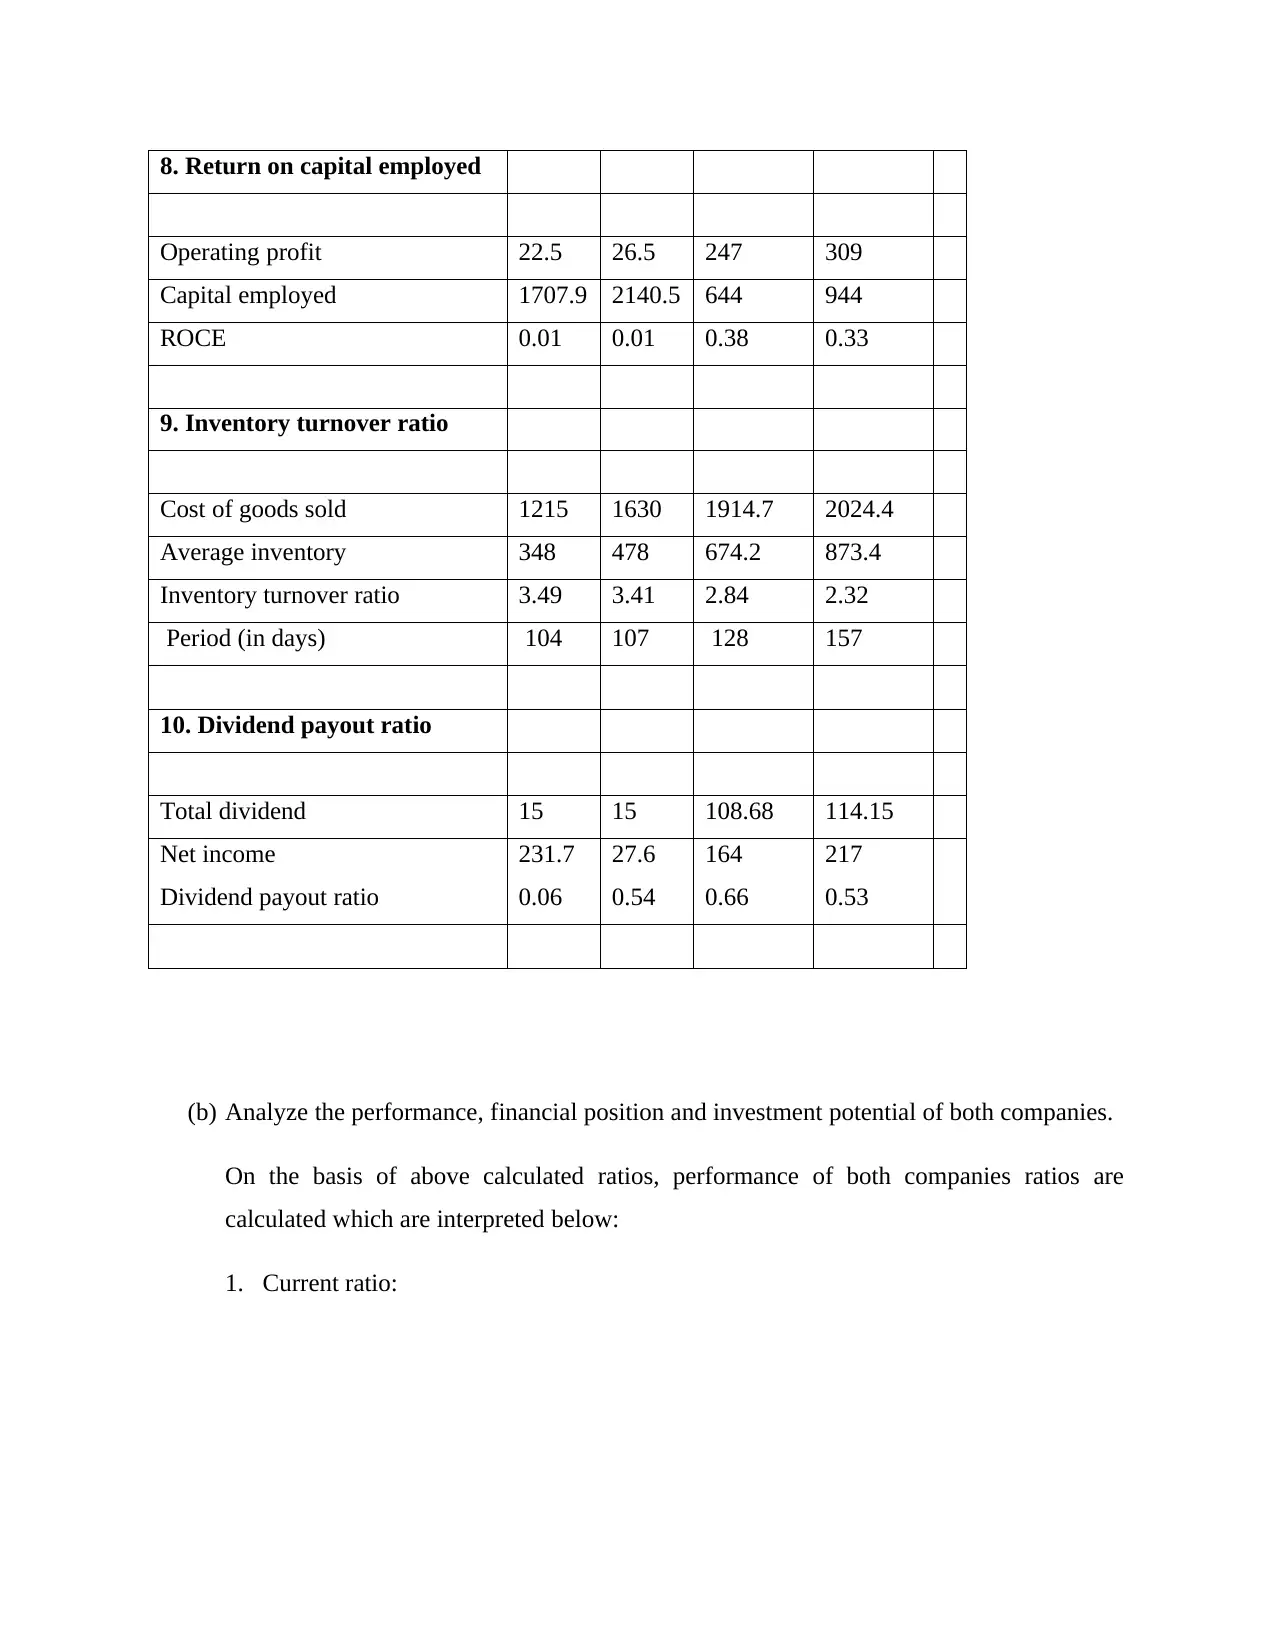
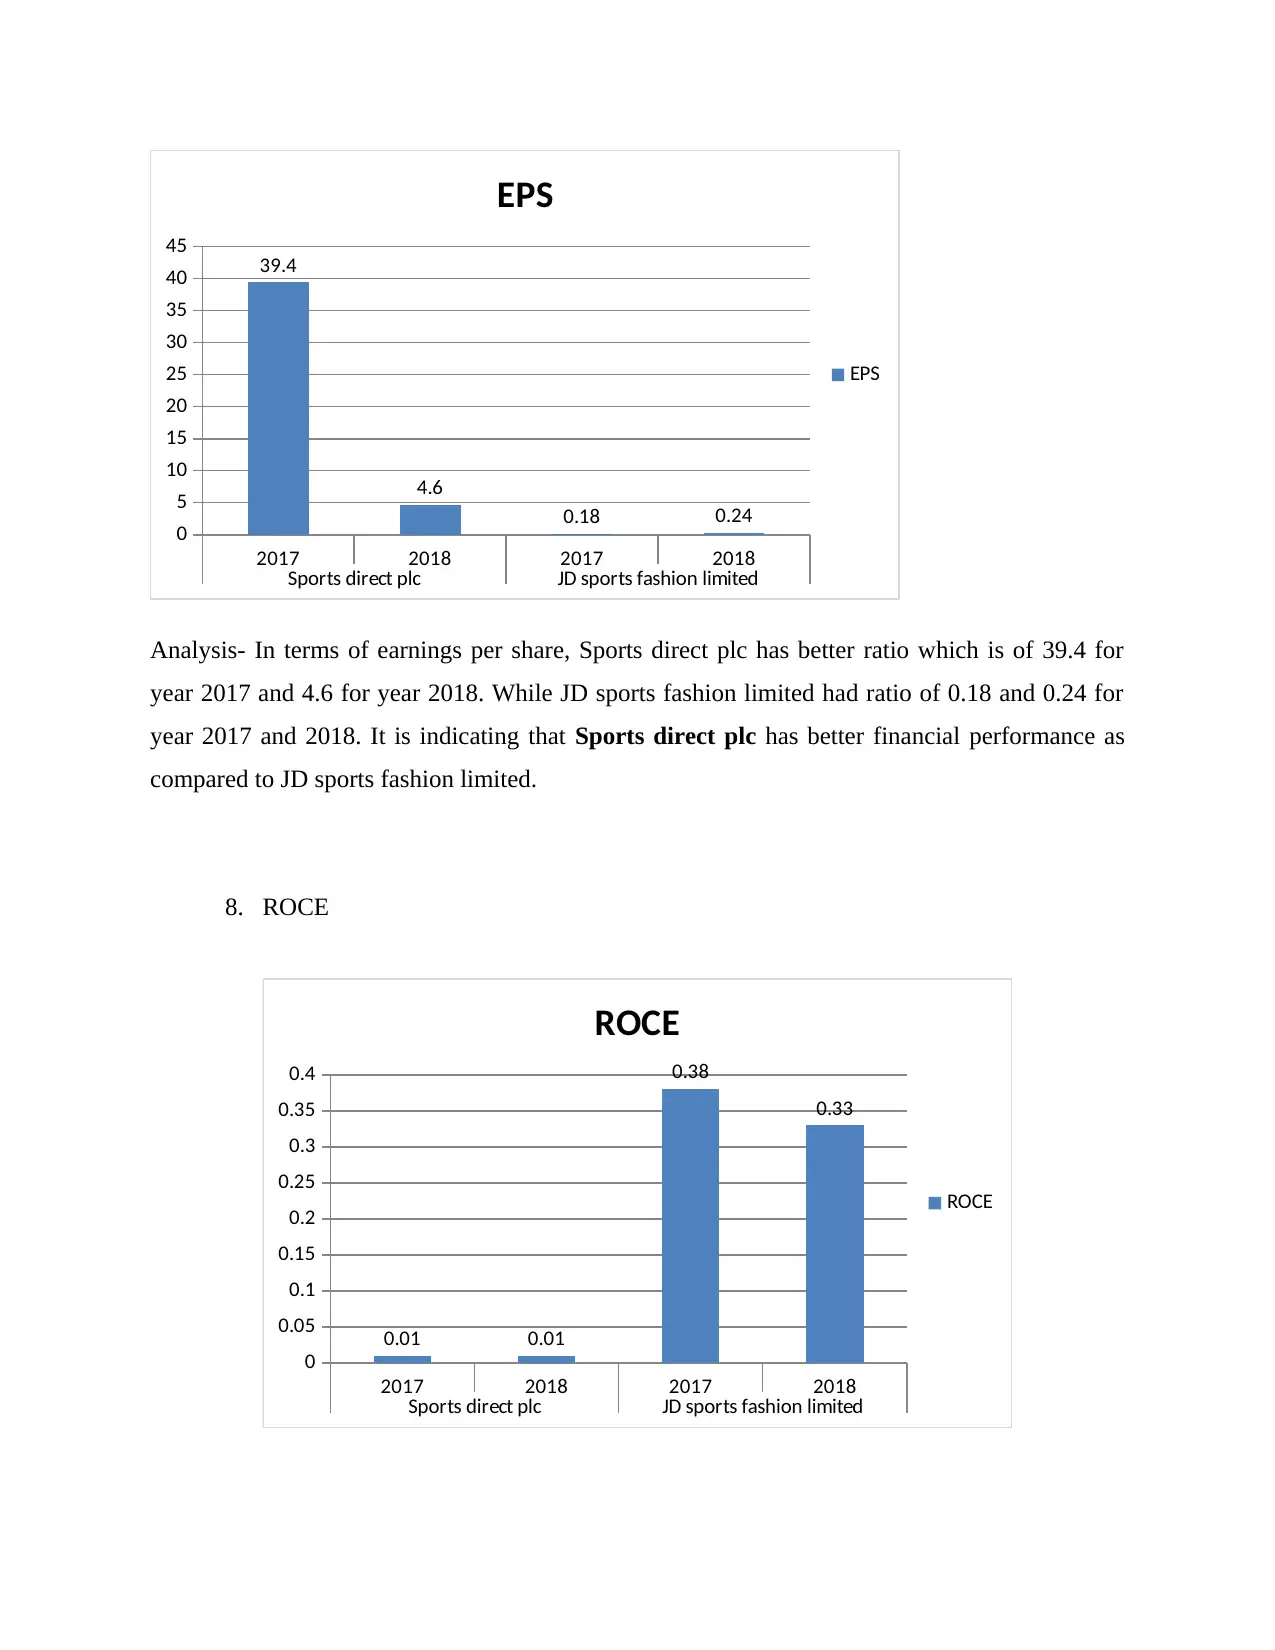
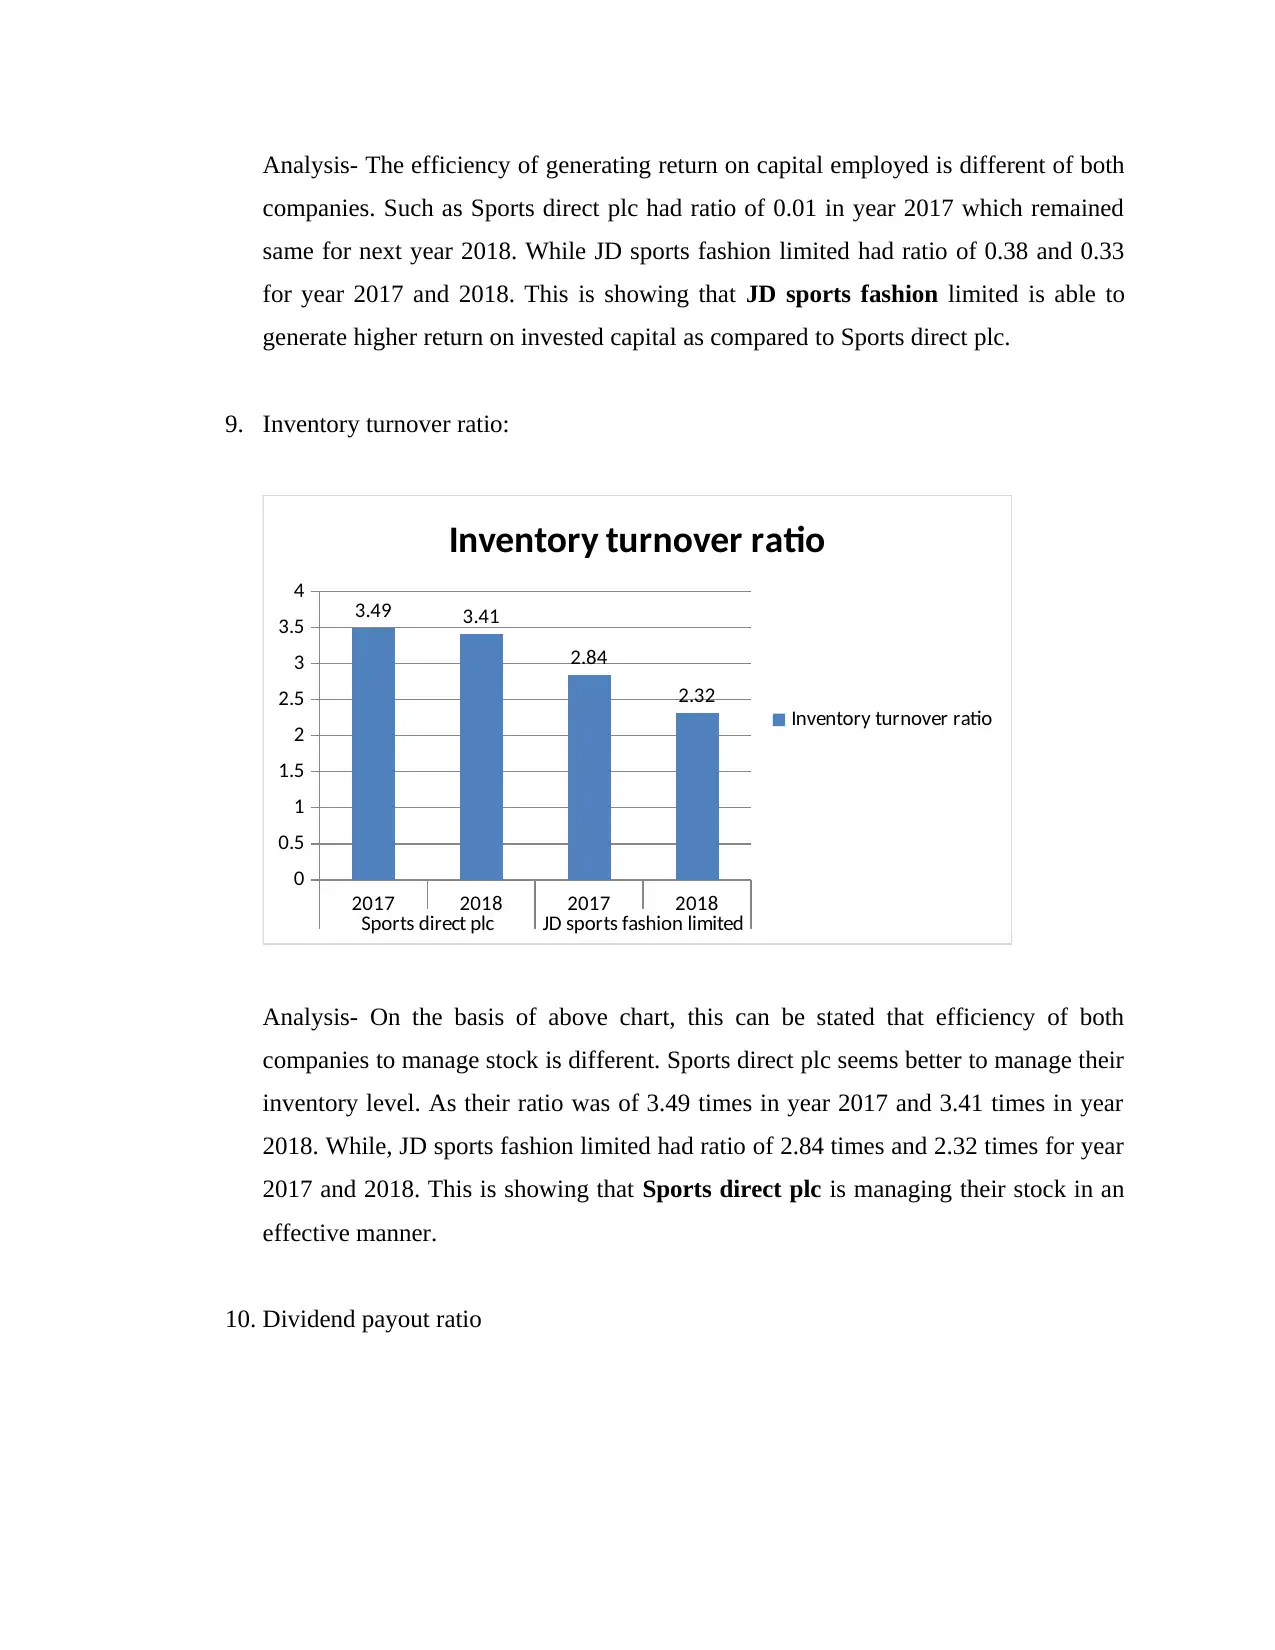
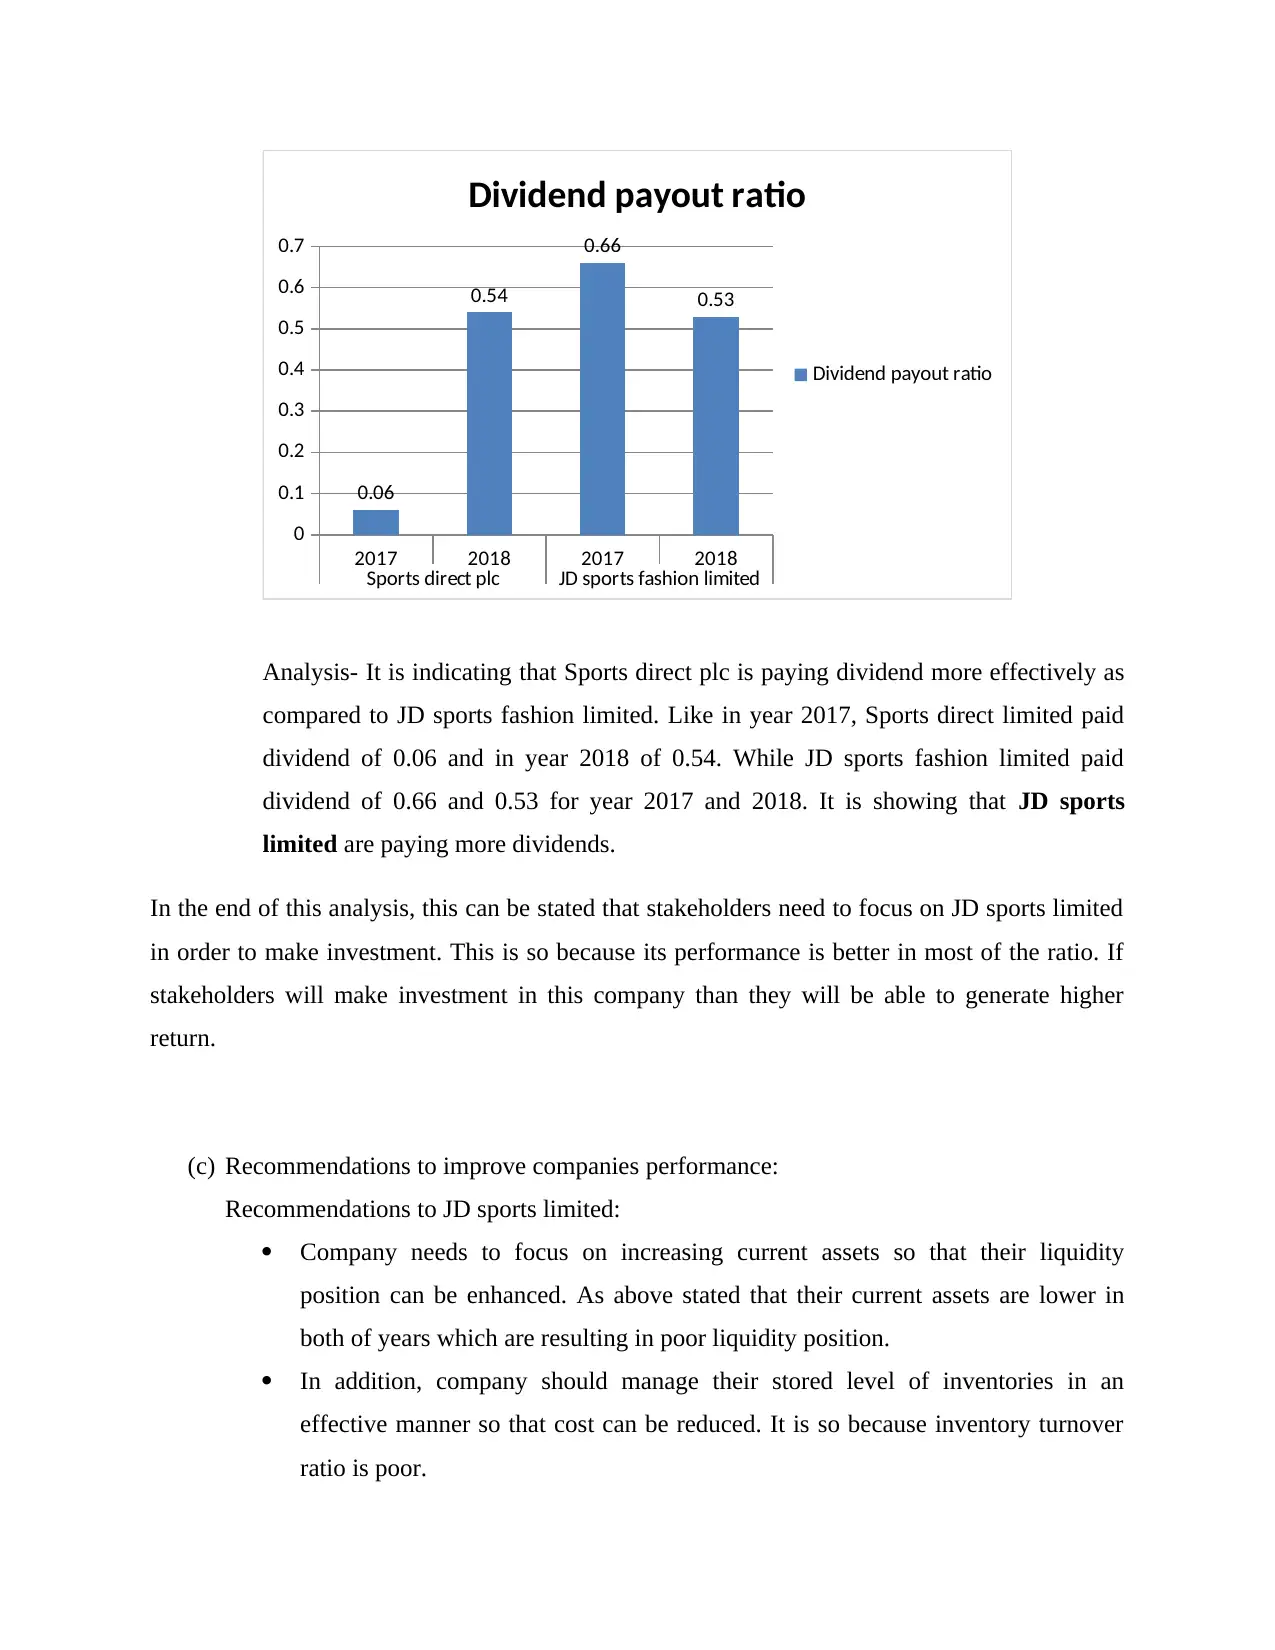
This report presents a comprehensive financial analysis of Sports Direct plc and JD Sports Fashion Limited, focusing on their performance, financial position, and investment potential. The analysis employs various financial ratios, including current ratio, quick ratio, net profit margin, gross profit margin, gearing ratio, price-earnings ratio, earnings per share, return on capital employed, inventory turnover ratio, and dividend payout ratio. The report compares the two companies across these metrics for the years 2017 and 2018, highlighting their strengths and weaknesses. Recommendations are provided to improve the performance of each company, focusing on enhancing profitability, managing inventory, and optimizing share value. Additionally, the report discusses the limitations of relying solely on financial ratios for interpreting a company's performance, considering factors like historical data, inflation, accounting policy changes, and potential financial statement manipulation. The conclusion emphasizes the importance of a holistic approach to financial analysis, considering both quantitative and qualitative factors.
Document Page
MANAGERIAL FINANCE
tabler-icon-diamond-filled.svg

Paraphrase This Document

Need a fresh take? Get an instant paraphrase of this document with our AI Paraphraser
Document Page
Contents
INTRODUCTION.......................................................................................................................................3
MAIN BODY..............................................................................................................................................3
Portfolio 1................................................................................................................................................3
Portfolio 2..............................................................................................................................................14
CONCLUSION.........................................................................................................................................25
REFERENCES..........................................................................................................................................27
Document Page
INTRODUCTION
Management finance is the operational division that deals with the management value of
information technology. This concentrates on measurement and not technology (Foster and
Kalev, 2016). In questions they can pose in annual reports, the distinction between administrative
and technical approach can be seen. This is related to proper management of finance of a
company. The project report on a company which have two options to make investment. In order
to make analysis of both companies: Sports direct plc, JD sports fashion limited ratio analysis
has been done. As well as some recommendations are given to poor performed company. In the
further part of report, two project of Recycle limited has been analyzed by help of investment
appraisal techniques.
MAIN BODY
Portfolio 1
(a) Calculation of ratios:
1. Current ratio
All data in Millions except ratios Sports direct plc JD sports fashion limited
2017 2018 2017 2018
Current assets 1274 1485.3 714 972
Current liabilities 740.9 709.1 535 682
Current ratio 1.72 2.09 1.33 1.43
2. Quick ratio
Quick assets 599.8 611.9 366 494
Current liabilities 740.9 709.1 535 682
Quick ratio 0.81 0.86 0.68 0.72
Document Page
3. Net profit margin
Net profit 231.7 27.6 179 232
Sales 3245.3 3359.5 2379 3161
Net profit margin 7.14 0.82 7.52 7.34
4. Gross profit margin
Gross profit 1330.6 1335.1 1164 1532
Sales 3245.3 3359.5 2379 3161
Gross profit margin 41.00 39.74 48.93 48.47
5. Gearing ratio
Total debt 1210.5 1635.4 627 856
Total equity 1238.3 1214.2 552 770
Gearing ratio 0.98 1.35 1.14 1.11
6. Price earnings ratio
Share price 328.7 354 282.5 375
Earnings per share 39.4 4.6 0.18 0.24
Price earnings ratio 8.34 76.96 1569.44 1562.50
7. Earnings per share ratio
Net income 231.7 27.6 164 217
Outstanding shares 334.7 6 911.11 904.16
EPS 39.4 4.6 0.18 0.24
tabler-icon-diamond-filled.svg

Paraphrase This Document

Need a fresh take? Get an instant paraphrase of this document with our AI Paraphraser
Document Page
8. Return on capital employed
Operating profit 22.5 26.5 247 309
Capital employed 1707.9 2140.5 644 944
ROCE 0.01 0.01 0.38 0.33
9. Inventory turnover ratio
Cost of goods sold 1215 1630 1914.7 2024.4
Average inventory 348 478 674.2 873.4
Inventory turnover ratio 3.49 3.41 2.84 2.32
Period (in days) 104 107 128 157
10. Dividend payout ratio
Total dividend 15 15 108.68 114.15
Net income 231.7 27.6 164 217
Dividend payout ratio 0.06 0.54 0.66 0.53
(b) Analyze the performance, financial position and investment potential of both companies.
On the basis of above calculated ratios, performance of both companies ratios are
calculated which are interpreted below:
1. Current ratio:
Document Page
2017 2018 2017 2018
Sports direct plc JD sports fashion limited
0
0.5
1
1.5
2
2.5
1.72
2.09
1.33 1.43
Current ratio
Current ratio
Analysis- On the basis of above chart, this can be find out that both companies are
unable to meet ideal criteria of current ratio that is of 2:1 times. In year 2017,
company had current ratio of 1.72 times which raised and became of 2.09 times.
While JD sports fashion limited had ratio of 1.33 times and 1.43 times for year 2017
and 2018. It shows that Sports direct plc has better current ratio as compared to JD
sports fashion limited.
2. Quick ratio:
2017 2018 2017 2018
Sports direct plc JD sports fashion limited
0
0.1
0.2
0.3
0.4
0.5
0.6
0.7
0.8
0.9
1
0.81 0.86
0.68 0.72
Quick ratio
Quick ratio
Document Page
Analysis- On the basis of above chart, this can be find out that both companies are
unable to meet ideal criteria of quick ratio that is of 1.5:1 times. In year 2017, Sports
direct company had quick ratio of 0.81 times which raised and became of 0.86 times
in year 2018. While JD sports fashion limited had ratio of 0.68 times and 0.72 times
for year 2017 and 2018. It shows that Sports direct plc has better quick ratio as
compared to JD sports fashion limited.
3. Net profit ratio
2017 2018 2017 2018
Sports direct plc JD sports fashion limited
0
1
2
3
4
5
6
7
8 7.14
0.82
7.52 7.34
Net margin
Net margin
Analysis- The above column chart showing that both companies have different net
profit margin. Sports direct plc has net margin of 7.14% in year 2017 which reduced
by a huge margin and became of 0.82%. On the other hands, JD sports fashion limited
has net margin of 7.52% in year 2017 and 7.34% in year 2018. It is showing that JD
sports fashion limited is able to generate higher net margin as compared to Sports
direct plc.
tabler-icon-diamond-filled.svg

Paraphrase This Document

Need a fresh take? Get an instant paraphrase of this document with our AI Paraphraser
Document Page
4. Gross profit margin
2017 2018 2017 2018
Sports direct plc JD sports fashion limited
0
10
20
30
40
50
60
41 39.74
48.93 48.47
Gross margin
Gross margin
Analysis- The above column chart showing that both companies have different gross
profit margin. Sports direct plc has gross margin of 41% in year 2017 which reduced by a
little margin and became of 39.74%. On the other hands, JD sports fashion limited has
gross margin of 48.93% in year 2017 and 48.47% in year 2018. It is showing that JD
sports fashion limited is able to generate higher gross margin as compared to Sports
direct plc.
5. Gearing ratio
2017 2018 2017 2018
Sports direct plc JD sports fashion limited
0
0.2
0.4
0.6
0.8
1
1.2
0.98
0.35
1.14 1.11
Gearing ratio
Gearing ratio
Document Page
Analysis- On the basis of above chart, this can be stated that both companies have
different value of gearing ratio. Such as Sports direct plc has gearing ratio of 0.98 in
year 2017 which raised and became of 1.35 for year 2018. On the other hands, JD
sports fashion limited had ratio of 1.14 and 1.11 for year 2017 and 2018. It is
indicating that JD sports fashion limited has better liquidity with lower risk.
6. Price earnings ratio
2017 2018 2017 2018
Sports direct plc JD sports fashion limited
0
200
400
600
800
1000
1200
1400
1600
1800
8.34 76.96
1569.44 1562.5
PE ratio
PE ratio
Analysis- The above mentioned chart is showing that Sports direct plc had price
earnings ratio of 8.34 for year 2017 that raised and became of 76.96. While JD sports
fashion limited had ratio of 1569.44 and 1562.5 for year 2017 and 2018. It is
indicating that JD sports fashion limited has better financial performance as
compared to Sports direct plc.
7. EPS
Document Page
2017 2018 2017 2018
Sports direct plc JD sports fashion limited
0
5
10
15
20
25
30
35
40
45 39.4
4.6
0.18 0.24
EPS
EPS
Analysis- In terms of earnings per share, Sports direct plc has better ratio which is of 39.4 for
year 2017 and 4.6 for year 2018. While JD sports fashion limited had ratio of 0.18 and 0.24 for
year 2017 and 2018. It is indicating that Sports direct plc has better financial performance as
compared to JD sports fashion limited.
8. ROCE
2017 2018 2017 2018
Sports direct plc JD sports fashion limited
0
0.05
0.1
0.15
0.2
0.25
0.3
0.35
0.4
0.01 0.01
0.38
0.33
ROCE
ROCE
tabler-icon-diamond-filled.svg

Paraphrase This Document

Need a fresh take? Get an instant paraphrase of this document with our AI Paraphraser
Document Page
Analysis- The efficiency of generating return on capital employed is different of both
companies. Such as Sports direct plc had ratio of 0.01 in year 2017 which remained
same for next year 2018. While JD sports fashion limited had ratio of 0.38 and 0.33
for year 2017 and 2018. This is showing that JD sports fashion limited is able to
generate higher return on invested capital as compared to Sports direct plc.
9. Inventory turnover ratio:
2017 2018 2017 2018
Sports direct plc JD sports fashion limited
0
0.5
1
1.5
2
2.5
3
3.5
4 3.49 3.41
2.84
2.32
Inventory turnover ratio
Analysis- On the basis of above chart, this can be stated that efficiency of both
companies to manage stock is different. Sports direct plc seems better to manage their
inventory level. As their ratio was of 3.49 times in year 2017 and 3.41 times in year
2018. While, JD sports fashion limited had ratio of 2.84 times and 2.32 times for year
2017 and 2018. This is showing that Sports direct plc is managing their stock in an
effective manner.
10. Dividend payout ratio
Document Page
2017 2018 2017 2018
Sports direct plc JD sports fashion limited
0
0.1
0.2
0.3
0.4
0.5
0.6
0.7
0.06
0.54
0.66
0.53
Dividend payout ratio
Analysis- It is indicating that Sports direct plc is paying dividend more effectively as
compared to JD sports fashion limited. Like in year 2017, Sports direct limited paid
dividend of 0.06 and in year 2018 of 0.54. While JD sports fashion limited paid
dividend of 0.66 and 0.53 for year 2017 and 2018. It is showing that JD sports
limited are paying more dividends.
In the end of this analysis, this can be stated that stakeholders need to focus on JD sports limited
in order to make investment. This is so because its performance is better in most of the ratio. If
stakeholders will make investment in this company than they will be able to generate higher
return.
(c) Recommendations to improve companies performance:
Recommendations to JD sports limited:
Company needs to focus on increasing current assets so that their liquidity
position can be enhanced. As above stated that their current assets are lower in
both of years which are resulting in poor liquidity position.
In addition, company should manage their stored level of inventories in an
effective manner so that cost can be reduced. It is so because inventory turnover
ratio is poor.
chevron_up_icon
1 out of 27
circle_padding
hide_on_mobile
zoom_out_icon
[object Object]