Managerial Finance Report: Tesco and Sainsbury Financial Analysis
VerifiedAdded on 2023/01/03
|19
|4018
|53
Report
AI Summary
This report, prepared for a Managerial Finance course, undertakes a detailed financial analysis of Tesco PLC and Sainsbury PLC, two major players in the retail industry, for the years 2018 and 2019. The analysis begins with the calculation of ten key financial ratios, including current ratio, quick ratio, net profit margin, gross profit margin, gearing ratio, price-earnings ratio, earnings per share, return on capital employed, average inventories turnover period, and dividend payout ratio, to assess the companies' financial health, liquidity, profitability, and investment potential. The report then provides a comparative analysis of the companies' performance, financial positions, and investment attractiveness based on these ratios. The second part of the report focuses on investment appraisal techniques, discussing their application and limitations in long-term decision-making. The report concludes with recommendations for both companies based on the financial analysis and a discussion of the limitations of relying solely on financial ratios for decision-making.

Management Finance
Paraphrase This Document
Need a fresh take? Get an instant paraphrase of this document with our AI Paraphraser
Contents
TASK 1............................................................................................................................................3
a. Calculate 10 financial ratios as given below for two years (2018 and 2019):....................3
b. Analyse performance, financial position and investment potential of both companies:....4
c. Provide recommendations:.................................................................................................6
d. Limitations of relying on financial ratios...........................................................................6
TASK 2............................................................................................................................................8
a. Investment appraisal techniques:........................................................................................8
b. Limitations of using investment appraisal techniques in long term decision making:.....11
REFERENCES..............................................................................................................................13
INTRODUCTION
Management finance is perceived as a subset of finance that administrators use to
accumulate and distribute strategically their fiscal funds for company procedures. This is
beneficial for producing demand for the business. This report was formulated to explain this
theory. It was broken into two sections. The very first part is compared to the financial success
calculation by financial ratios of Sainsbury Plc and Tesco Plc. In the retail industry, both Tesco
as well as Sainsbury conduct their businesses. This study determines which company is
favourable for investors. The significance and drawbacks of investment evaluation technologies
were systematically established in the second part.
TASK 1
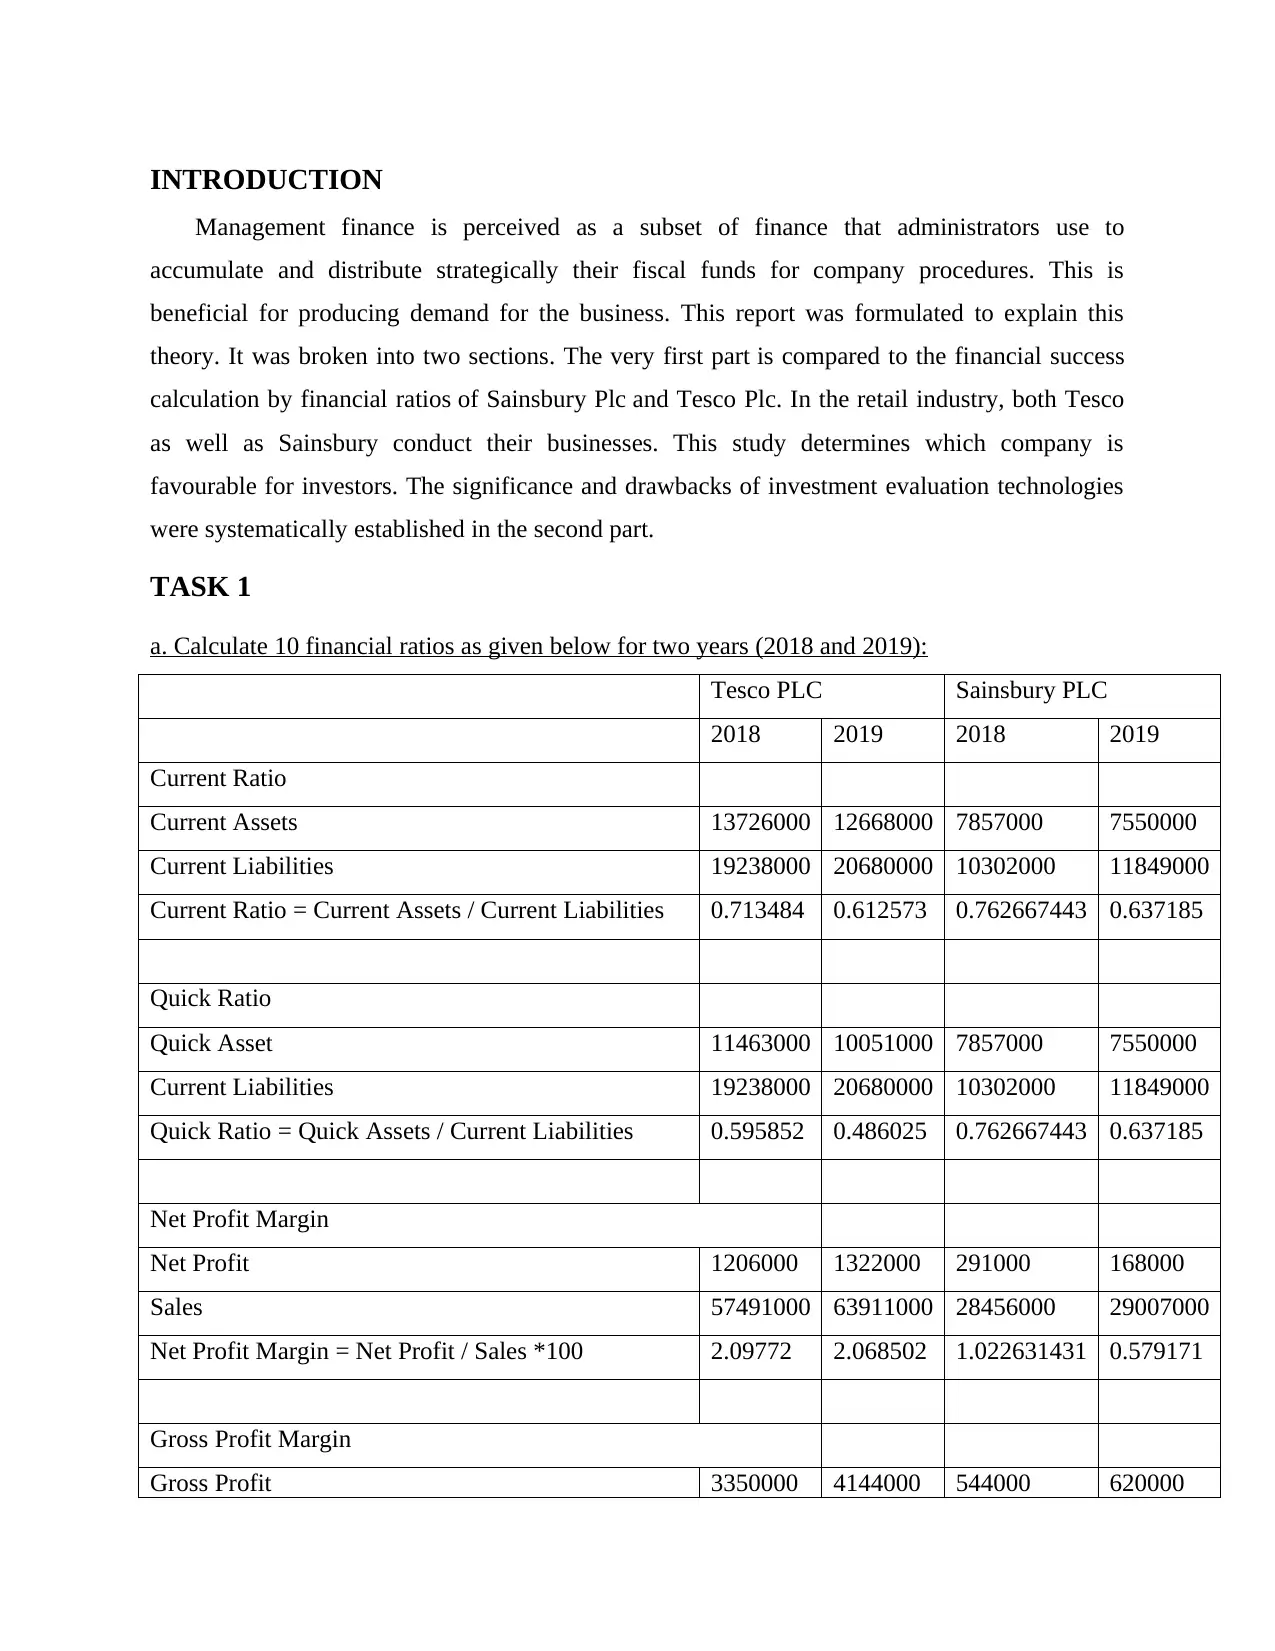
a. Calculate 10 financial ratios as given below for two years (2018 and 2019):
Tesco PLC Sainsbury PLC
2018 2019 2018 2019
Current Ratio
Current Assets 13726000 12668000 7857000 7550000
Current Liabilities 19238000 20680000 10302000 11849000
Current Ratio = Current Assets / Current Liabilities 0.713484 0.612573 0.762667443 0.637185
Quick Ratio
Quick Asset 11463000 10051000 7857000 7550000
Current Liabilities 19238000 20680000 10302000 11849000
Quick Ratio = Quick Assets / Current Liabilities 0.595852 0.486025 0.762667443 0.637185
Net Profit Margin
Net Profit 1206000 1322000 291000 168000
Sales 57491000 63911000 28456000 29007000
Net Profit Margin = Net Profit / Sales *100 2.09772 2.068502 1.022631431 0.579171
Gross Profit Margin
Gross Profit 3350000 4144000 544000 620000
Management finance is perceived as a subset of finance that administrators use to
accumulate and distribute strategically their fiscal funds for company procedures. This is
beneficial for producing demand for the business. This report was formulated to explain this
theory. It was broken into two sections. The very first part is compared to the financial success
calculation by financial ratios of Sainsbury Plc and Tesco Plc. In the retail industry, both Tesco
as well as Sainsbury conduct their businesses. This study determines which company is
favourable for investors. The significance and drawbacks of investment evaluation technologies
were systematically established in the second part.
TASK 1
a. Calculate 10 financial ratios as given below for two years (2018 and 2019):
Tesco PLC Sainsbury PLC
2018 2019 2018 2019
Current Ratio
Current Assets 13726000 12668000 7857000 7550000
Current Liabilities 19238000 20680000 10302000 11849000
Current Ratio = Current Assets / Current Liabilities 0.713484 0.612573 0.762667443 0.637185
Quick Ratio
Quick Asset 11463000 10051000 7857000 7550000
Current Liabilities 19238000 20680000 10302000 11849000
Quick Ratio = Quick Assets / Current Liabilities 0.595852 0.486025 0.762667443 0.637185
Net Profit Margin
Net Profit 1206000 1322000 291000 168000
Sales 57491000 63911000 28456000 29007000
Net Profit Margin = Net Profit / Sales *100 2.09772 2.068502 1.022631431 0.579171
Gross Profit Margin
Gross Profit 3350000 4144000 544000 620000
⊘ This is a preview!⊘
Do you want full access?
Subscribe today to unlock all pages.
Trusted by 1+ million students worldwide
Sales 57491000 63911000 28456000 29007000
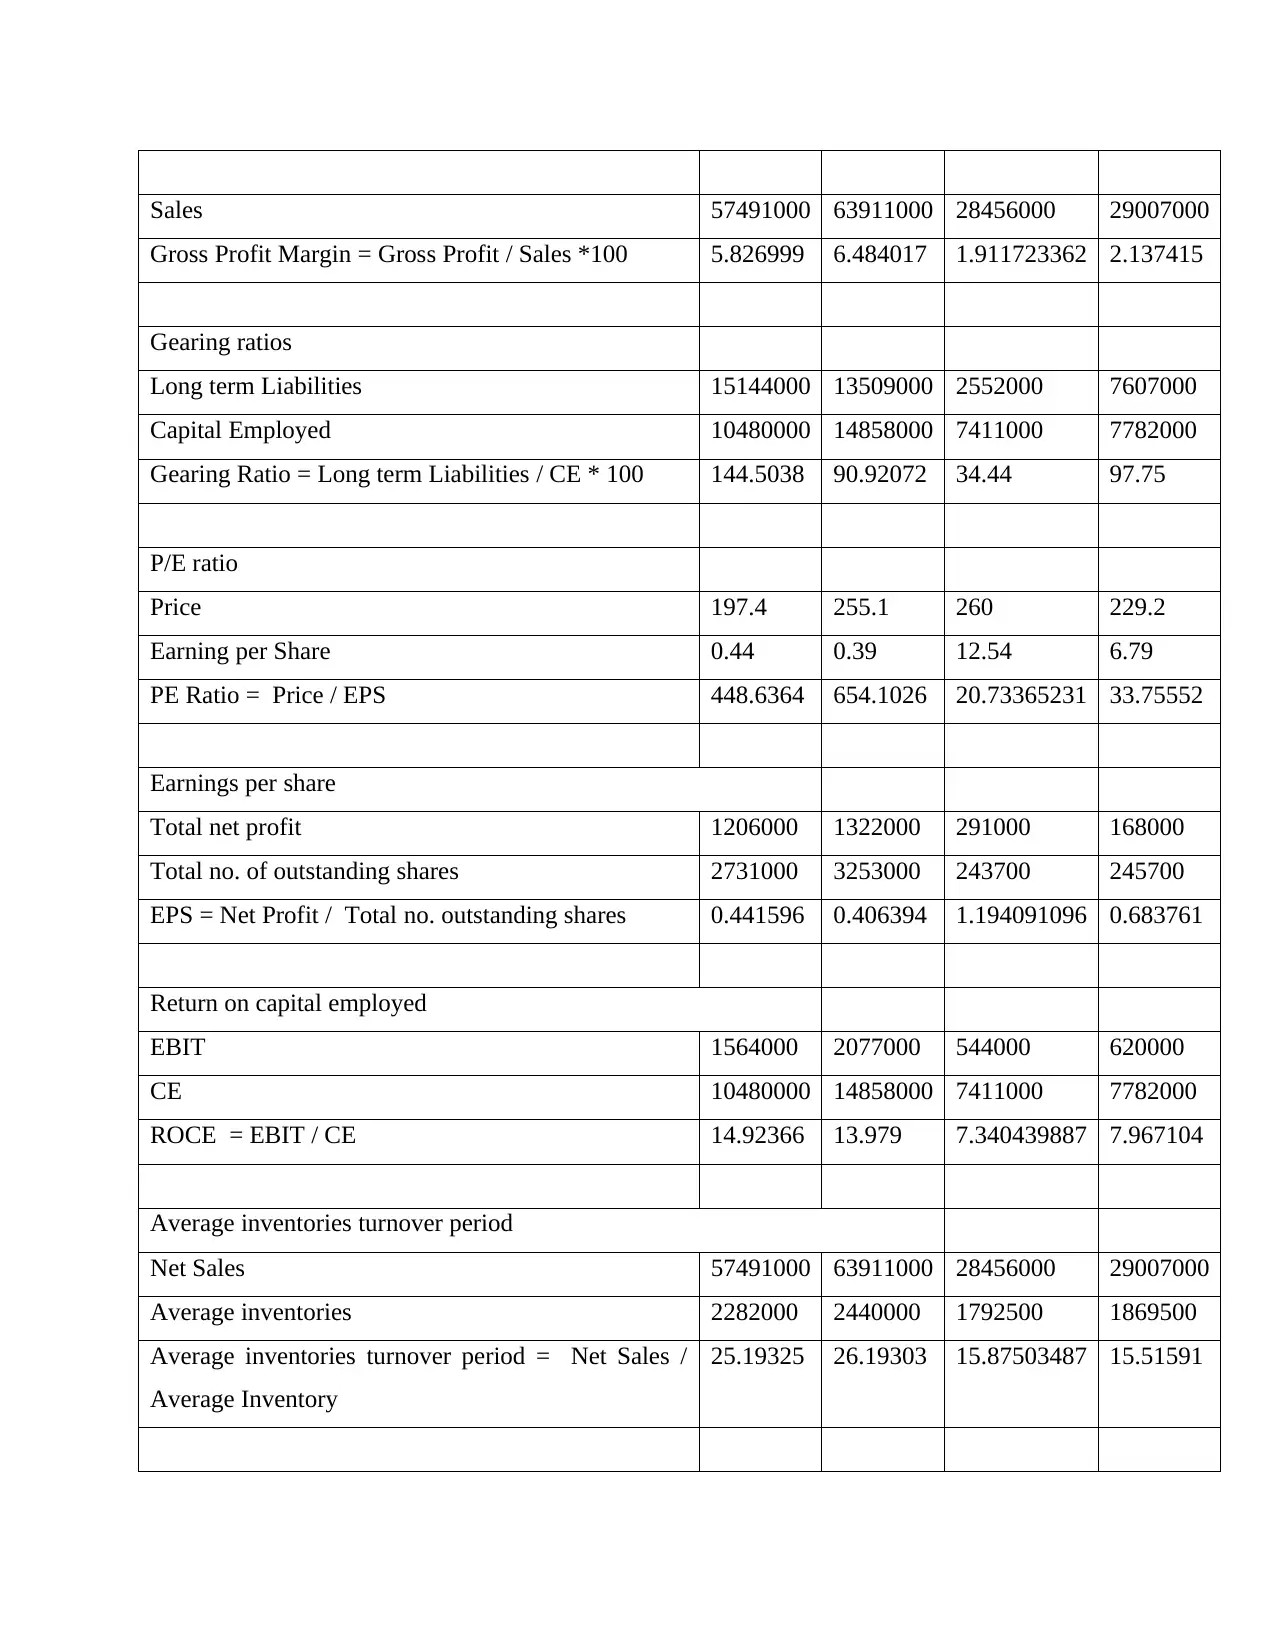
Gross Profit Margin = Gross Profit / Sales *100 5.826999 6.484017 1.911723362 2.137415
Gearing ratios
Long term Liabilities 15144000 13509000 2552000 7607000
Capital Employed 10480000 14858000 7411000 7782000
Gearing Ratio = Long term Liabilities / CE * 100 144.5038 90.92072 34.44 97.75
P/E ratio
Price 197.4 255.1 260 229.2
Earning per Share 0.44 0.39 12.54 6.79
PE Ratio = Price / EPS 448.6364 654.1026 20.73365231 33.75552
Earnings per share
Total net profit 1206000 1322000 291000 168000
Total no. of outstanding shares 2731000 3253000 243700 245700
EPS = Net Profit / Total no. outstanding shares 0.441596 0.406394 1.194091096 0.683761
Return on capital employed
EBIT 1564000 2077000 544000 620000
CE 10480000 14858000 7411000 7782000
ROCE = EBIT / CE 14.92366 13.979 7.340439887 7.967104
Average inventories turnover period
Net Sales 57491000 63911000 28456000 29007000
Average inventories 2282000 2440000 1792500 1869500
Average inventories turnover period = Net Sales /
Average Inventory
25.19325 26.19303 15.87503487 15.51591
Paraphrase This Document
Need a fresh take? Get an instant paraphrase of this document with our AI Paraphraser
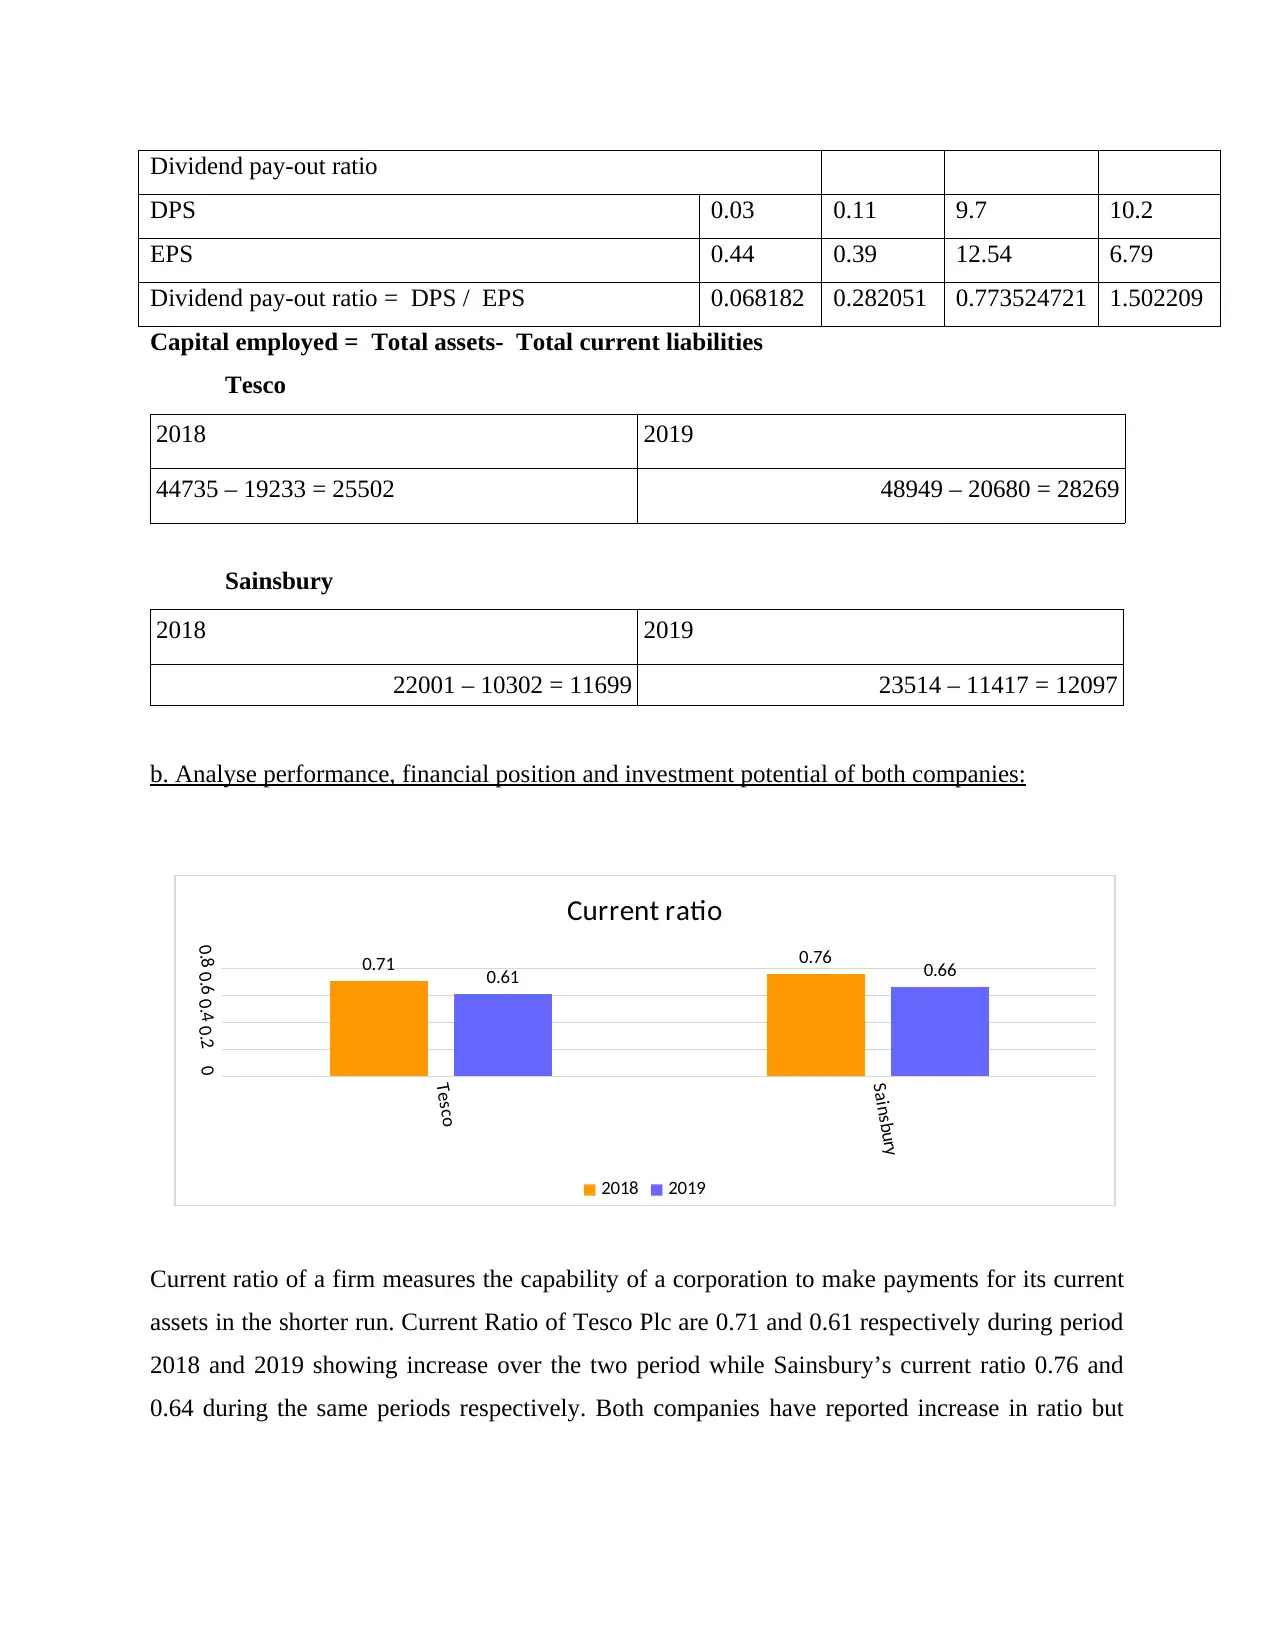
Dividend pay-out ratio
DPS 0.03 0.11 9.7 10.2
EPS 0.44 0.39 12.54 6.79
Dividend pay-out ratio = DPS / EPS 0.068182 0.282051 0.773524721 1.502209
Capital employed = Total assets- Total current liabilities
Tesco
2018 2019
44735 – 19233 = 25502 48949 – 20680 = 28269
Sainsbury
2018 2019
22001 – 10302 = 11699 23514 – 11417 = 12097
b. Analyse performance, financial position and investment potential of both companies:
Current ratio of a firm measures the capability of a corporation to make payments for its current
assets in the shorter run. Current Ratio of Tesco Plc are 0.71 and 0.61 respectively during period
2018 and 2019 showing increase over the two period while Sainsbury’s current ratio 0.76 and
0.64 during the same periods respectively. Both companies have reported increase in ratio but
Tesco
Sainsbury
00.20.40.60.8 0.71 0.76
0.61 0.66
Current ratio
2018 2019
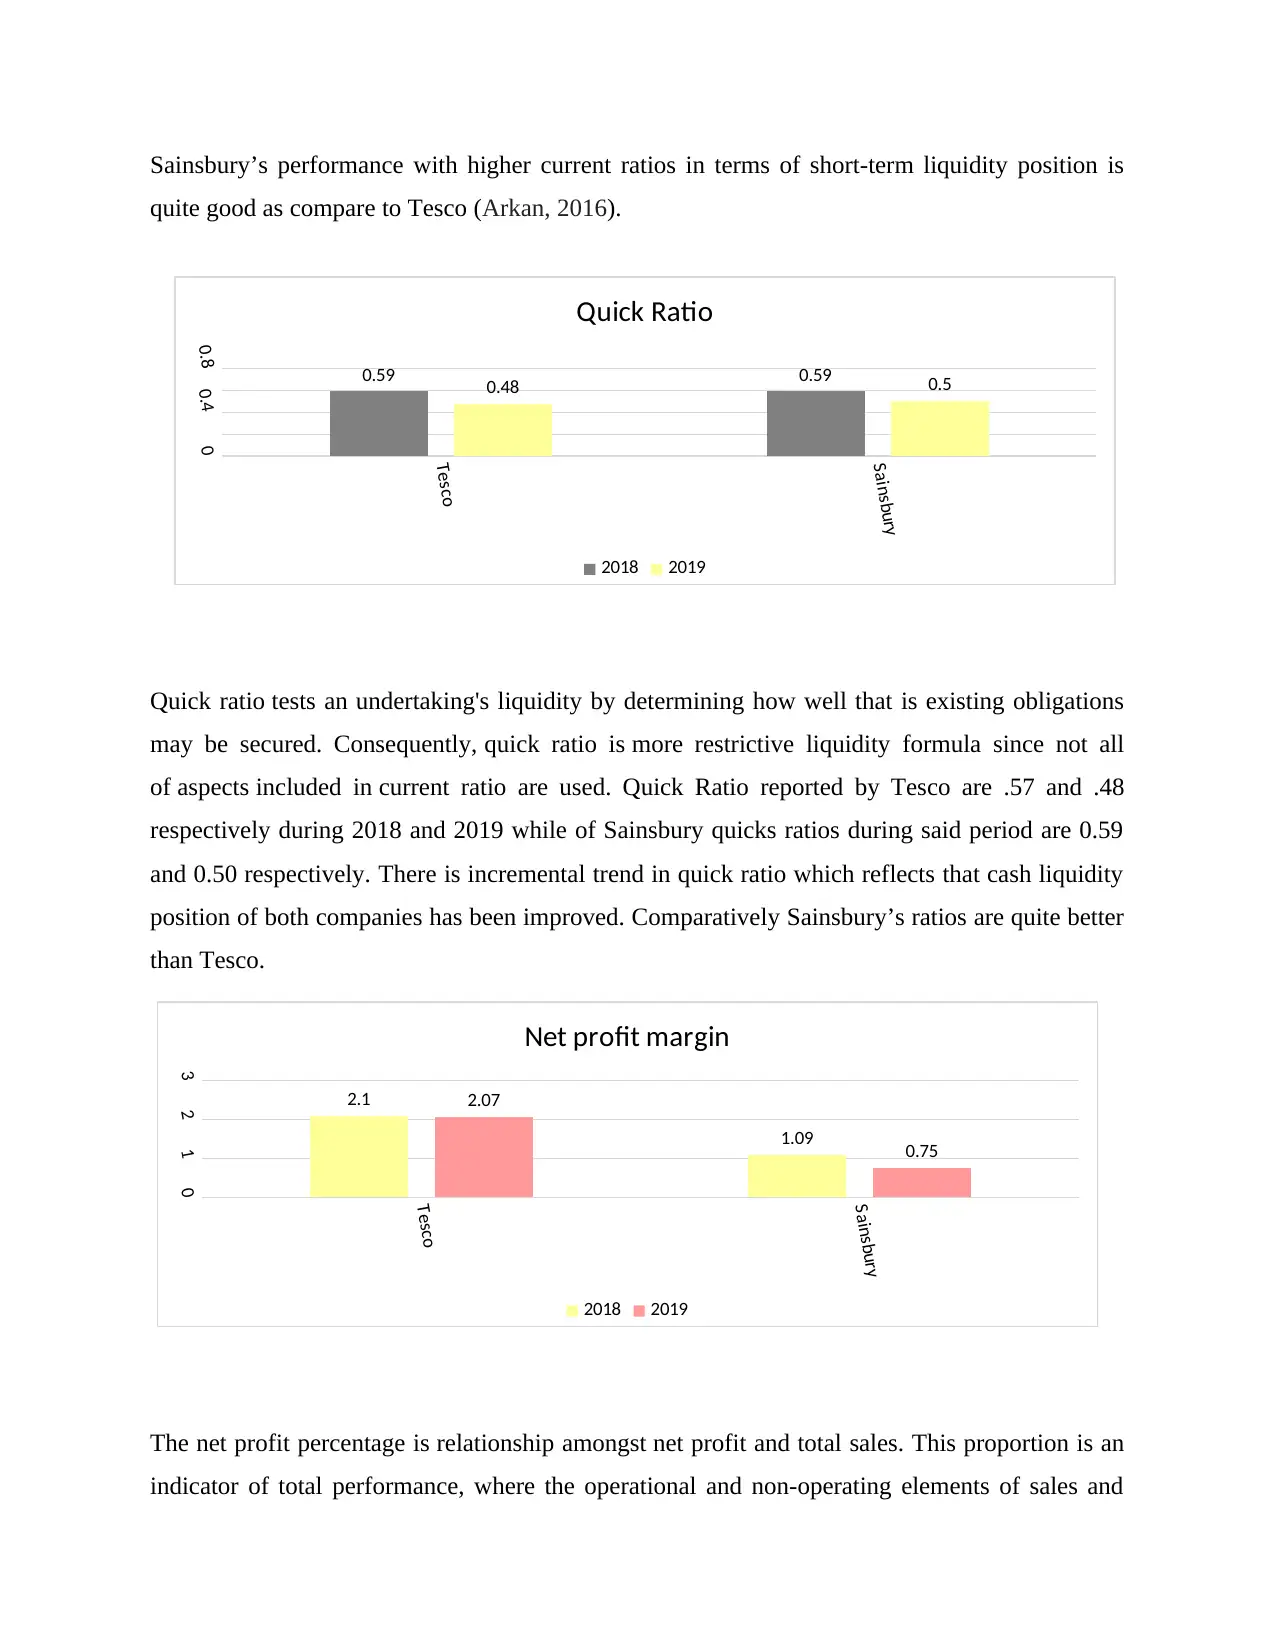
Sainsbury’s performance with higher current ratios in terms of short-term liquidity position is
quite good as compare to Tesco (Arkan, 2016).
Quick ratio tests an undertaking's liquidity by determining how well that is existing obligations
may be secured. Consequently, quick ratio is more restrictive liquidity formula since not all
of aspects included in current ratio are used. Quick Ratio reported by Tesco are .57 and .48
respectively during 2018 and 2019 while of Sainsbury quicks ratios during said period are 0.59
and 0.50 respectively. There is incremental trend in quick ratio which reflects that cash liquidity
position of both companies has been improved. Comparatively Sainsbury’s ratios are quite better
than Tesco.
The net profit percentage is relationship amongst net profit and total sales. This proportion is an
indicator of total performance, where the operational and non-operating elements of sales and
Tesco
Sainsbury
00.40.8 0.59 0.59
0.48 0.5
Quick Ratio
2018 2019
Tesco
Sainsbury
0123
2.1
1.09
2.07
0.75
Net profit margin
2018 2019
⊘ This is a preview!⊘
Do you want full access?
Subscribe today to unlock all pages.
Trusted by 1+ million students worldwide
expenditures are taken into consideration. Profitability position of both the companies can be
effectively measured by Net profit and gross margin ratio. Net profit ratios of Sainsbury are
1.09% and 0.75% during 2018 and 2019 with incremental trend while Tesco’s net-profit ratios
are 2.10 % and 2.07% during 2018 and 2019. Both companies have increase in net profitability
level but Tesco has reported higher profit margins as compare to Sainsbury thus profitability-
wise performance of Tesco is much better than Sainsbury (AREAS, 2018).
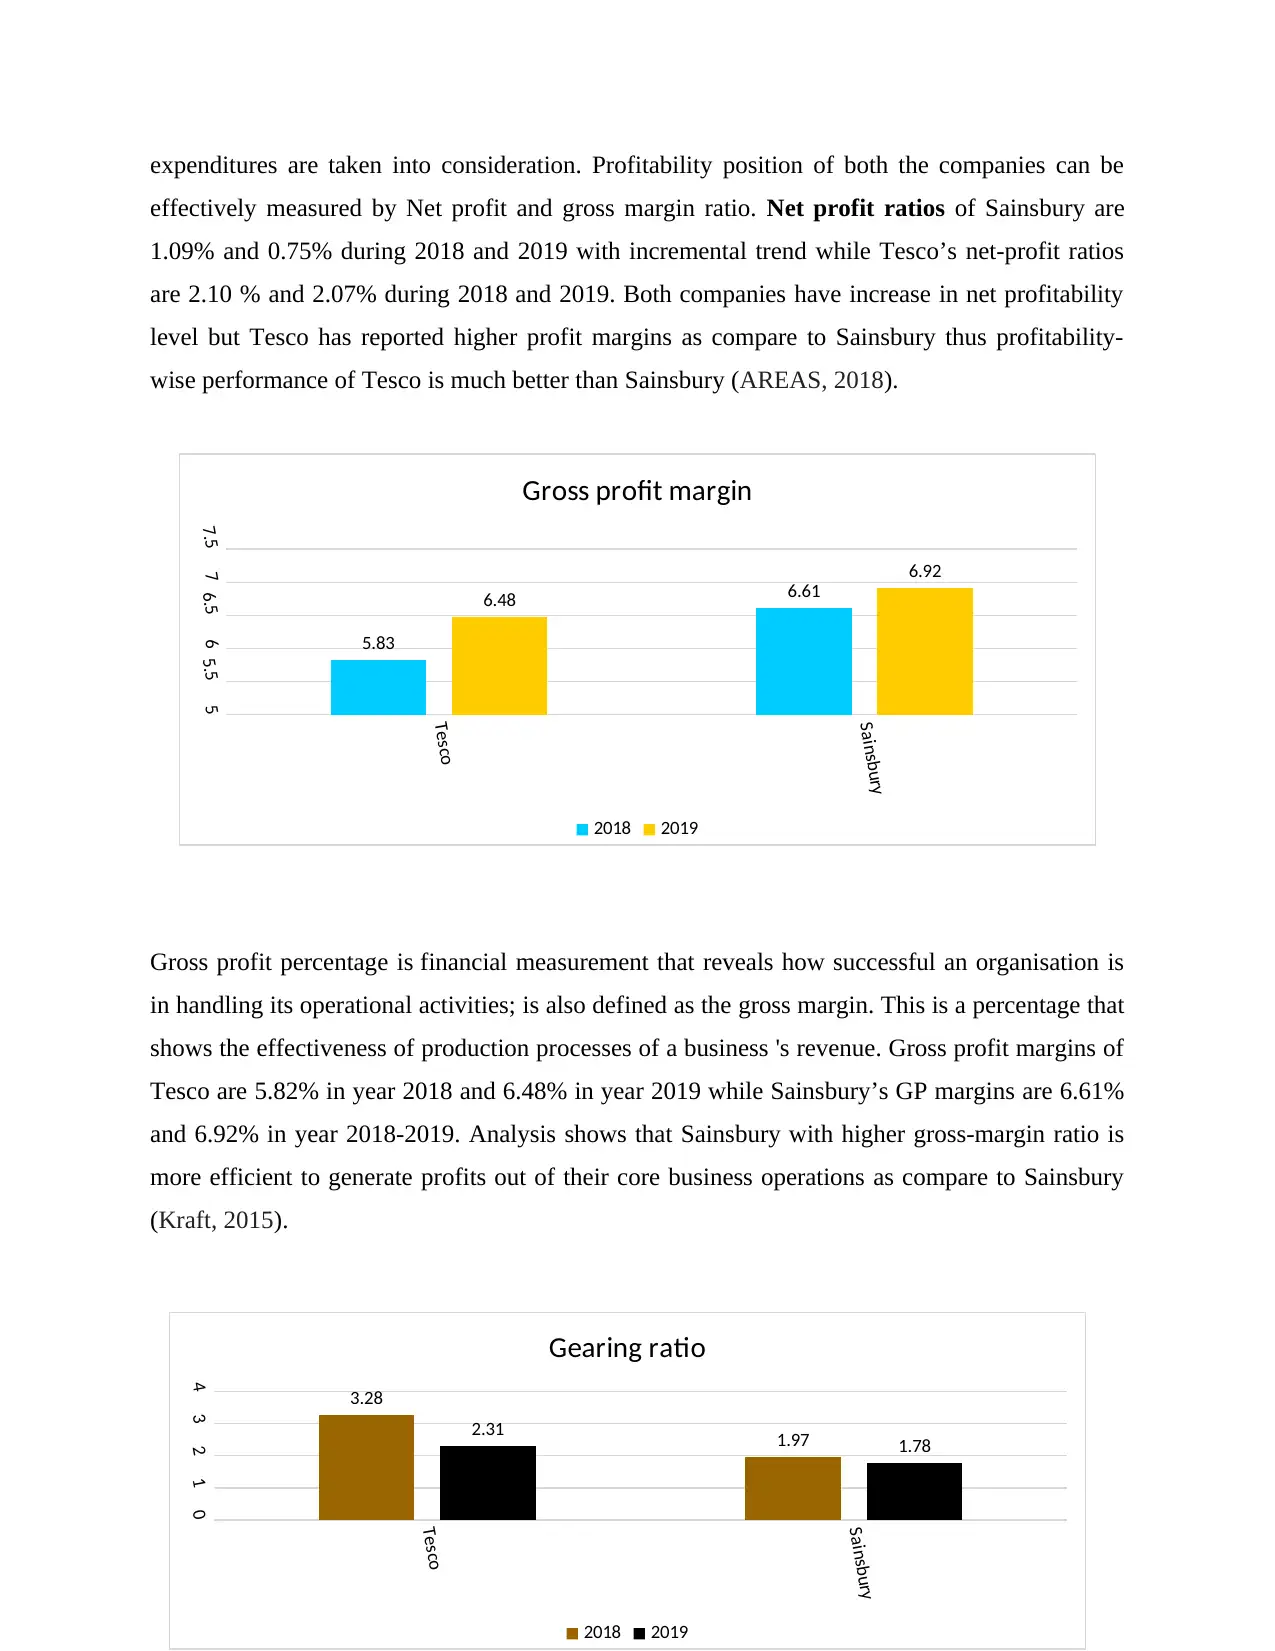
Gross profit percentage is financial measurement that reveals how successful an organisation is
in handling its operational activities; is also defined as the gross margin. This is a percentage that
shows the effectiveness of production processes of a business 's revenue. Gross profit margins of
Tesco are 5.82% in year 2018 and 6.48% in year 2019 while Sainsbury’s GP margins are 6.61%
and 6.92% in year 2018-2019. Analysis shows that Sainsbury with higher gross-margin ratio is
more efficient to generate profits out of their core business operations as compare to Sainsbury
(Kraft, 2015).
Tesco
Sainsbury
55.566.577.5
5.83
6.616.48
6.92
Gross profit margin
2018 2019
Tesco
Sainsbury
01234 3.28
1.97
2.31 1.78
Gearing ratio
2018 2019
effectively measured by Net profit and gross margin ratio. Net profit ratios of Sainsbury are
1.09% and 0.75% during 2018 and 2019 with incremental trend while Tesco’s net-profit ratios
are 2.10 % and 2.07% during 2018 and 2019. Both companies have increase in net profitability
level but Tesco has reported higher profit margins as compare to Sainsbury thus profitability-
wise performance of Tesco is much better than Sainsbury (AREAS, 2018).
Gross profit percentage is financial measurement that reveals how successful an organisation is
in handling its operational activities; is also defined as the gross margin. This is a percentage that
shows the effectiveness of production processes of a business 's revenue. Gross profit margins of
Tesco are 5.82% in year 2018 and 6.48% in year 2019 while Sainsbury’s GP margins are 6.61%
and 6.92% in year 2018-2019. Analysis shows that Sainsbury with higher gross-margin ratio is
more efficient to generate profits out of their core business operations as compare to Sainsbury
(Kraft, 2015).
Tesco
Sainsbury
55.566.577.5
5.83
6.616.48
6.92
Gross profit margin
2018 2019
Tesco
Sainsbury
01234 3.28
1.97
2.31 1.78
Gearing ratio
2018 2019
Paraphrase This Document
Need a fresh take? Get an instant paraphrase of this document with our AI Paraphraser
The gearing percentage calculates the share of borrowing funding of a firm to its stocks and
bonds. This ratio reveals a company's financial uncertainty, since unsustainable leverage will
result in financial hardship. Gearing ratio reflects actual liquidity ratio of company. As reported
by Tesco, company’s gearing ratio in 2019 is 2.31 and in 2018 is 3.28 while Sainsbury’s gearing
ratios are 1.97 and 1.78% respectively in year 2018 and 2019. Tesco has greater ratio as compare
to Sainsbury which implies that Tesco’s debt proportion is higher. Thus, Sainsbury’s liquidity
position is better than Tesco (Simó and Coenders, 2020).
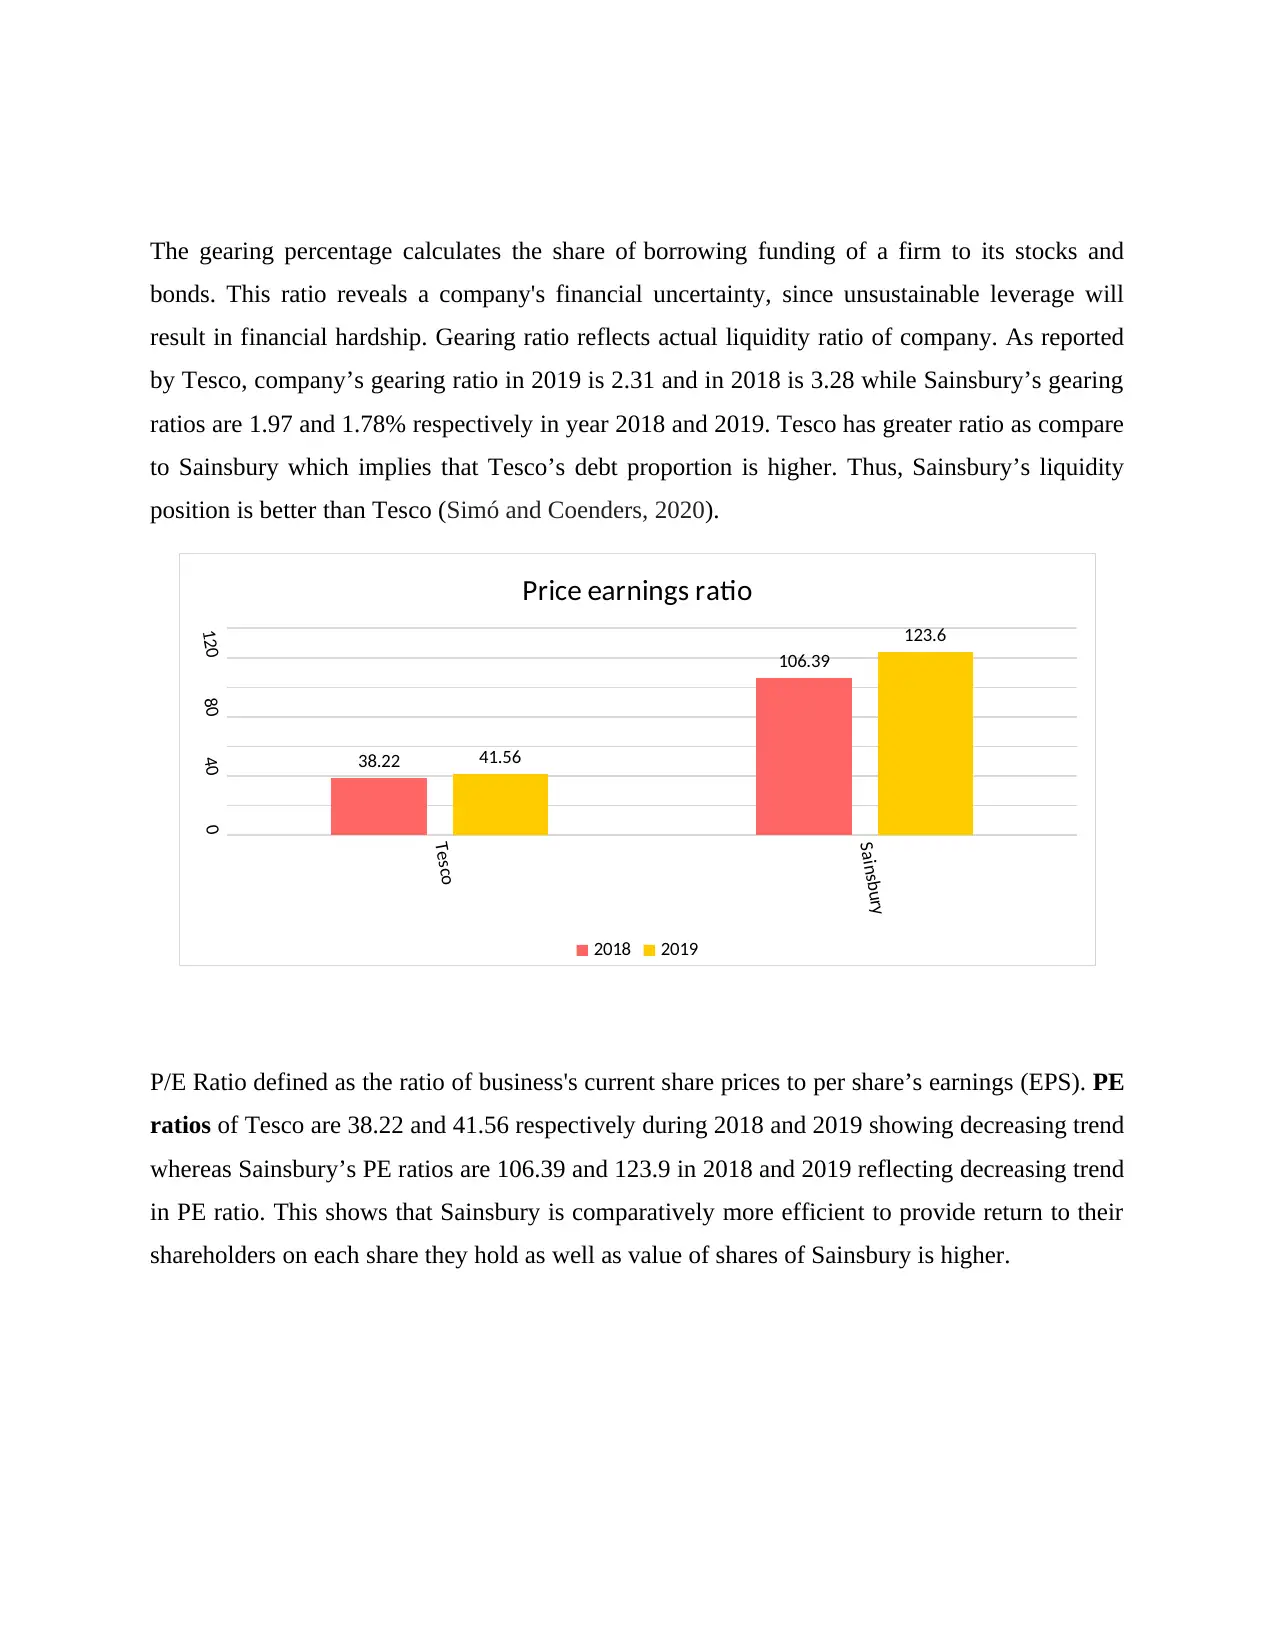
P/E Ratio defined as the ratio of business's current share prices to per share’s earnings (EPS). PE
ratios of Tesco are 38.22 and 41.56 respectively during 2018 and 2019 showing decreasing trend
whereas Sainsbury’s PE ratios are 106.39 and 123.9 in 2018 and 2019 reflecting decreasing trend
in PE ratio. This shows that Sainsbury is comparatively more efficient to provide return to their
shareholders on each share they hold as well as value of shares of Sainsbury is higher.
Tesco
Sainsbury
0
40
80
120
38.22
106.39
41.56
123.6
Price earnings ratio
2018 2019
bonds. This ratio reveals a company's financial uncertainty, since unsustainable leverage will
result in financial hardship. Gearing ratio reflects actual liquidity ratio of company. As reported
by Tesco, company’s gearing ratio in 2019 is 2.31 and in 2018 is 3.28 while Sainsbury’s gearing
ratios are 1.97 and 1.78% respectively in year 2018 and 2019. Tesco has greater ratio as compare
to Sainsbury which implies that Tesco’s debt proportion is higher. Thus, Sainsbury’s liquidity
position is better than Tesco (Simó and Coenders, 2020).
P/E Ratio defined as the ratio of business's current share prices to per share’s earnings (EPS). PE
ratios of Tesco are 38.22 and 41.56 respectively during 2018 and 2019 showing decreasing trend
whereas Sainsbury’s PE ratios are 106.39 and 123.9 in 2018 and 2019 reflecting decreasing trend
in PE ratio. This shows that Sainsbury is comparatively more efficient to provide return to their
shareholders on each share they hold as well as value of shares of Sainsbury is higher.
Tesco
Sainsbury
0
40
80
120
38.22
106.39
41.56
123.6
Price earnings ratio
2018 2019
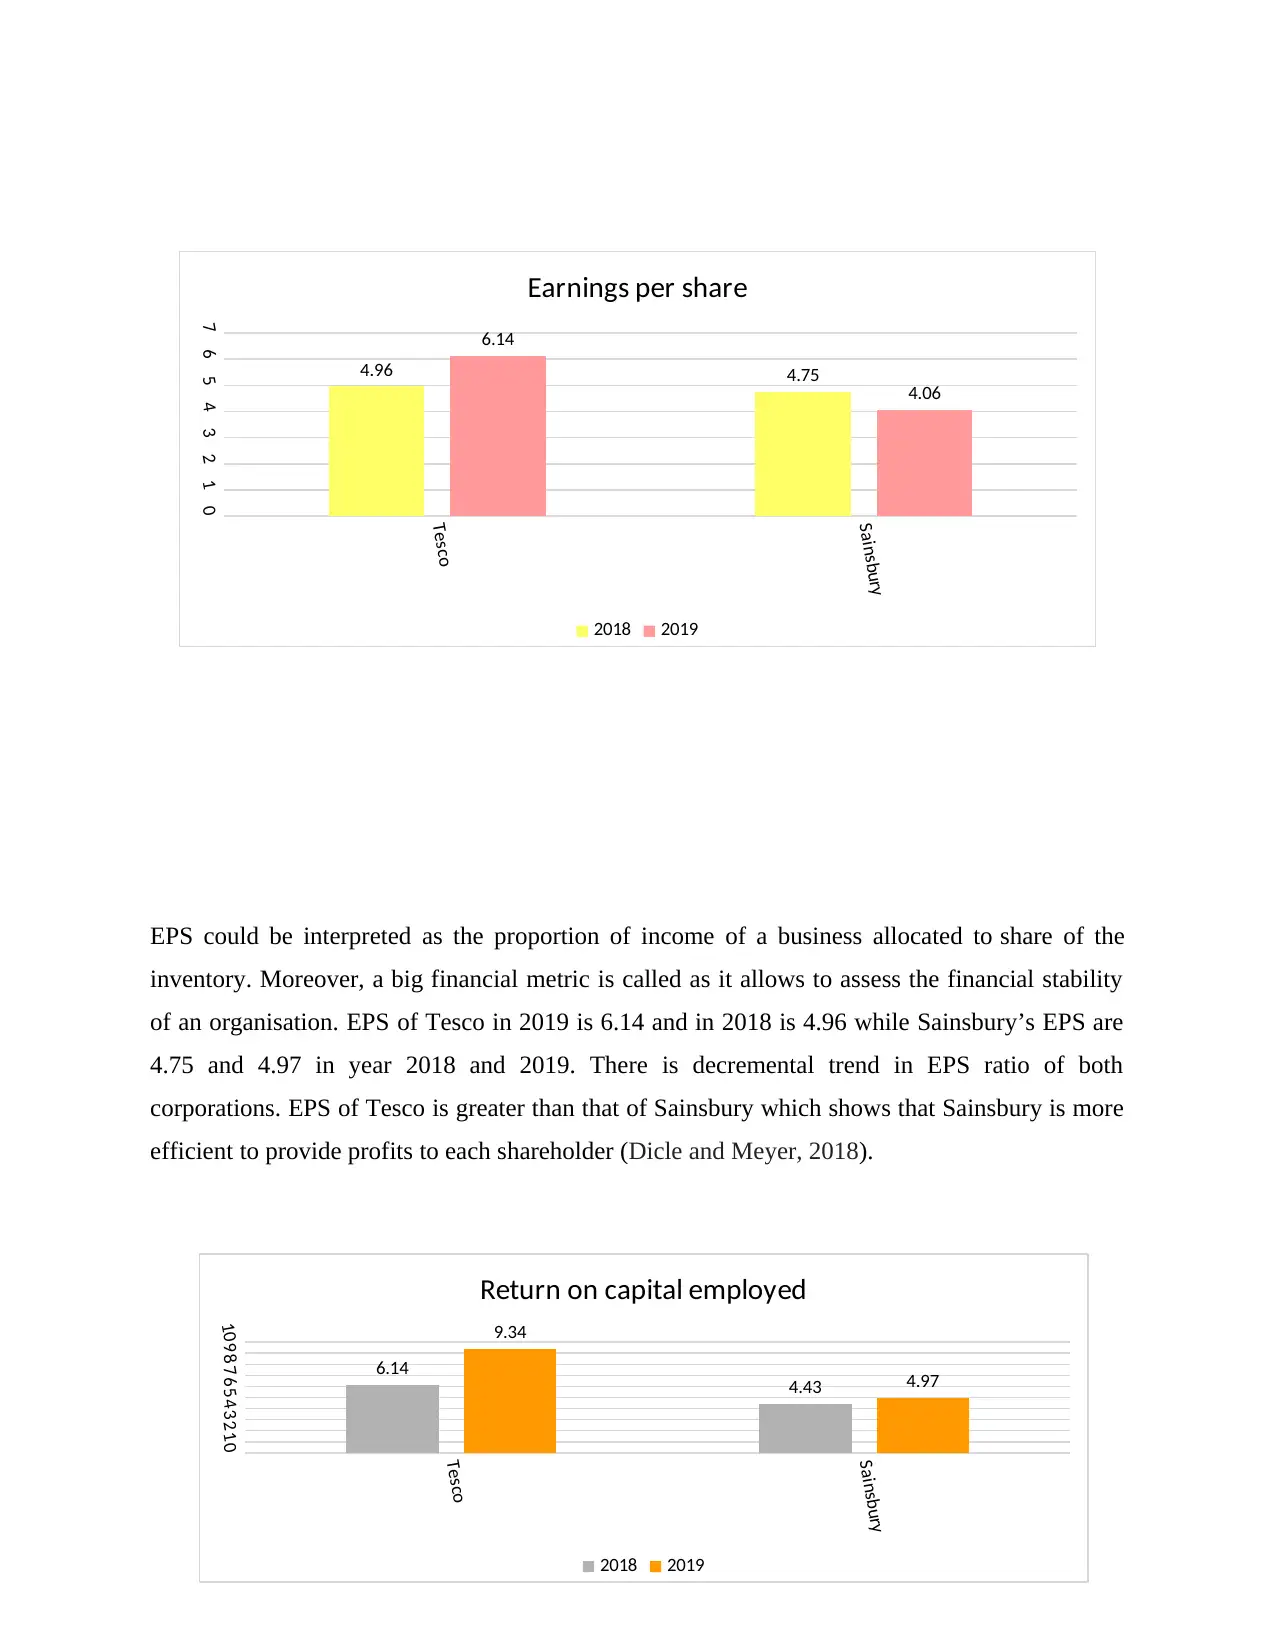
EPS could be interpreted as the proportion of income of a business allocated to share of the
inventory. Moreover, a big financial metric is called as it allows to assess the financial stability
of an organisation. EPS of Tesco in 2019 is 6.14 and in 2018 is 4.96 while Sainsbury’s EPS are
4.75 and 4.97 in year 2018 and 2019. There is decremental trend in EPS ratio of both
corporations. EPS of Tesco is greater than that of Sainsbury which shows that Sainsbury is more
efficient to provide profits to each shareholder (Dicle and Meyer, 2018).
Tesco
Sainsbury
01234567
4.96 4.75
6.14
4.06
Earnings per share
2018 2019
Tesco
Sainsbury
012345678910
6.14
4.43
9.34
4.97
Return on capital employed
2018 2019
⊘ This is a preview!⊘
Do you want full access?
Subscribe today to unlock all pages.
Trusted by 1+ million students worldwide
ROCE is represented as a measurement of return/yield of a business, commonly presented in
percentage figures, on the invested capital. ROCE of Tesco are 6.14 and 9.34 and of Sainsbury
are 4.43 and 4.97 respectively during 2018 and 2019 respectively. There is decline in ROCE in
case of both companies. Tesco with higher ROCE is more capable to generate returns on its
overall capital-fund employed.
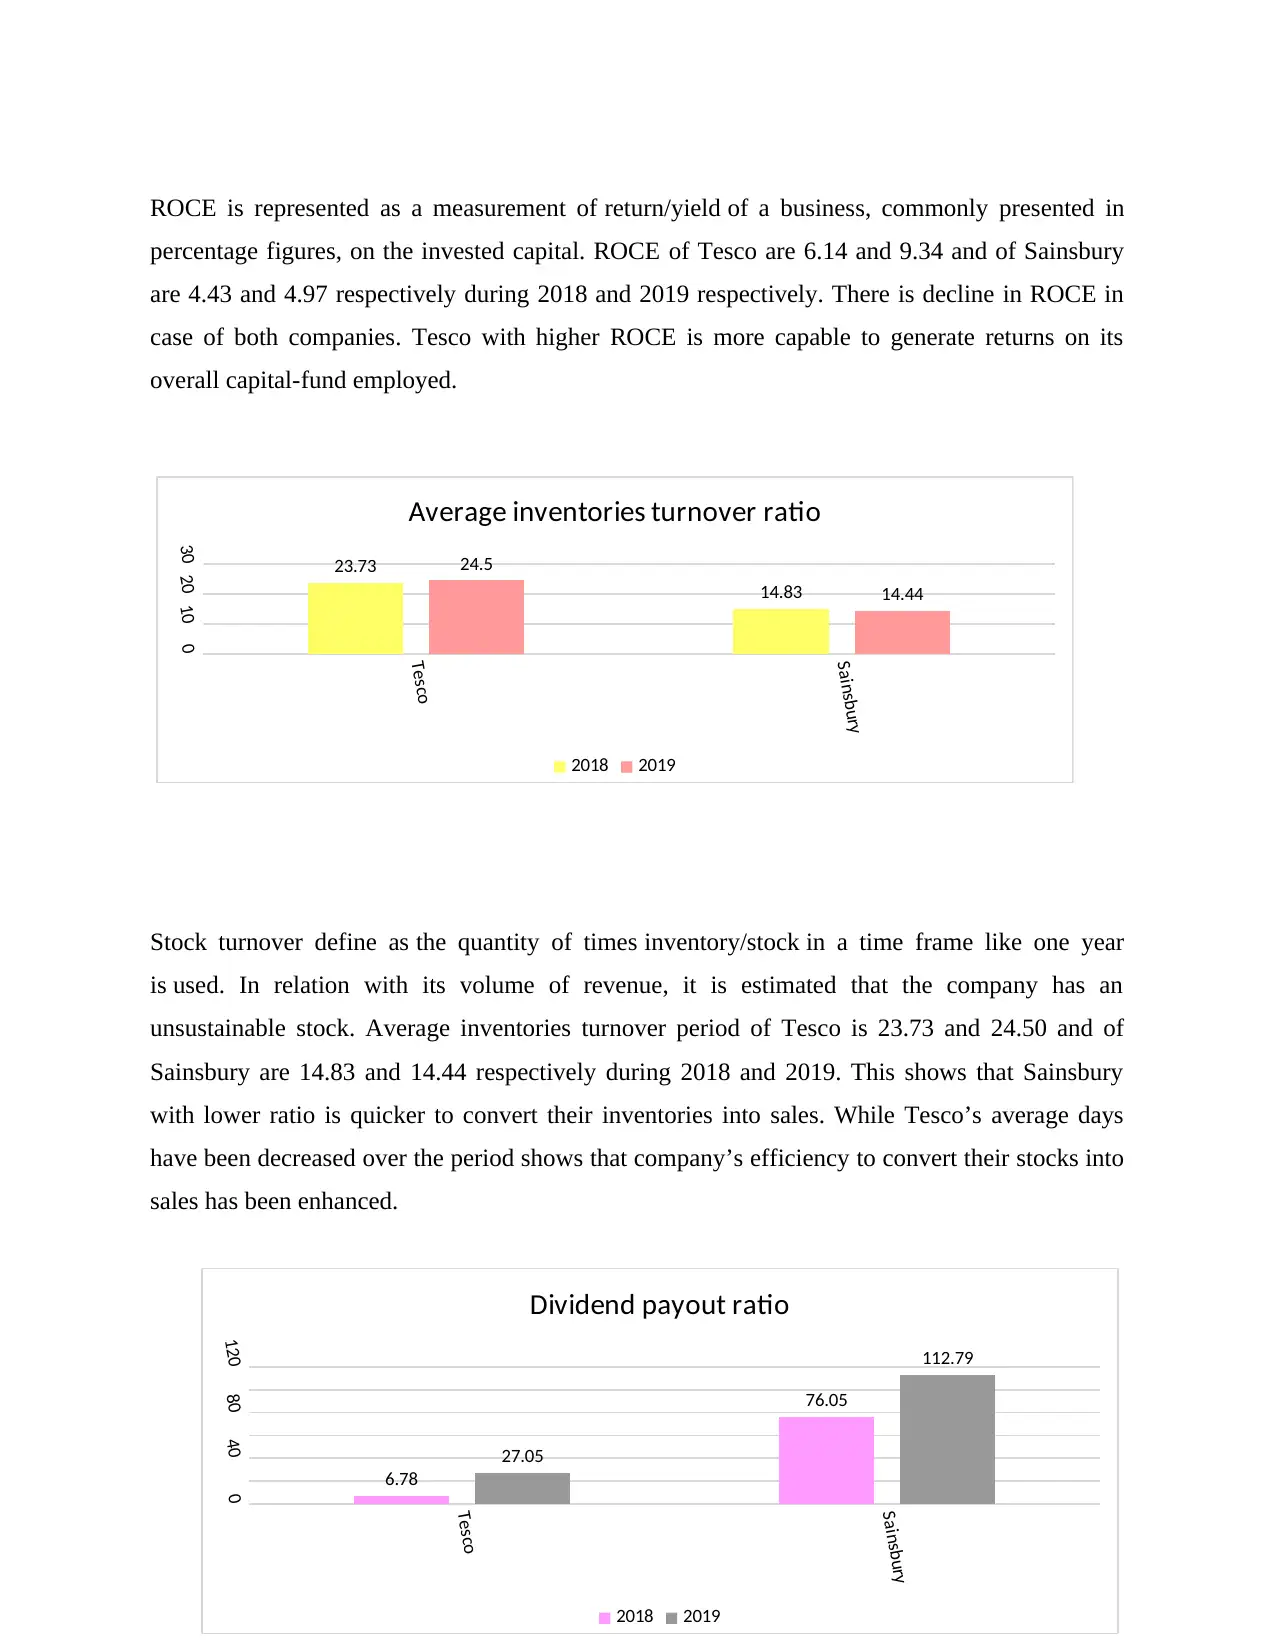
Stock turnover define as the quantity of times inventory/stock in a time frame like one year
is used. In relation with its volume of revenue, it is estimated that the company has an
unsustainable stock. Average inventories turnover period of Tesco is 23.73 and 24.50 and of
Sainsbury are 14.83 and 14.44 respectively during 2018 and 2019. This shows that Sainsbury
with lower ratio is quicker to convert their inventories into sales. While Tesco’s average days
have been decreased over the period shows that company’s efficiency to convert their stocks into
sales has been enhanced.
Tesco
Sainsbury
0102030 23.73
14.83
24.5
14.44
Average inventories turnover ratio
2018 2019
Tesco
Sainsbury
04080120
6.78
76.05
27.05
112.79
Dividend payout ratio
2018 2019
percentage figures, on the invested capital. ROCE of Tesco are 6.14 and 9.34 and of Sainsbury
are 4.43 and 4.97 respectively during 2018 and 2019 respectively. There is decline in ROCE in
case of both companies. Tesco with higher ROCE is more capable to generate returns on its
overall capital-fund employed.
Stock turnover define as the quantity of times inventory/stock in a time frame like one year
is used. In relation with its volume of revenue, it is estimated that the company has an
unsustainable stock. Average inventories turnover period of Tesco is 23.73 and 24.50 and of
Sainsbury are 14.83 and 14.44 respectively during 2018 and 2019. This shows that Sainsbury
with lower ratio is quicker to convert their inventories into sales. While Tesco’s average days
have been decreased over the period shows that company’s efficiency to convert their stocks into
sales has been enhanced.
Tesco
Sainsbury
0102030 23.73
14.83
24.5
14.44
Average inventories turnover ratio
2018 2019
Tesco
Sainsbury
04080120
6.78
76.05
27.05
112.79
Dividend payout ratio
2018 2019
Paraphrase This Document
Need a fresh take? Get an instant paraphrase of this document with our AI Paraphraser
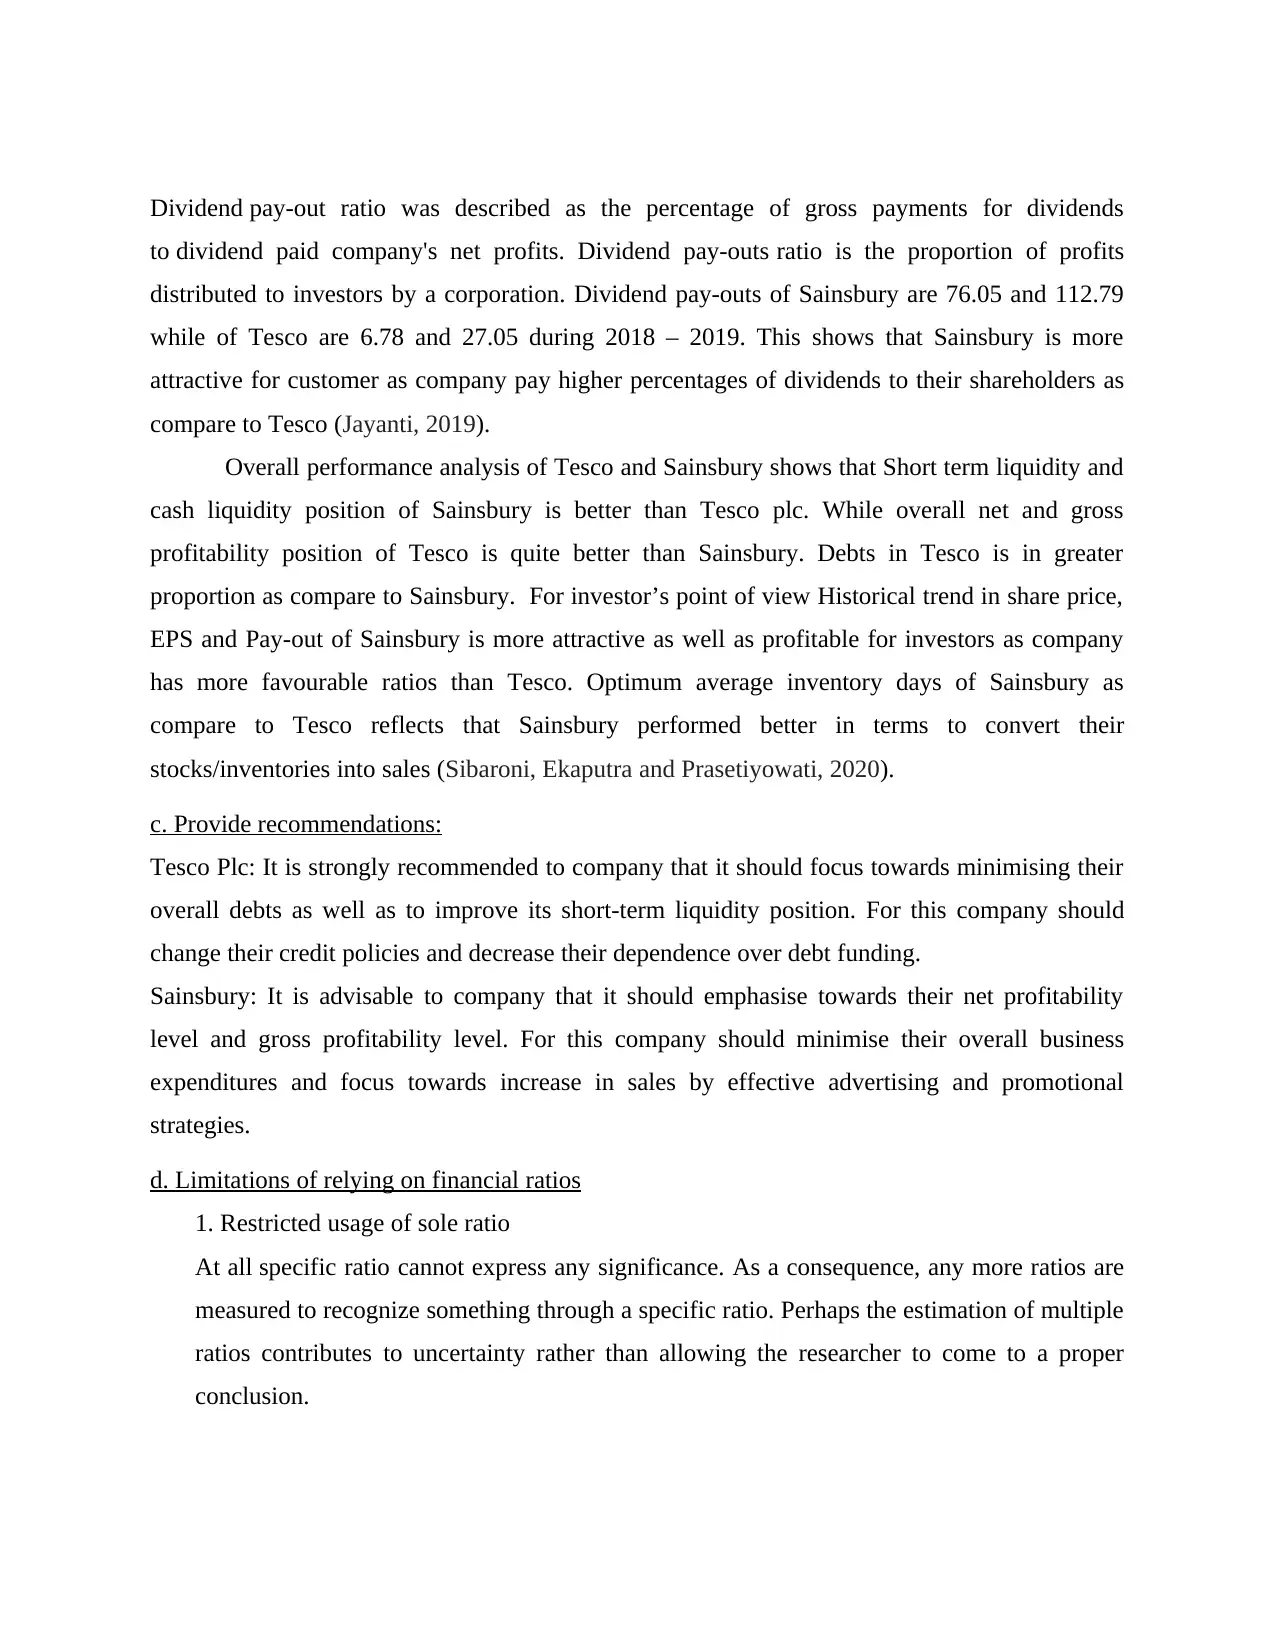
Dividend pay-out ratio was described as the percentage of gross payments for dividends
to dividend paid company's net profits. Dividend pay-outs ratio is the proportion of profits
distributed to investors by a corporation. Dividend pay-outs of Sainsbury are 76.05 and 112.79
while of Tesco are 6.78 and 27.05 during 2018 – 2019. This shows that Sainsbury is more
attractive for customer as company pay higher percentages of dividends to their shareholders as
compare to Tesco (Jayanti, 2019).
Overall performance analysis of Tesco and Sainsbury shows that Short term liquidity and
cash liquidity position of Sainsbury is better than Tesco plc. While overall net and gross
profitability position of Tesco is quite better than Sainsbury. Debts in Tesco is in greater
proportion as compare to Sainsbury. For investor’s point of view Historical trend in share price,
EPS and Pay-out of Sainsbury is more attractive as well as profitable for investors as company
has more favourable ratios than Tesco. Optimum average inventory days of Sainsbury as
compare to Tesco reflects that Sainsbury performed better in terms to convert their
stocks/inventories into sales (Sibaroni, Ekaputra and Prasetiyowati, 2020).
c. Provide recommendations:
Tesco Plc: It is strongly recommended to company that it should focus towards minimising their
overall debts as well as to improve its short-term liquidity position. For this company should
change their credit policies and decrease their dependence over debt funding.
Sainsbury: It is advisable to company that it should emphasise towards their net profitability
level and gross profitability level. For this company should minimise their overall business
expenditures and focus towards increase in sales by effective advertising and promotional
strategies.
d. Limitations of relying on financial ratios
1. Restricted usage of sole ratio
At all specific ratio cannot express any significance. As a consequence, any more ratios are
measured to recognize something through a specific ratio. Perhaps the estimation of multiple
ratios contributes to uncertainty rather than allowing the researcher to come to a proper
conclusion.

2. No comparison between companiesIf the scope and nature of market issues are not
comparable, there really is no chance of an inter-company comparison by way of ratio
review (Minnis and Sutherland, 2017).
3. Total absence of appropriate standards
There really is no norm for ratios. Just thumb guidelines for all proportions are approved and
practiced. The perception of ratio is also complicated.
4. Complex and Deceptive
Proportions can make the comparable analysis more difficult and deceptive in the light of
differences in prices levels.
5. Inherent Constraints of Accounting
The historical essence of the details is considered for the measurement of proportions. The
explanation would be that financial statements are compiled on the basis of historical
knowledge. This is an intrinsic weakness in the accounting process. The proportions are also
not inherently valid measurements of the prospects.
6. Computation and communication period lag
The balance sheet and income only after the conclusion of accounting period but are then
certified by a competent auditor. Such financial reports are issued at conclusion of annual
meeting. It takes between six months to around 9 months. So perhaps the measurement and
communication within an entity of ratios are not used (Williams and Dobelman, 2017).
7. Changes to the Accounting Process
A transition to accounting process applies to a modification in the value of inventory levels.
If, must first market concern uses the FIFO approach for measuring inventory value and then
it is referred to LIFO system. In a somewhat case, valuation of closing inventory is
decreased and the costs of revenue is raised. So then, gross profits and net profits would be
diminished to a degree. In this case, inventory turnover ratio, gross profitability ratio and net
profits ratio are three of the variations (Maina and Sakwa, 2017).
8. No Thorough Examination and Explanation Procedure
Ratio evaluation is not simply an examination and perception methodology. It is used
combined with other methods and strategies to draw some conclusions.
9. Window Dressing
⊘ This is a preview!⊘
Do you want full access?
Subscribe today to unlock all pages.
Trusted by 1+ million students worldwide
1 out of 19
Related Documents


Your All-in-One AI-Powered Toolkit for Academic Success.
+13062052269
info@desklib.com
Available 24*7 on WhatsApp / Email
![[object Object]](/_next/static/media/star-bottom.7253800d.svg)
Unlock your academic potential
Copyright © 2020–2026 A2Z Services. All Rights Reserved. Developed and managed by ZUCOL.