Financial Performance Analysis: Sports Direct vs JD Sports (Finance)

Verified

Added on  2020/06/06

|20
|4942
|34
Report
AI Summary
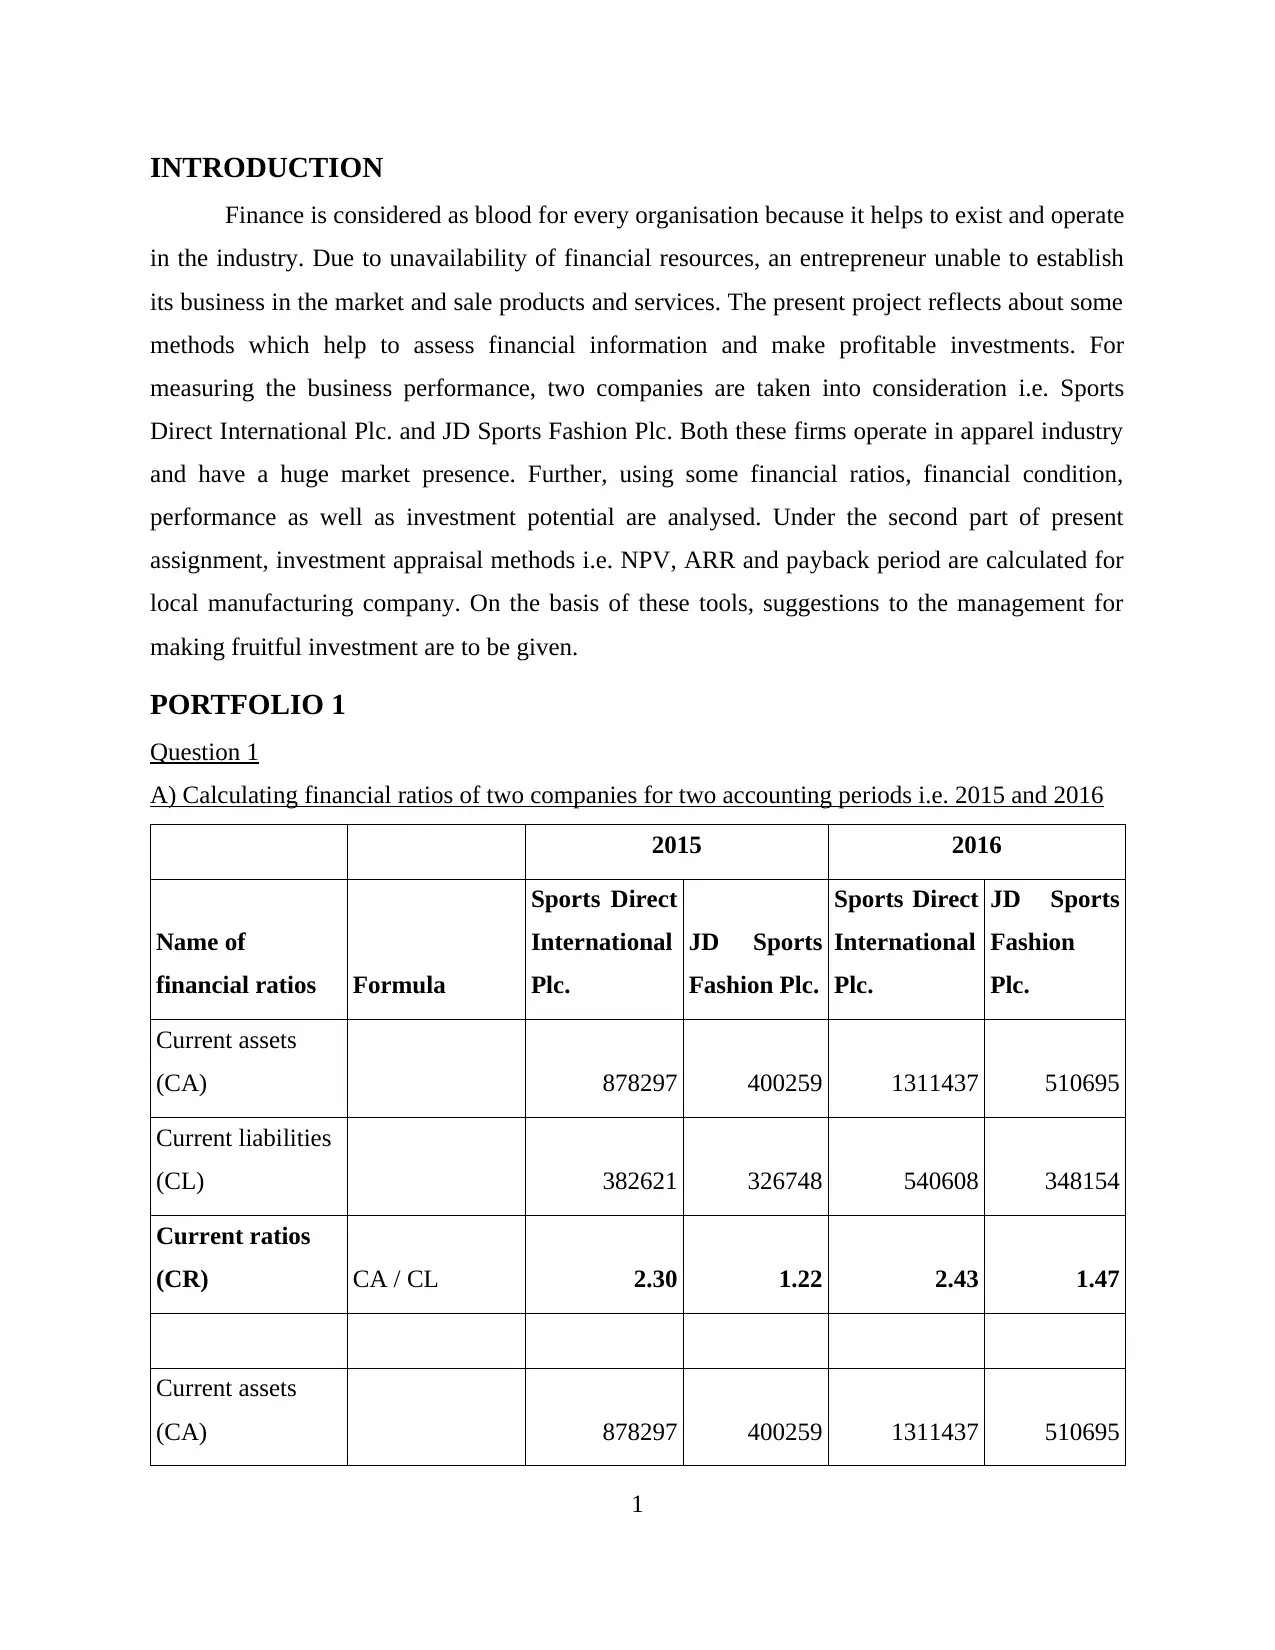
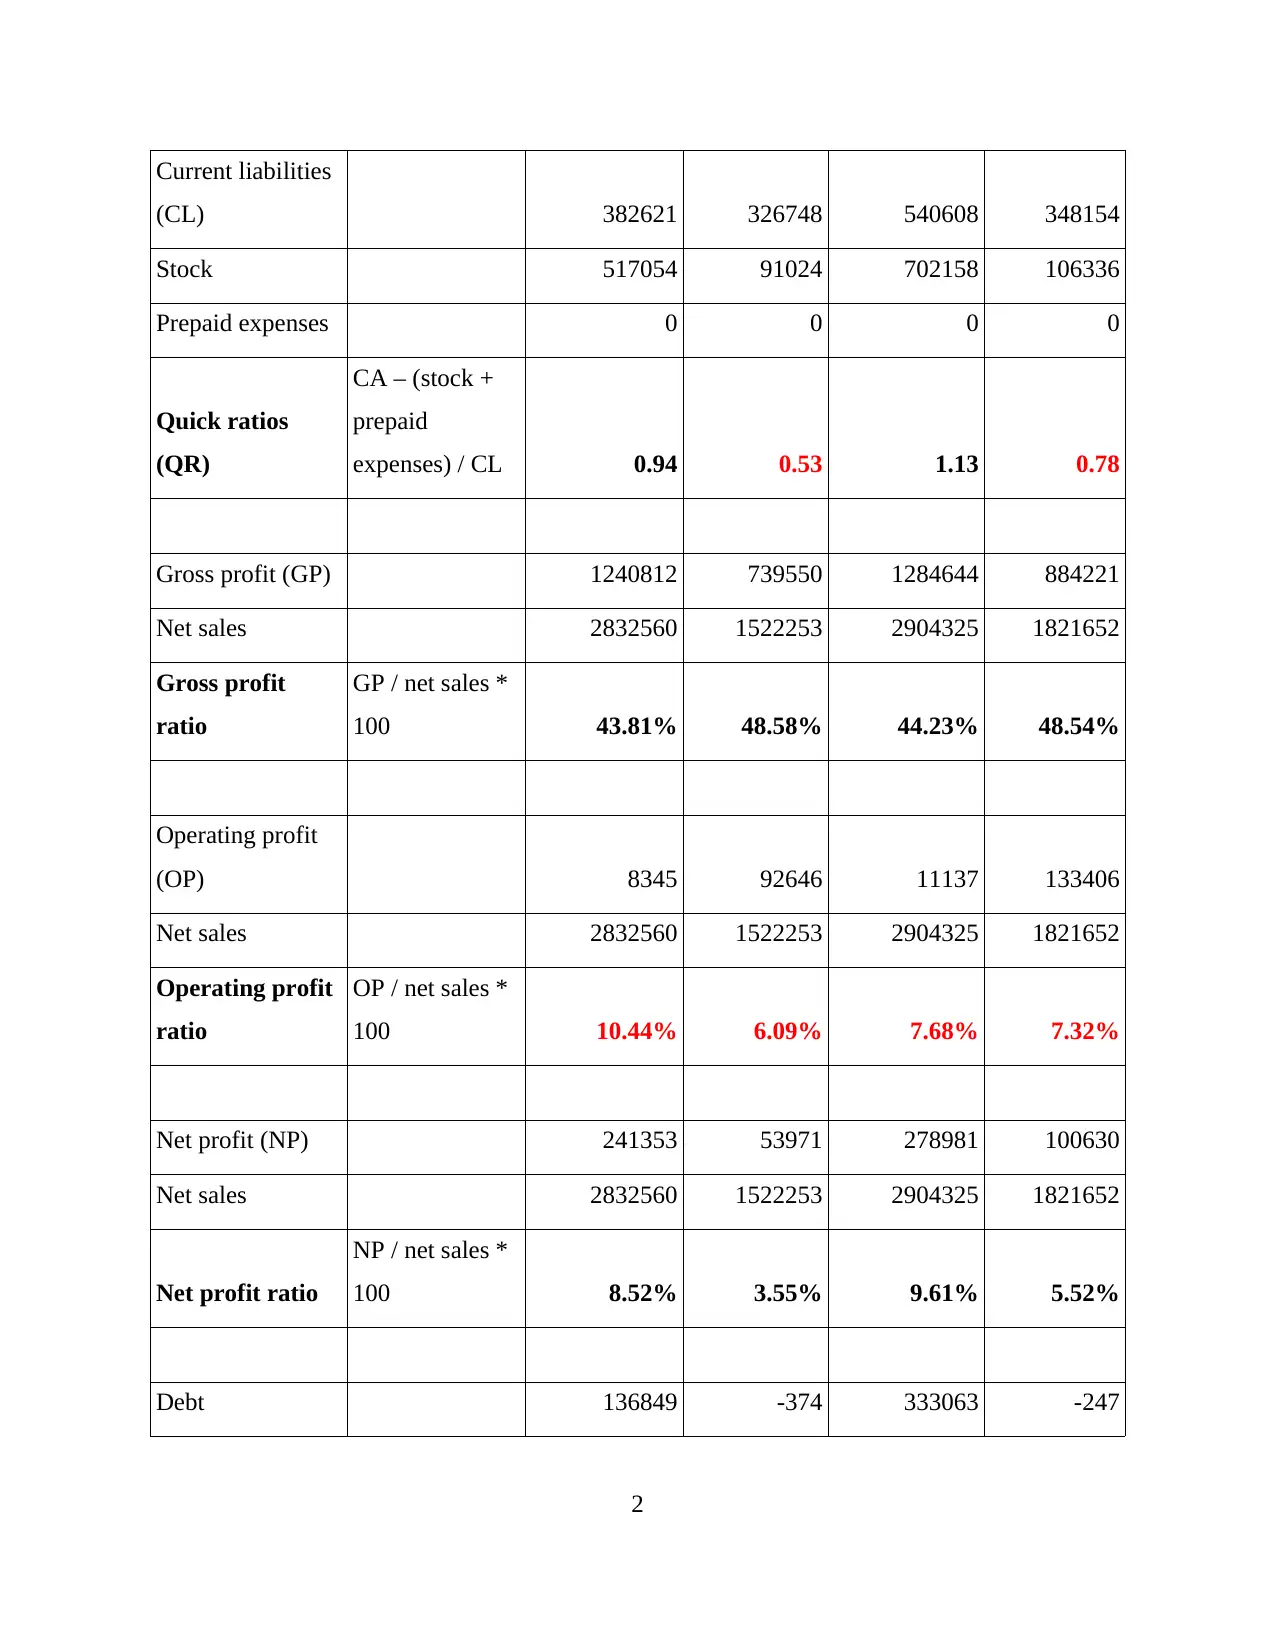
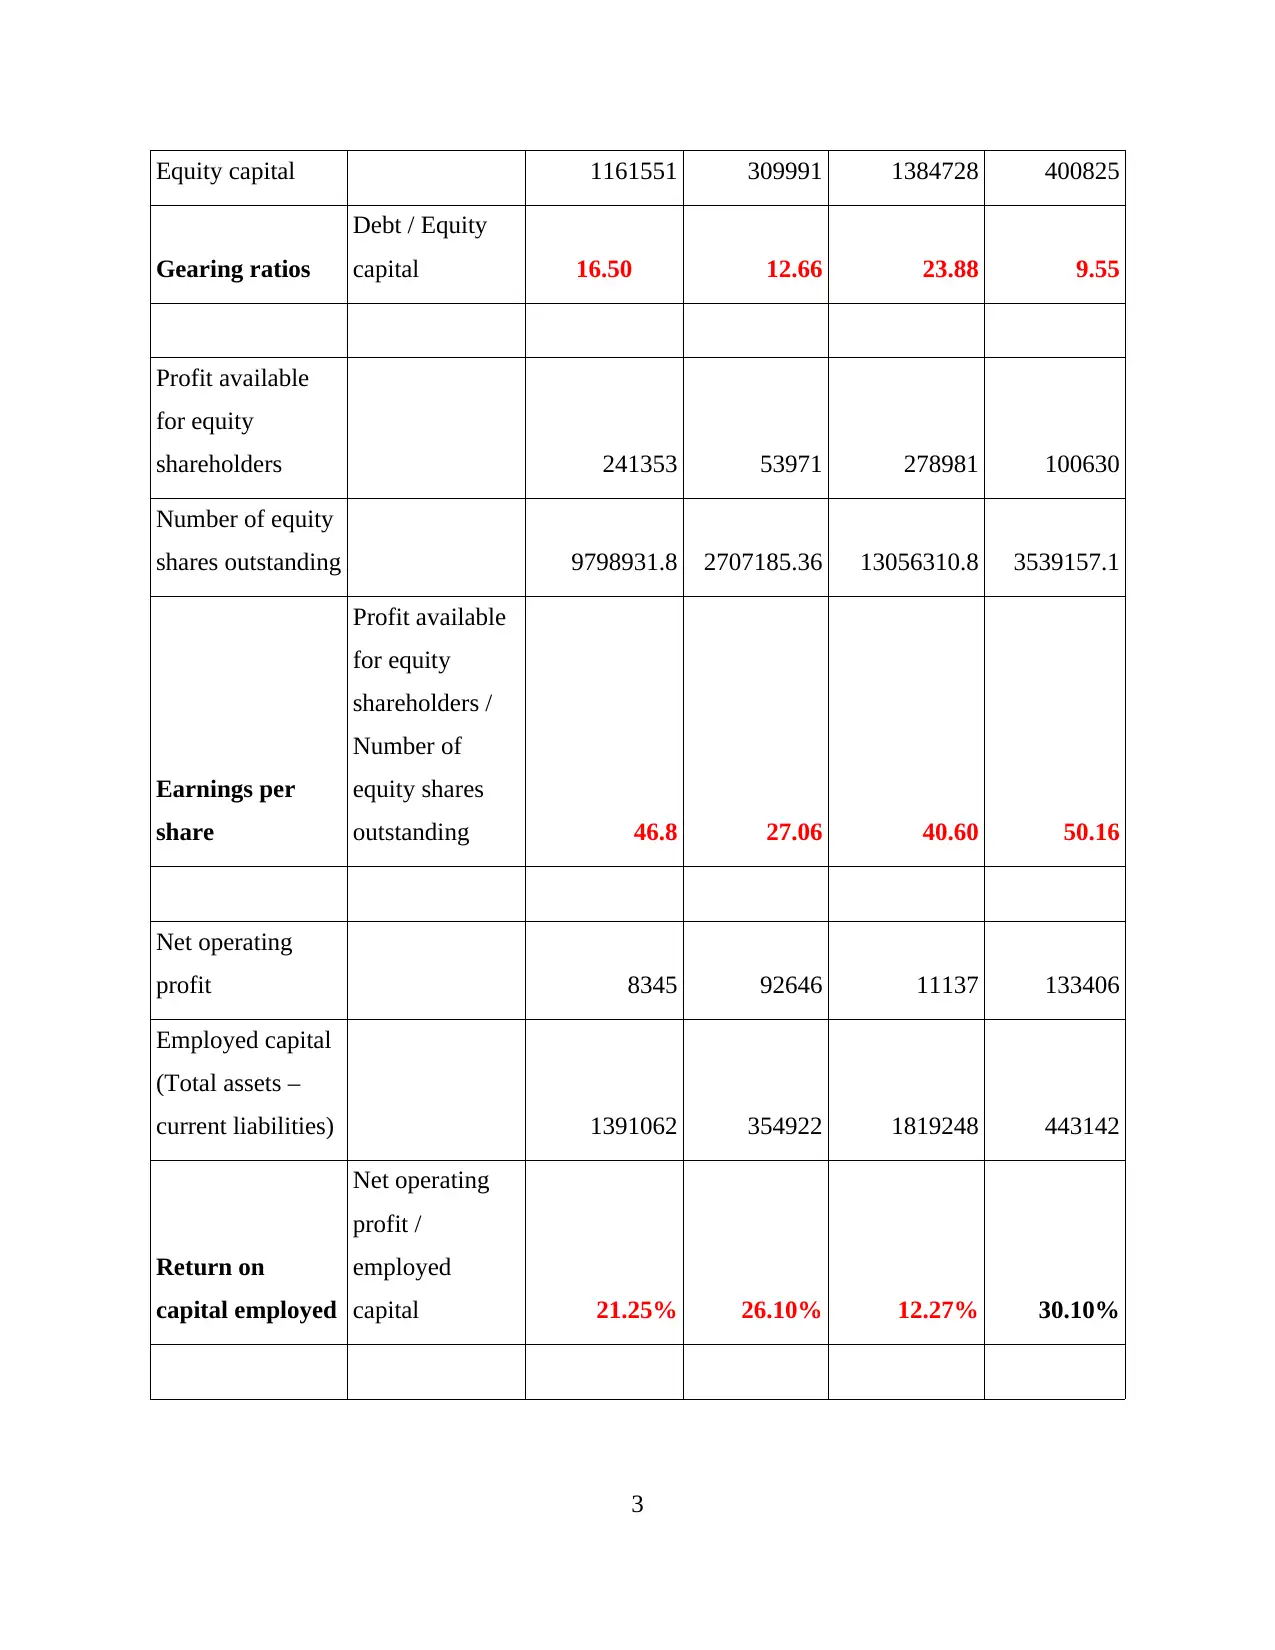
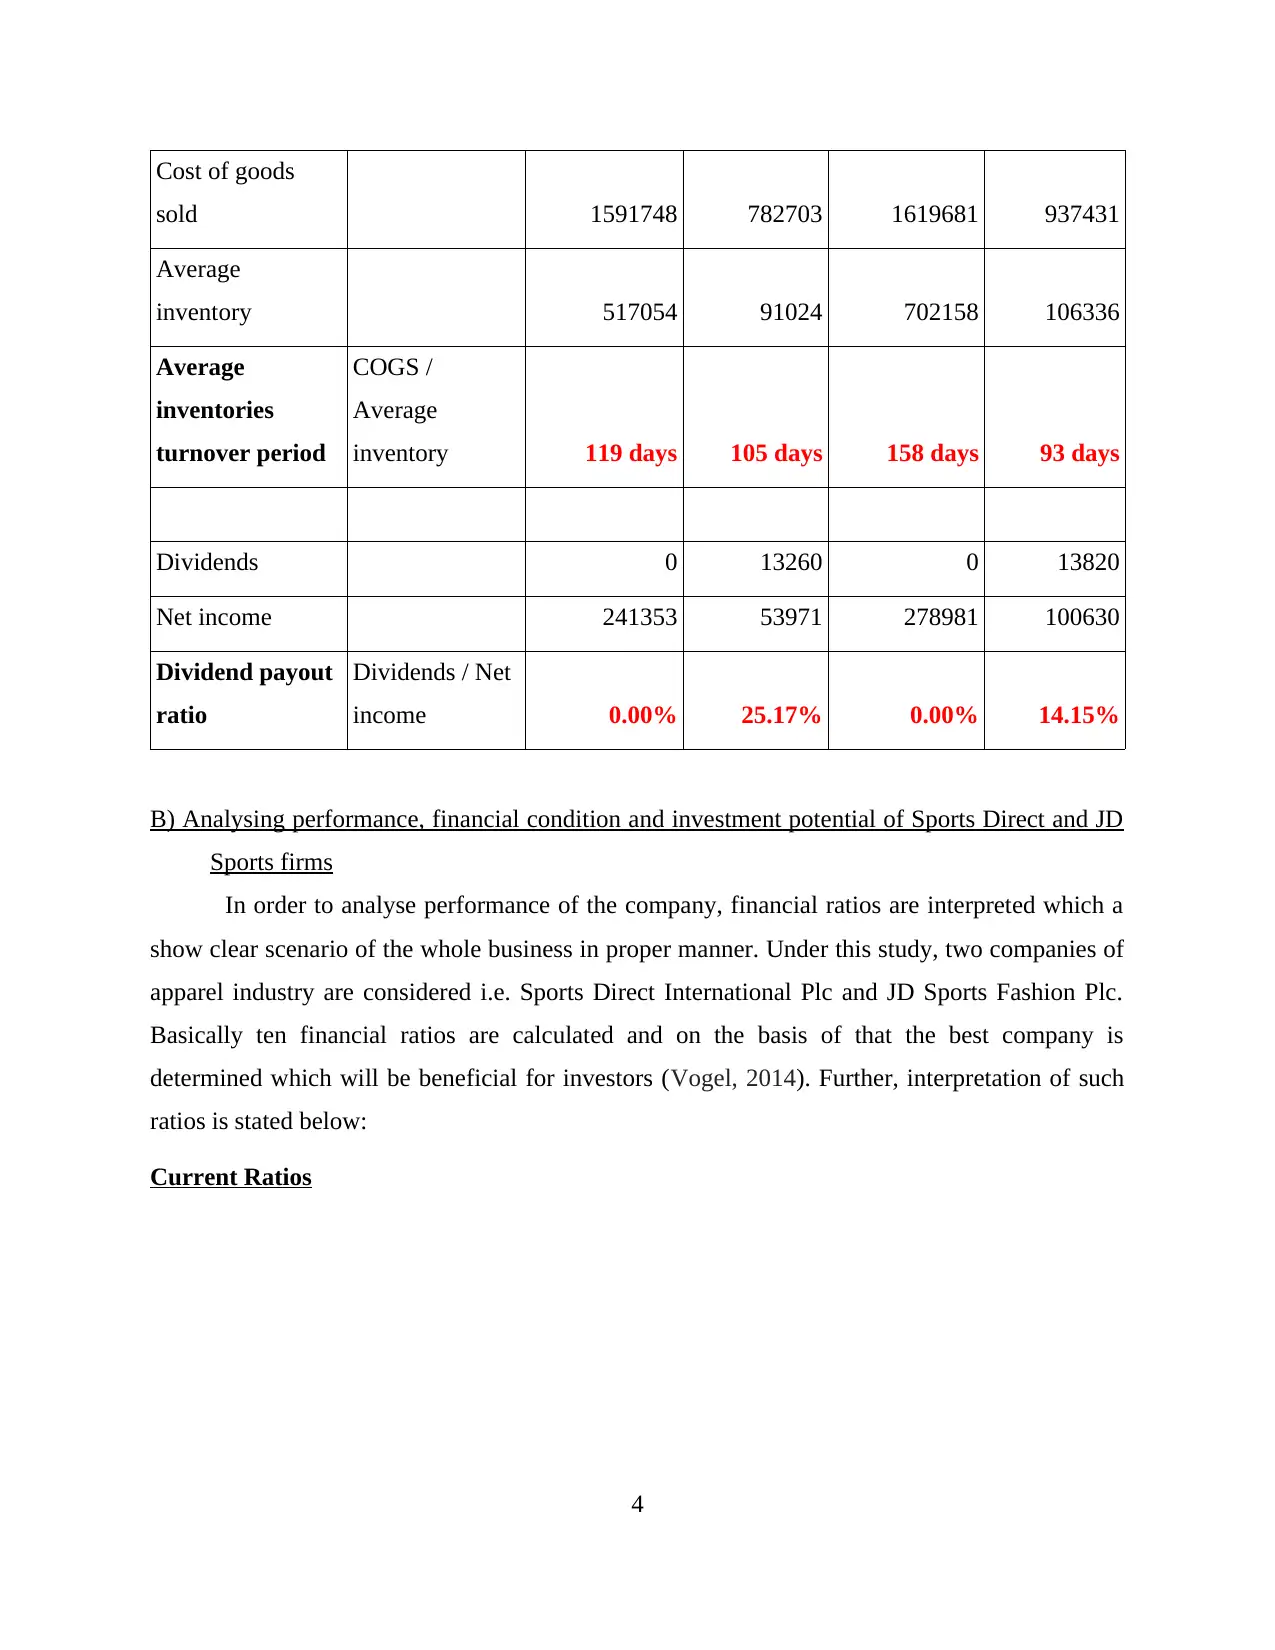
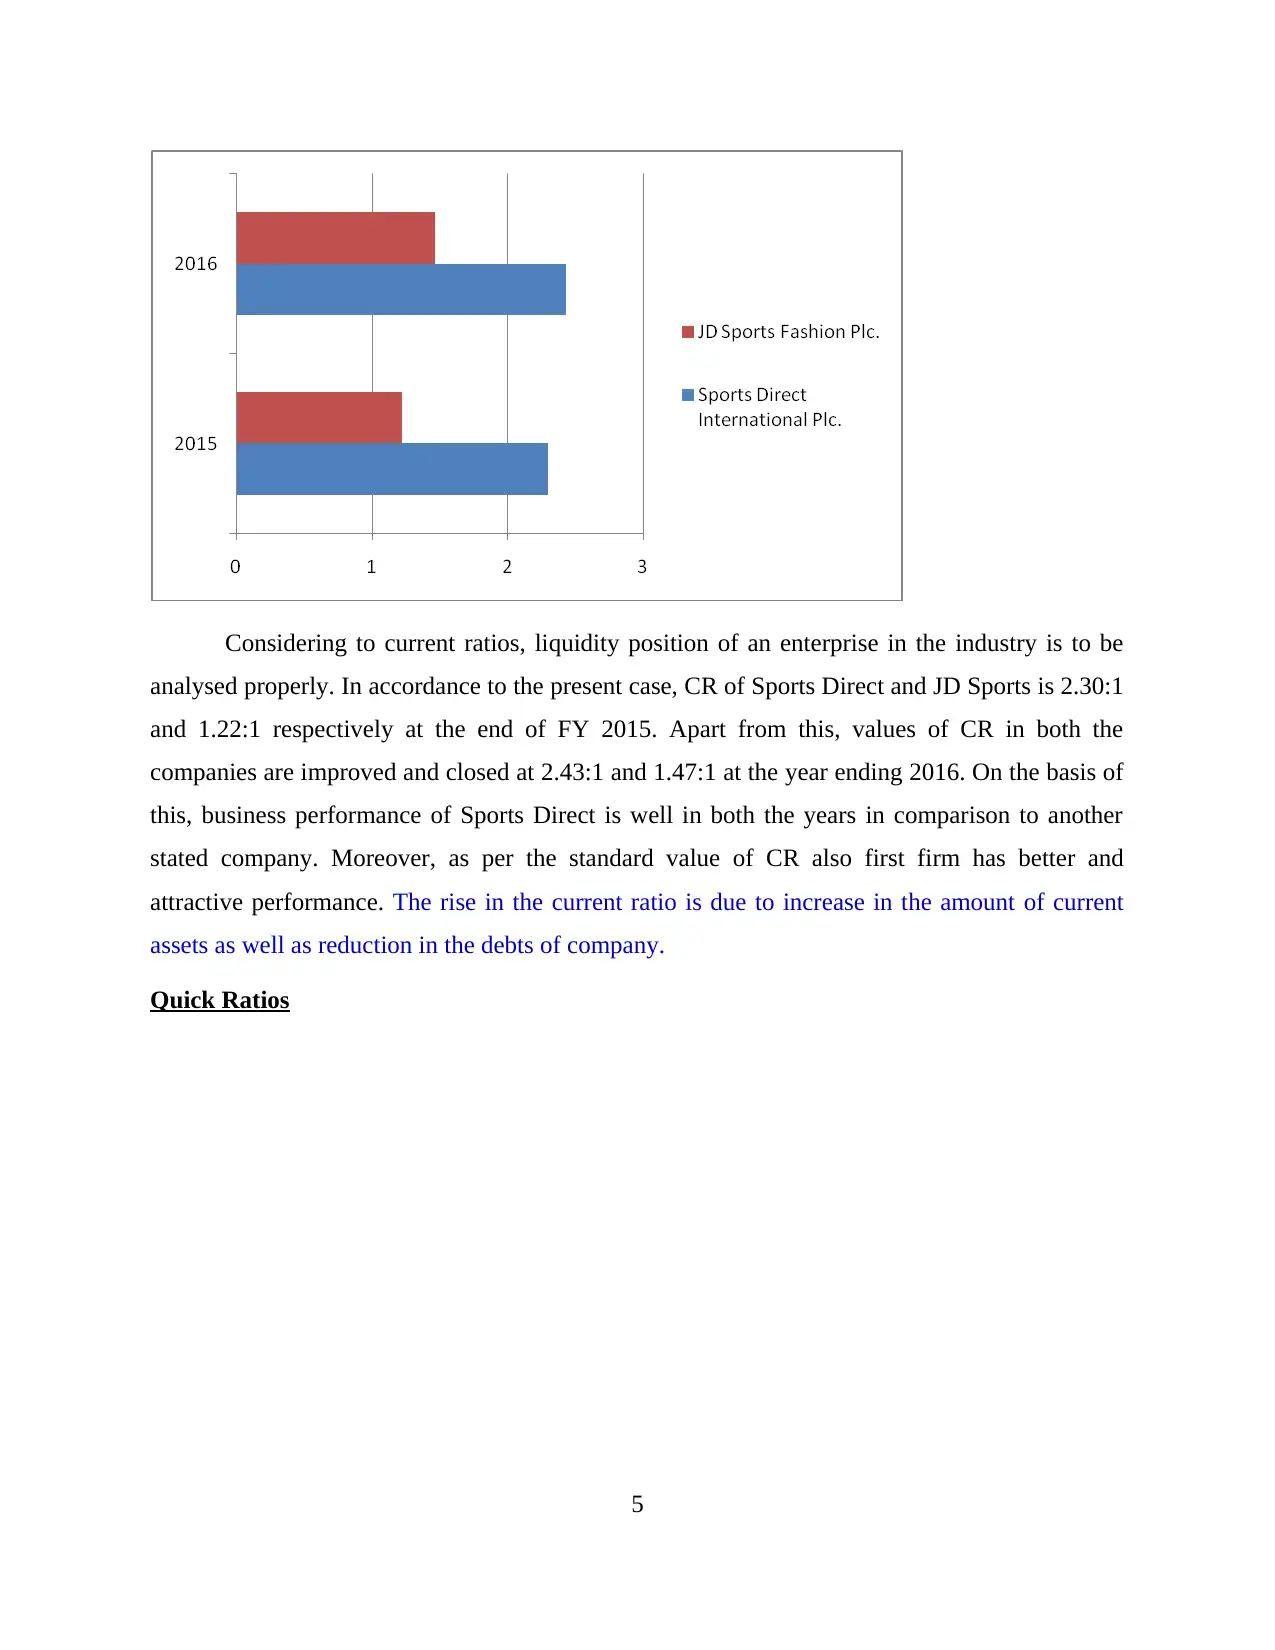
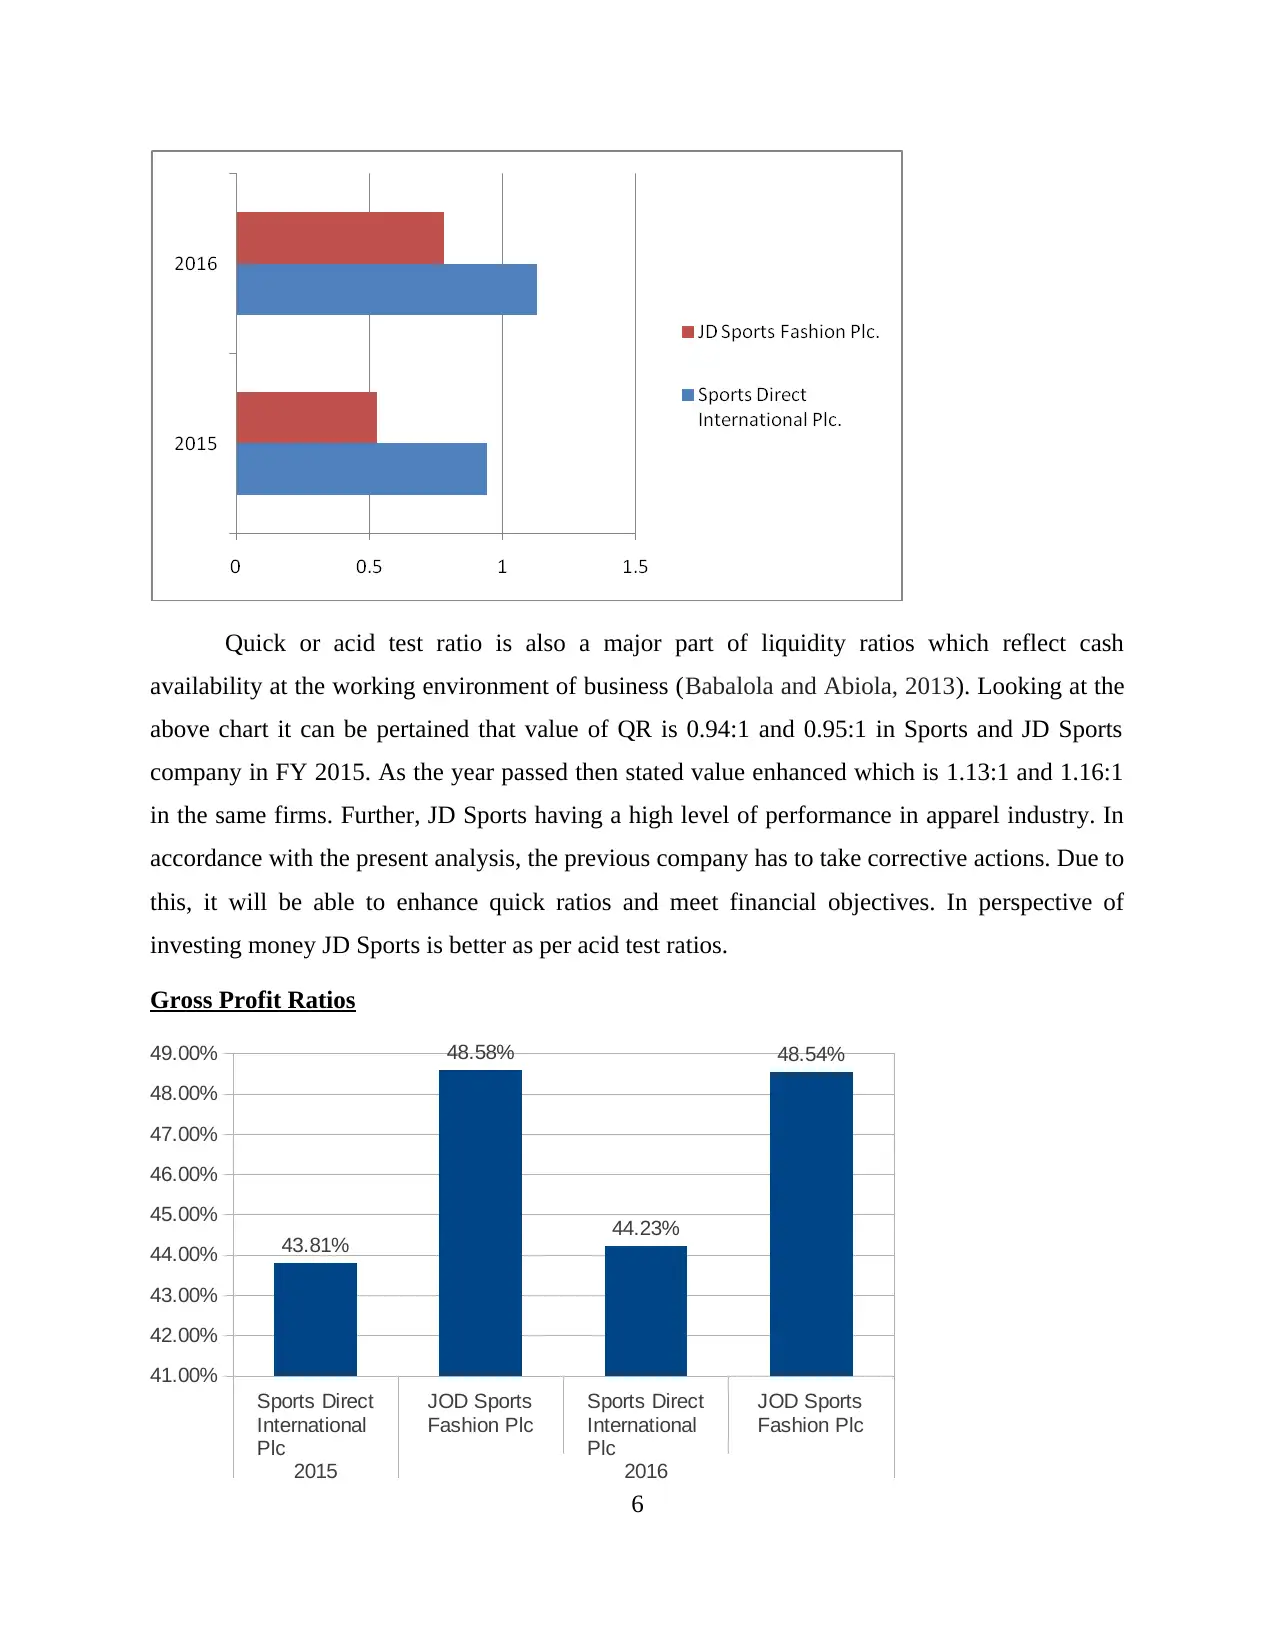
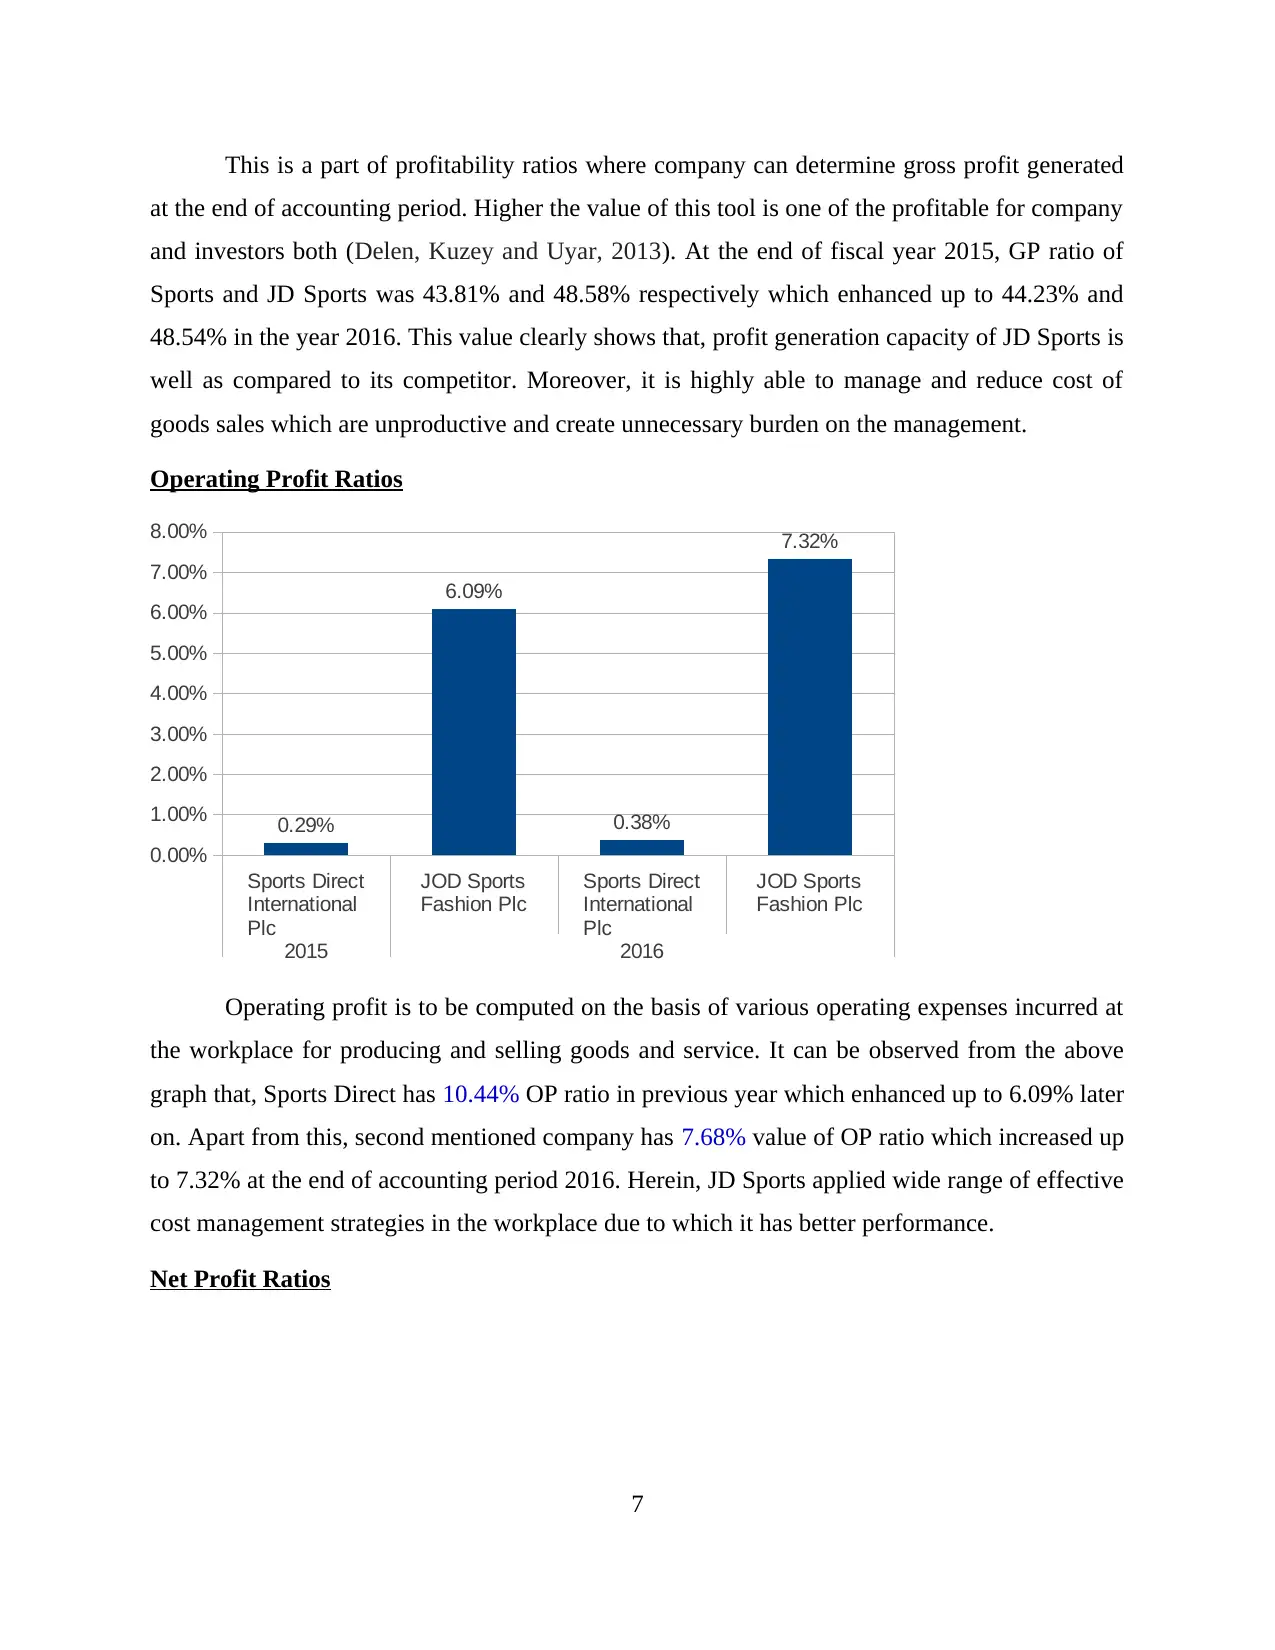
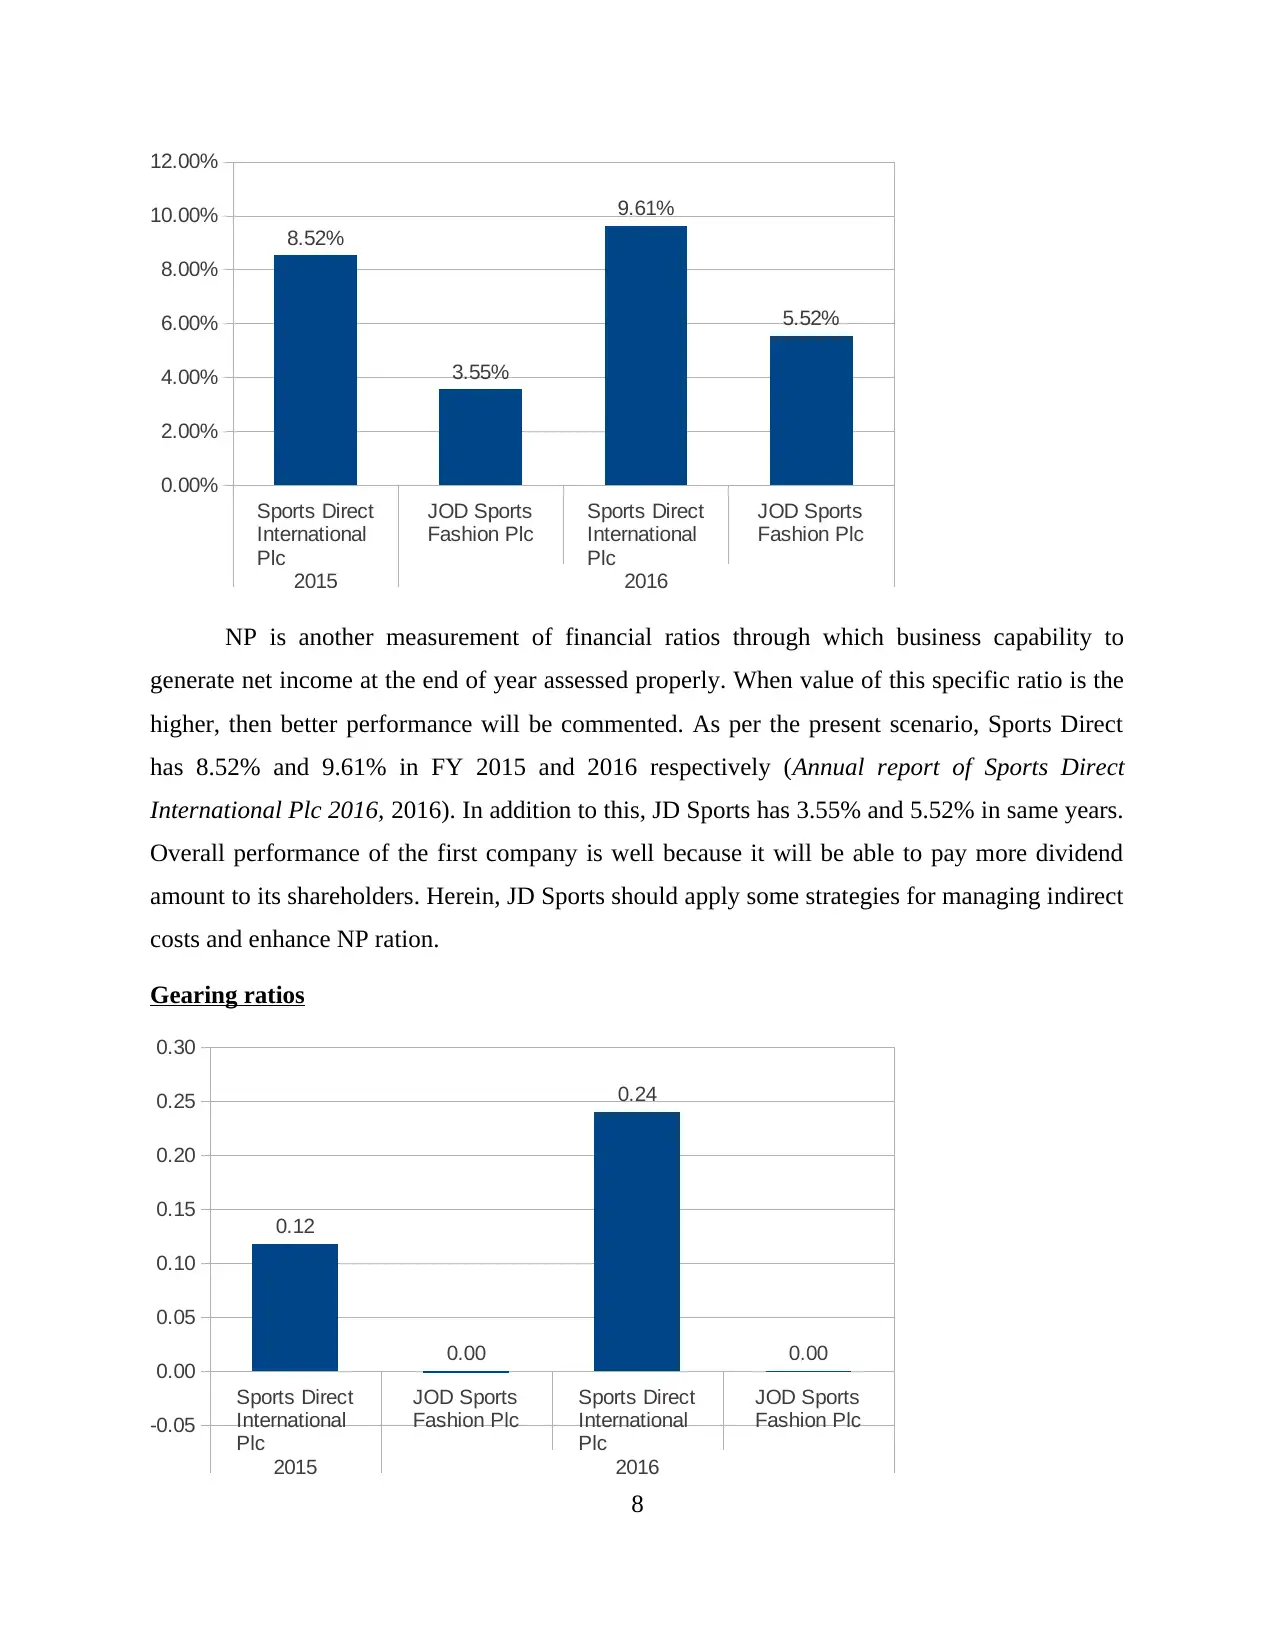
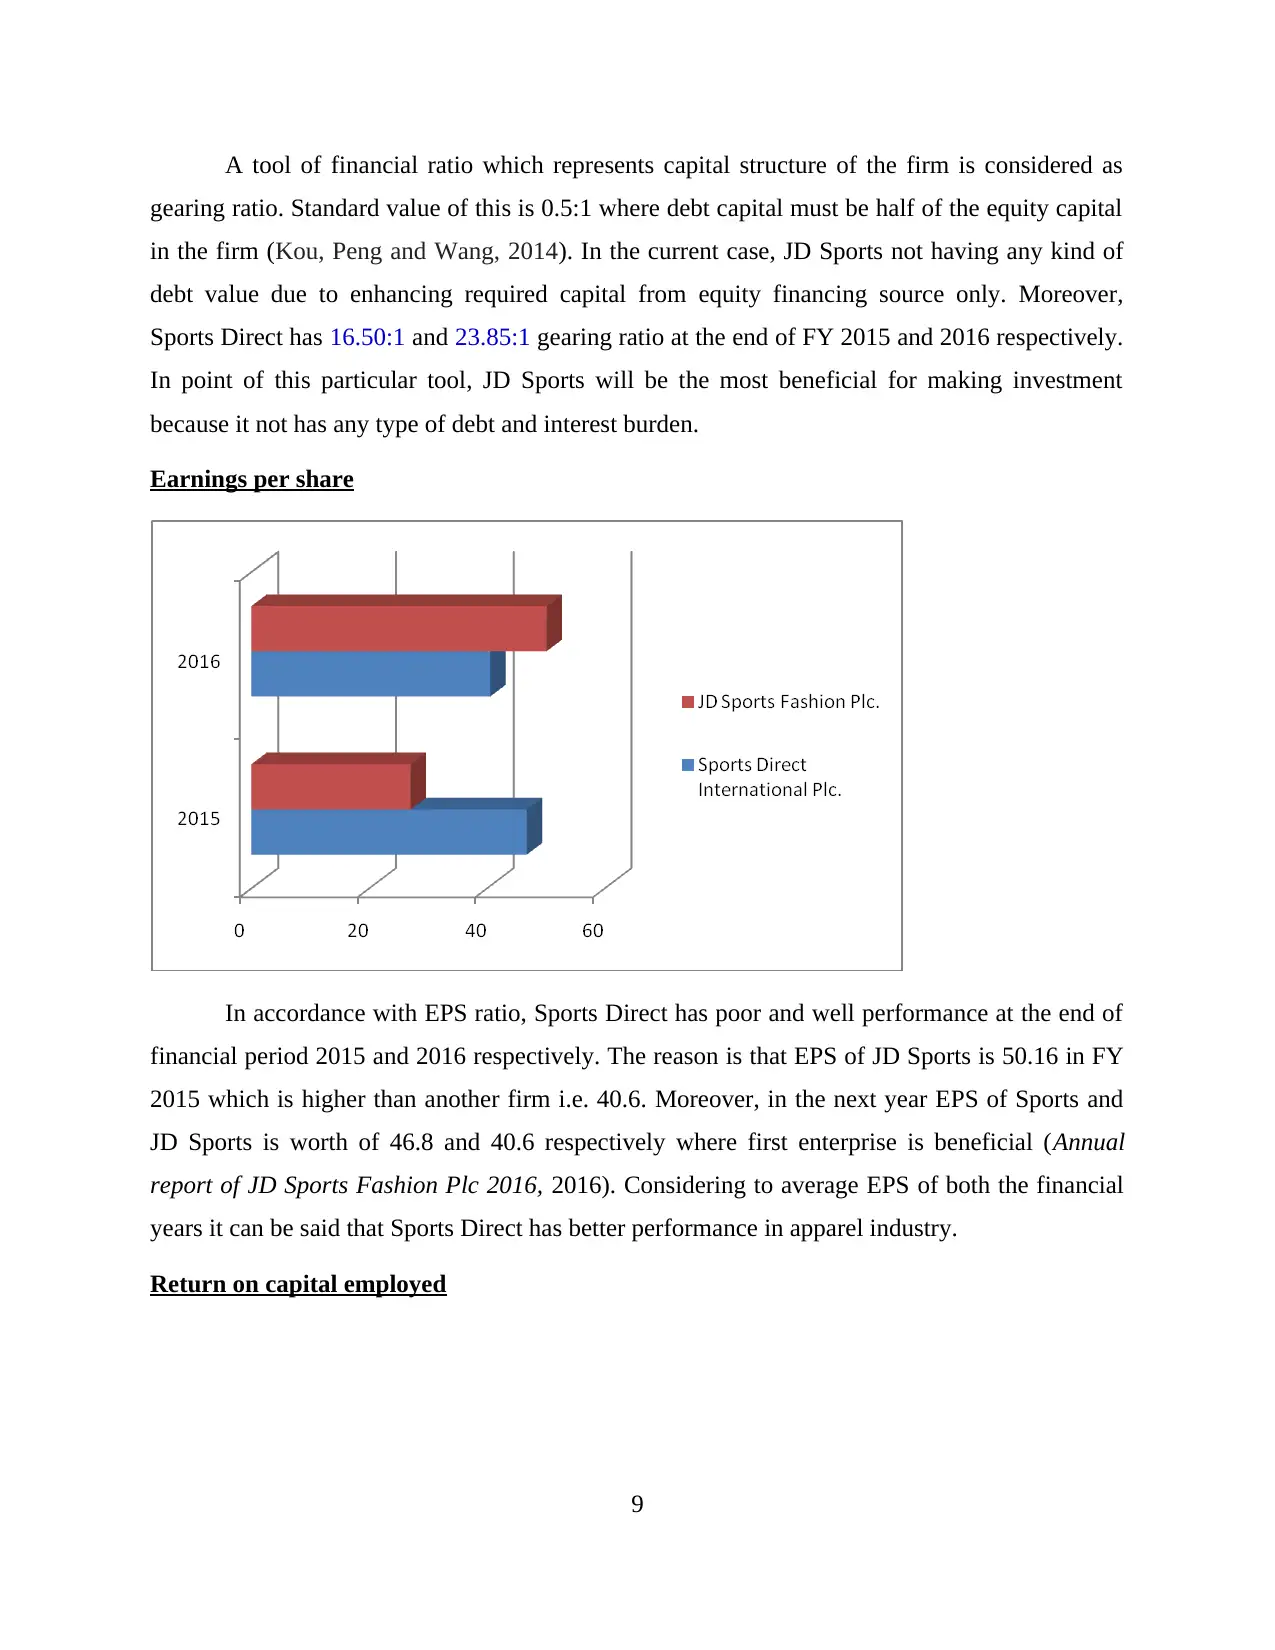
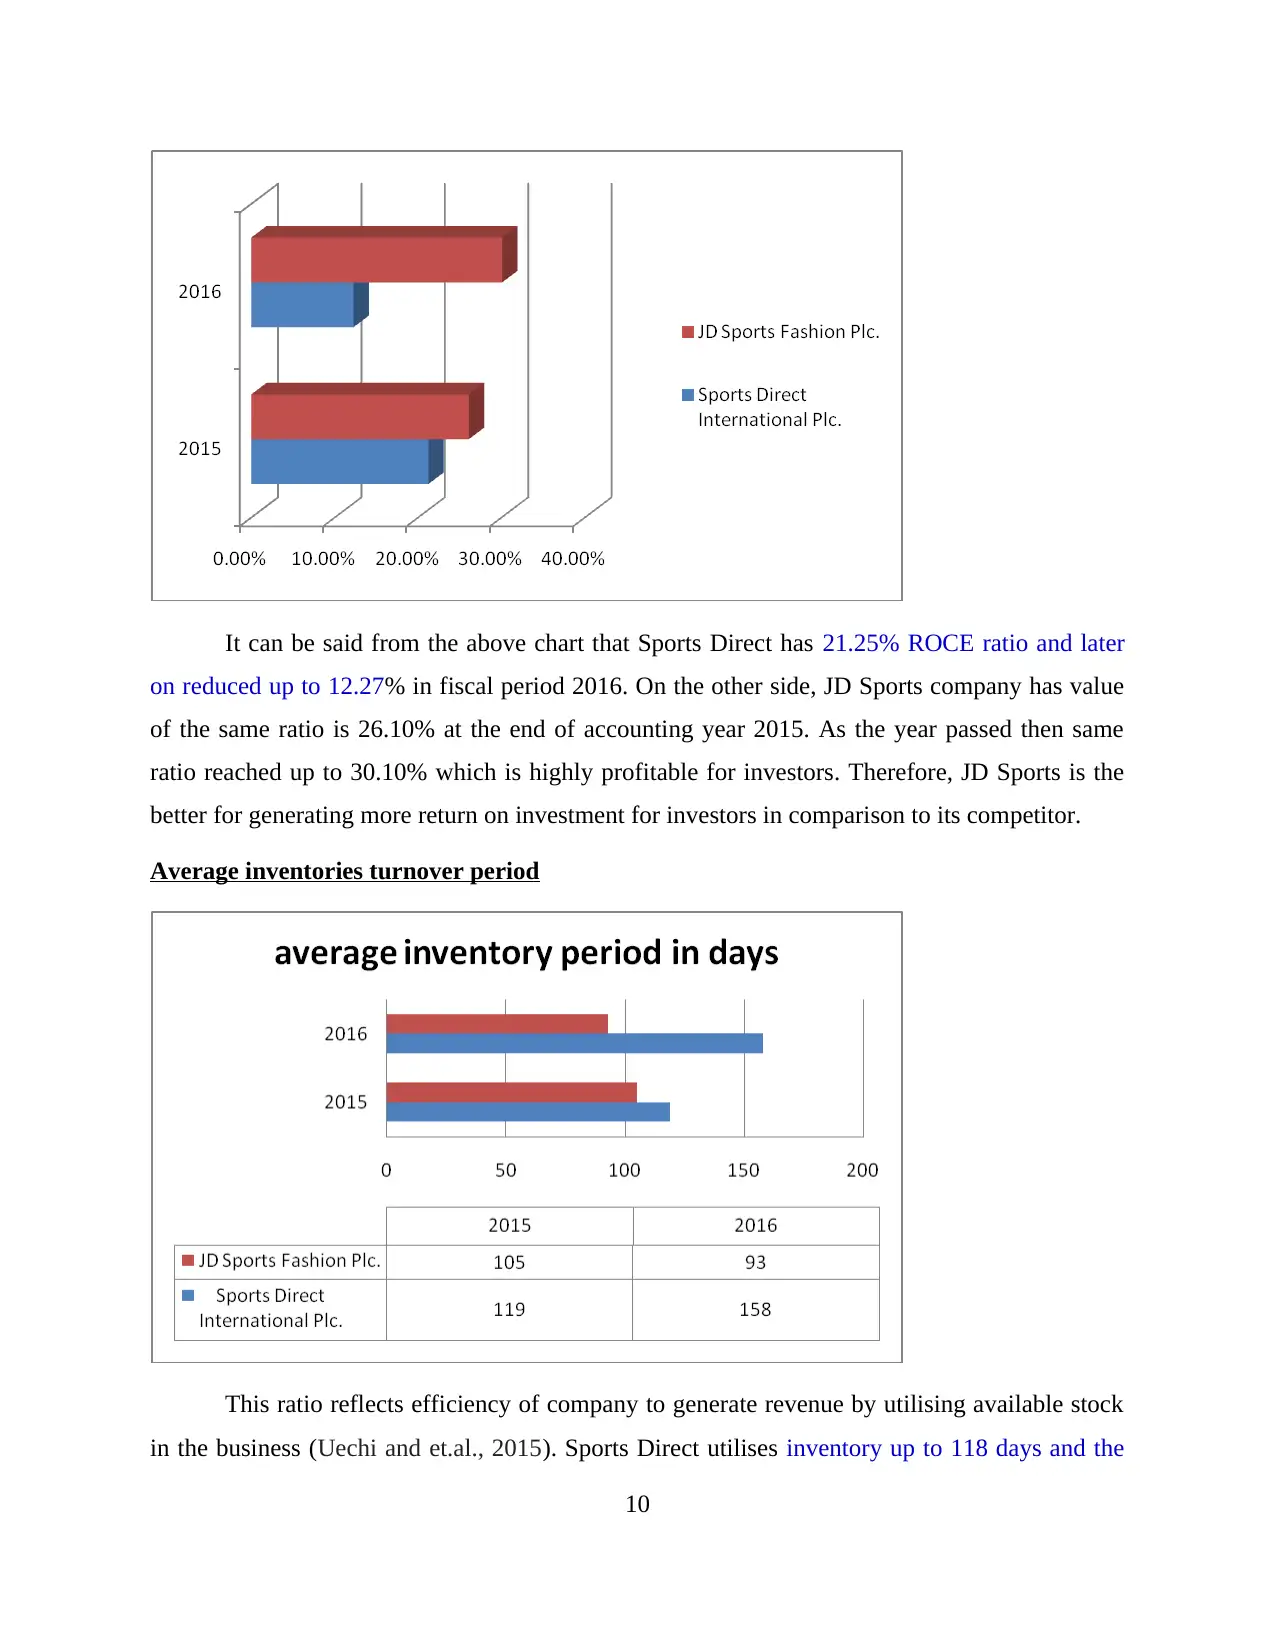
This report provides a comprehensive analysis of the financial performance of Sports Direct and JD Sports Fashion Plc. The analysis is based on financial ratios calculated for the years 2015 and 2016, covering key areas such as liquidity, profitability, and gearing. The report includes the calculation and interpretation of ratios like current ratio, quick ratio, gross profit ratio, operating profit ratio, net profit ratio, gearing ratios, earnings per share, return on capital employed, and average inventory turnover period. Furthermore, the report explores investment appraisal methods, including NPV, ARR, and payback period, and provides recommendations for a local manufacturing company. The report also discusses the limitations of financial ratios and investment appraisal techniques. The findings highlight the strengths and weaknesses of each company, providing insights into their financial health and investment potential.
Document Page
MANAGERIAL FINANCE
tabler-icon-diamond-filled.svg

Paraphrase This Document

Need a fresh take? Get an instant paraphrase of this document with our AI Paraphraser
Document Page
TABLE OF CONTENTS
INTRODUCTION...........................................................................................................................1
PORTFOLIO 1.................................................................................................................................1
Question 1...............................................................................................................................1
A) Calculating financial ratios of two companies for two accounting periods i.e. 2015 and
2016........................................................................................................................................1
B) Analysing performance, financial condition and investment potential of Sports Direct and
JD Sports firms.......................................................................................................................4
C) Providing appropriate suggestions to the firm which has poor financial performance...11
D) Discussing drawbacks of financial ratios which used to analyse firm's performance....11
PORTFOLIO 2...............................................................................................................................12
Question 2.............................................................................................................................12
A) Use of basic investment appraisal methods and suggestions to management of a local
manufacturing enterprise......................................................................................................12
B) Discussing limitations associated with investment appraisal technique for taking long-term
decisions...............................................................................................................................15
CONCLUSION..............................................................................................................................16
REFERENCES..............................................................................................................................17
Document Page
INTRODUCTION
Finance is considered as blood for every organisation because it helps to exist and operate
in the industry. Due to unavailability of financial resources, an entrepreneur unable to establish
its business in the market and sale products and services. The present project reflects about some
methods which help to assess financial information and make profitable investments. For
measuring the business performance, two companies are taken into consideration i.e. Sports
Direct International Plc. and JD Sports Fashion Plc. Both these firms operate in apparel industry
and have a huge market presence. Further, using some financial ratios, financial condition,
performance as well as investment potential are analysed. Under the second part of present
assignment, investment appraisal methods i.e. NPV, ARR and payback period are calculated for
local manufacturing company. On the basis of these tools, suggestions to the management for
making fruitful investment are to be given.
PORTFOLIO 1
Question 1
A) Calculating financial ratios of two companies for two accounting periods i.e. 2015 and 2016
2015 2016
Name of
financial ratios Formula
Sports Direct
International
Plc.
JD Sports
Fashion Plc.
Sports Direct
International
Plc.
JD Sports
Fashion
Plc.
Current assets
(CA) 878297 400259 1311437 510695
Current liabilities
(CL) 382621 326748 540608 348154
Current ratios
(CR) CA / CL 2.30 1.22 2.43 1.47
Current assets
(CA) 878297 400259 1311437 510695
1
Document Page
Current liabilities
(CL) 382621 326748 540608 348154
Stock 517054 91024 702158 106336
Prepaid expenses 0 0 0 0
Quick ratios
(QR)
CA – (stock +
prepaid
expenses) / CL 0.94 0.53 1.13 0.78
Gross profit (GP) 1240812 739550 1284644 884221
Net sales 2832560 1522253 2904325 1821652
Gross profit
ratio
GP / net sales *
100 43.81% 48.58% 44.23% 48.54%
Operating profit
(OP) 8345 92646 11137 133406
Net sales 2832560 1522253 2904325 1821652
Operating profit
ratio
OP / net sales *
100 10.44% 6.09% 7.68% 7.32%
Net profit (NP) 241353 53971 278981 100630
Net sales 2832560 1522253 2904325 1821652
Net profit ratio
NP / net sales *
100 8.52% 3.55% 9.61% 5.52%
Debt 136849 -374 333063 -247
2
tabler-icon-diamond-filled.svg

Paraphrase This Document

Need a fresh take? Get an instant paraphrase of this document with our AI Paraphraser
Document Page
Equity capital 1161551 309991 1384728 400825
Gearing ratios
Debt / Equity
capital 16.50 12.66 23.88 9.55
Profit available
for equity
shareholders 241353 53971 278981 100630
Number of equity
shares outstanding 9798931.8 2707185.36 13056310.8 3539157.1
Earnings per
share
Profit available
for equity
shareholders /
Number of
equity shares
outstanding 46.8 27.06 40.60 50.16
Net operating
profit 8345 92646 11137 133406
Employed capital
(Total assets –
current liabilities) 1391062 354922 1819248 443142
Return on
capital employed
Net operating
profit /
employed
capital 21.25% 26.10% 12.27% 30.10%
3
Document Page
Cost of goods
sold 1591748 782703 1619681 937431
Average
inventory 517054 91024 702158 106336
Average
inventories
turnover period
COGS /
Average
inventory 119 days 105 days 158 days 93 days
Dividends 0 13260 0 13820
Net income 241353 53971 278981 100630
Dividend payout
ratio
Dividends / Net
income 0.00% 25.17% 0.00% 14.15%
B) Analysing performance, financial condition and investment potential of Sports Direct and JD
Sports firms
In order to analyse performance of the company, financial ratios are interpreted which a
show clear scenario of the whole business in proper manner. Under this study, two companies of
apparel industry are considered i.e. Sports Direct International Plc and JD Sports Fashion Plc.
Basically ten financial ratios are calculated and on the basis of that the best company is
determined which will be beneficial for investors (Vogel, 2014). Further, interpretation of such
ratios is stated below:
Current Ratios
4
Document Page
Considering to current ratios, liquidity position of an enterprise in the industry is to be
analysed properly. In accordance to the present case, CR of Sports Direct and JD Sports is 2.30:1
and 1.22:1 respectively at the end of FY 2015. Apart from this, values of CR in both the
companies are improved and closed at 2.43:1 and 1.47:1 at the year ending 2016. On the basis of
this, business performance of Sports Direct is well in both the years in comparison to another
stated company. Moreover, as per the standard value of CR also first firm has better and
attractive performance. The rise in the current ratio is due to increase in the amount of current
assets as well as reduction in the debts of company.
Quick Ratios
5
tabler-icon-diamond-filled.svg

Paraphrase This Document

Need a fresh take? Get an instant paraphrase of this document with our AI Paraphraser
Document Page
Quick or acid test ratio is also a major part of liquidity ratios which reflect cash
availability at the working environment of business (Babalola and Abiola, 2013). Looking at the
above chart it can be pertained that value of QR is 0.94:1 and 0.95:1 in Sports and JD Sports
company in FY 2015. As the year passed then stated value enhanced which is 1.13:1 and 1.16:1
in the same firms. Further, JD Sports having a high level of performance in apparel industry. In
accordance with the present analysis, the previous company has to take corrective actions. Due to
this, it will be able to enhance quick ratios and meet financial objectives. In perspective of
investing money JD Sports is better as per acid test ratios.
Gross Profit Ratios
Sports Direct
International
Plc
JOD Sports
Fashion Plc
Sports Direct
International
Plc
JOD Sports
Fashion Plc
2015 2016
41.00%
42.00%
43.00%
44.00%
45.00%
46.00%
47.00%
48.00%
49.00%
43.81%
48.58%
44.23%
48.54%
6
Document Page
This is a part of profitability ratios where company can determine gross profit generated
at the end of accounting period. Higher the value of this tool is one of the profitable for company
and investors both (Delen, Kuzey and Uyar, 2013). At the end of fiscal year 2015, GP ratio of
Sports and JD Sports was 43.81% and 48.58% respectively which enhanced up to 44.23% and
48.54% in the year 2016. This value clearly shows that, profit generation capacity of JD Sports is
well as compared to its competitor. Moreover, it is highly able to manage and reduce cost of
goods sales which are unproductive and create unnecessary burden on the management.
Operating Profit Ratios
Sports Direct
International
Plc
JOD Sports
Fashion Plc
Sports Direct
International
Plc
JOD Sports
Fashion Plc
2015 2016
0.00%
1.00%
2.00%
3.00%
4.00%
5.00%
6.00%
7.00%
8.00%
0.29%
6.09%
0.38%
7.32%
Operating profit is to be computed on the basis of various operating expenses incurred at
the workplace for producing and selling goods and service. It can be observed from the above
graph that, Sports Direct has 10.44% OP ratio in previous year which enhanced up to 6.09% later
on. Apart from this, second mentioned company has 7.68% value of OP ratio which increased up
to 7.32% at the end of accounting period 2016. Herein, JD Sports applied wide range of effective
cost management strategies in the workplace due to which it has better performance.
Net Profit Ratios
7
Document Page
Sports Direct
International
Plc
JOD Sports
Fashion Plc
Sports Direct
International
Plc
JOD Sports
Fashion Plc
2015 2016
0.00%
2.00%
4.00%
6.00%
8.00%
10.00%
12.00%
8.52%
3.55%
9.61%
5.52%
NP is another measurement of financial ratios through which business capability to
generate net income at the end of year assessed properly. When value of this specific ratio is the
higher, then better performance will be commented. As per the present scenario, Sports Direct
has 8.52% and 9.61% in FY 2015 and 2016 respectively (Annual report of Sports Direct
International Plc 2016, 2016). In addition to this, JD Sports has 3.55% and 5.52% in same years.
Overall performance of the first company is well because it will be able to pay more dividend
amount to its shareholders. Herein, JD Sports should apply some strategies for managing indirect
costs and enhance NP ration.
Gearing ratios
Sports Direct
International
Plc
JOD Sports
Fashion Plc
Sports Direct
International
Plc
JOD Sports
Fashion Plc
2015 2016
-0.05
0.00
0.05
0.10
0.15
0.20
0.25
0.30
0.12
0.00
0.24
0.00
8
tabler-icon-diamond-filled.svg

Paraphrase This Document

Need a fresh take? Get an instant paraphrase of this document with our AI Paraphraser
Document Page
A tool of financial ratio which represents capital structure of the firm is considered as
gearing ratio. Standard value of this is 0.5:1 where debt capital must be half of the equity capital
in the firm (Kou, Peng and Wang, 2014). In the current case, JD Sports not having any kind of
debt value due to enhancing required capital from equity financing source only. Moreover,
Sports Direct has 16.50:1 and 23.85:1 gearing ratio at the end of FY 2015 and 2016 respectively.
In point of this particular tool, JD Sports will be the most beneficial for making investment
because it not has any type of debt and interest burden.
Earnings per share
In accordance with EPS ratio, Sports Direct has poor and well performance at the end of
financial period 2015 and 2016 respectively. The reason is that EPS of JD Sports is 50.16 in FY
2015 which is higher than another firm i.e. 40.6. Moreover, in the next year EPS of Sports and
JD Sports is worth of 46.8 and 40.6 respectively where first enterprise is beneficial (Annual
report of JD Sports Fashion Plc 2016, 2016). Considering to average EPS of both the financial
years it can be said that Sports Direct has better performance in apparel industry.
Return on capital employed
9
Document Page
It can be said from the above chart that Sports Direct has 21.25% ROCE ratio and later
on reduced up to 12.27% in fiscal period 2016. On the other side, JD Sports company has value
of the same ratio is 26.10% at the end of accounting year 2015. As the year passed then same
ratio reached up to 30.10% which is highly profitable for investors. Therefore, JD Sports is the
better for generating more return on investment for investors in comparison to its competitor.
Average inventories turnover period
This ratio reflects efficiency of company to generate revenue by utilising available stock
in the business (Uechi and et.al., 2015). Sports Direct utilises inventory up to 118 days and the
10
chevron_up_icon
1 out of 20
circle_padding
hide_on_mobile
zoom_out_icon
[object Object]