Managerial Finance Report: Financial Performance Analysis
VerifiedAdded on 2022/11/24
|19
|4171
|50
Report
AI Summary
This report delves into managerial finance, examining the financial performance, position, and investment potential of Tesco PLC and Sainsbury PLC. It employs ratio analysis to evaluate profitability, liquidity, and gearing, comparing the companies' performance in 2018 and 2019. The report also explores investment appraisal techniques and their limitations in long-term decision-making. It provides recommendations for improving financial performance and highlights the shortcomings of relying solely on financial ratios. The analysis includes current ratio, quick ratio, net profit margin, gross profit margin, gearing ratio, price to earnings ratio, earnings per share, return on capital employed, average inventory turnover period, and dividend payout ratio. The report provides a comprehensive overview of financial analysis and investment strategies.

Managerial Finance
Paraphrase This Document
Need a fresh take? Get an instant paraphrase of this document with our AI Paraphraser

Contents
INTRODUCTION...........................................................................................................................3
PORTFOLIO 1................................................................................................................................3
Ratio analysis...............................................................................................................................3
Analysis of financial performance, position and investment potential of both companies.........5
Recommendations on improving financial performance of poorly performing business.........11
Limitations of relying on financial ratios..................................................................................11
PORTFOLIO 2..............................................................................................................................13
Investment Appraisal techniques...............................................................................................13
Limitations of using investment appraisal techniques in long term decision making...............14
CONCLUSION..............................................................................................................................16
REFERENCES..............................................................................................................................17
⊘ This is a preview!⊘
Do you want full access?
Subscribe today to unlock all pages.
Trusted by 1+ million students worldwide
INTRODUCTION
Finance is the backbone of solid management, profitability, and development in a firm,
therefore business decision is important. It entails making prudent judgments about the capital
structure and condition. This study examines two firms' business decision from the perspective
of investors, as well as investing assessment methodologies from the perspective of management.
It's split into two halves (Salehi, Daemi and Akbari, 2020). The first portfolio uses ratio analysis
to examine Sainsbury PLC and Tesco PLC's profitability, positioning, and future value. Ratio
analysis' shortcomings in assessing a company's success are also highlighted. There are also
suggestions for enhancing the competitiveness of underperforming firms. The second portfolio
examines capital investment assessment methodologies and their limits in establishing long -
term business decisions.
PORTFOLIO 1
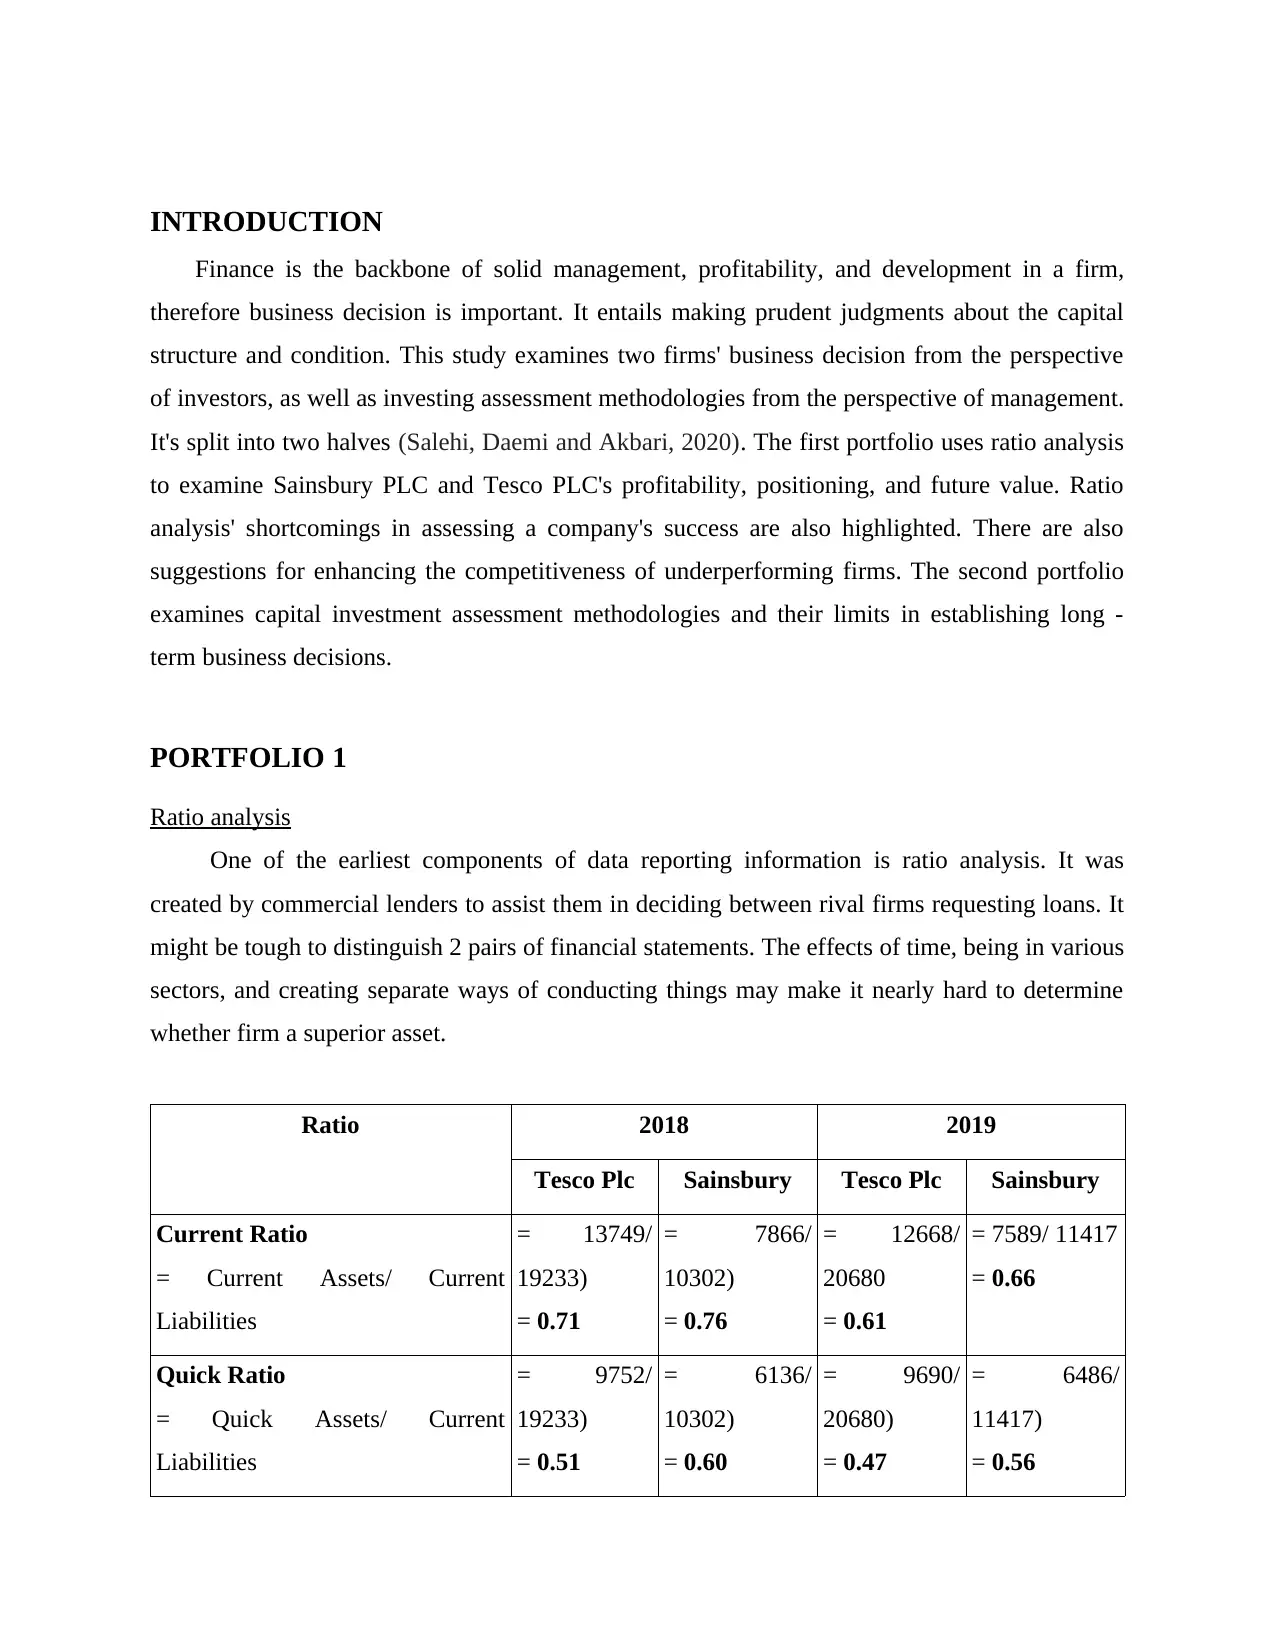
Ratio analysis
One of the earliest components of data reporting information is ratio analysis. It was
created by commercial lenders to assist them in deciding between rival firms requesting loans. It
might be tough to distinguish 2 pairs of financial statements. The effects of time, being in various
sectors, and creating separate ways of conducting things may make it nearly hard to determine
whether firm a superior asset.
Ratio 2018 2019
Tesco Plc Sainsbury Tesco Plc Sainsbury
Current Ratio
= Current Assets/ Current
Liabilities
= 13749/
19233)
= 0.71
= 7866/
10302)
= 0.76
= 12668/
20680
= 0.61
= 7589/ 11417
= 0.66
Quick Ratio
= Quick Assets/ Current
Liabilities
= 9752/
19233)
= 0.51
= 6136/
10302)
= 0.60
= 9690/
20680)
= 0.47
= 6486/
11417)
= 0.56
Finance is the backbone of solid management, profitability, and development in a firm,
therefore business decision is important. It entails making prudent judgments about the capital
structure and condition. This study examines two firms' business decision from the perspective
of investors, as well as investing assessment methodologies from the perspective of management.
It's split into two halves (Salehi, Daemi and Akbari, 2020). The first portfolio uses ratio analysis
to examine Sainsbury PLC and Tesco PLC's profitability, positioning, and future value. Ratio
analysis' shortcomings in assessing a company's success are also highlighted. There are also
suggestions for enhancing the competitiveness of underperforming firms. The second portfolio
examines capital investment assessment methodologies and their limits in establishing long -
term business decisions.
PORTFOLIO 1
Ratio analysis
One of the earliest components of data reporting information is ratio analysis. It was
created by commercial lenders to assist them in deciding between rival firms requesting loans. It
might be tough to distinguish 2 pairs of financial statements. The effects of time, being in various
sectors, and creating separate ways of conducting things may make it nearly hard to determine
whether firm a superior asset.
Ratio 2018 2019
Tesco Plc Sainsbury Tesco Plc Sainsbury
Current Ratio
= Current Assets/ Current
Liabilities
= 13749/
19233)
= 0.71
= 7866/
10302)
= 0.76
= 12668/
20680
= 0.61
= 7589/ 11417
= 0.66
Quick Ratio
= Quick Assets/ Current
Liabilities
= 9752/
19233)
= 0.51
= 6136/
10302)
= 0.60
= 9690/
20680)
= 0.47
= 6486/
11417)
= 0.56
Paraphrase This Document
Need a fresh take? Get an instant paraphrase of this document with our AI Paraphraser
Here, Quick Assets = Current
Asset- Inventories
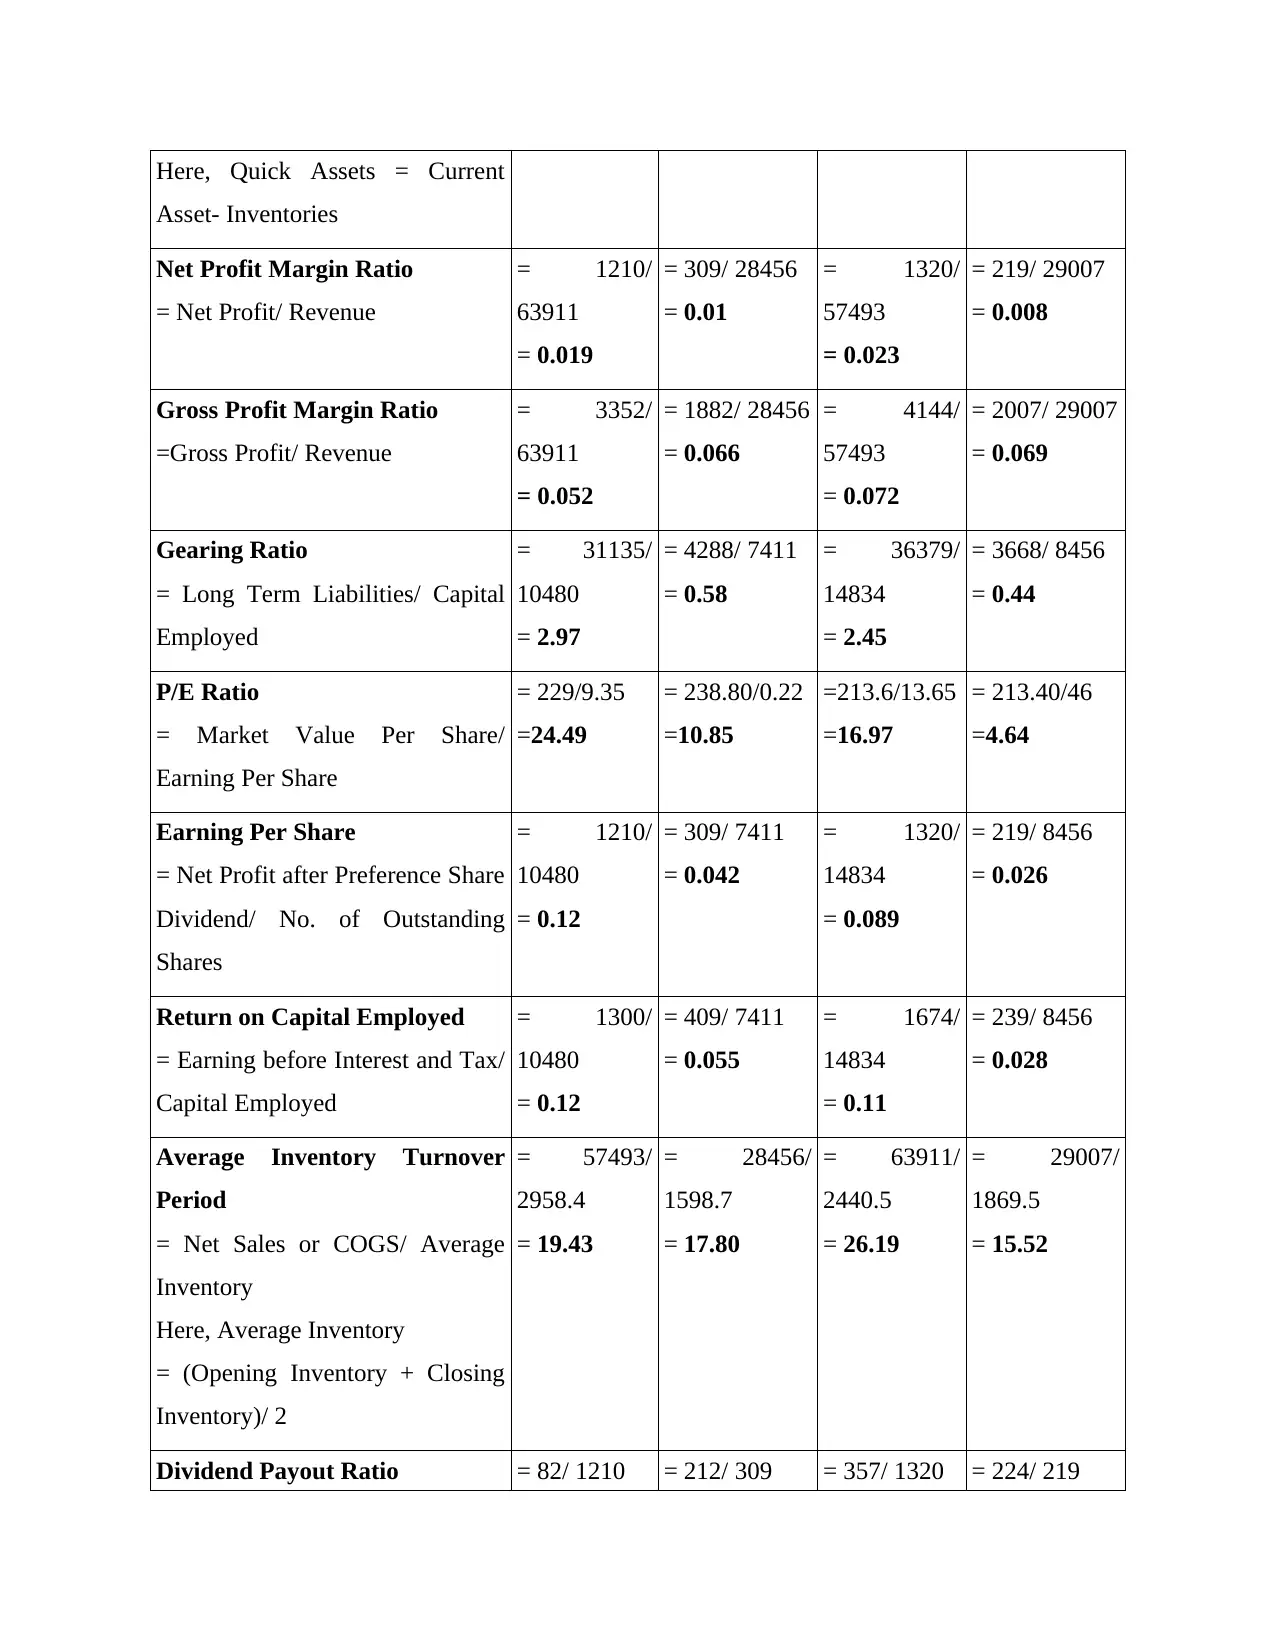
Net Profit Margin Ratio
= Net Profit/ Revenue
= 1210/
63911
= 0.019
= 309/ 28456
= 0.01
= 1320/
57493
= 0.023
= 219/ 29007
= 0.008
Gross Profit Margin Ratio
=Gross Profit/ Revenue
= 3352/
63911
= 0.052
= 1882/ 28456
= 0.066
= 4144/
57493
= 0.072
= 2007/ 29007
= 0.069
Gearing Ratio
= Long Term Liabilities/ Capital
Employed
= 31135/
10480
= 2.97
= 4288/ 7411
= 0.58
= 36379/
14834
= 2.45
= 3668/ 8456
= 0.44
P/E Ratio
= Market Value Per Share/
Earning Per Share
= 229/9.35
=24.49
= 238.80/0.22
=10.85
=213.6/13.65
=16.97
= 213.40/46
=4.64
Earning Per Share
= Net Profit after Preference Share
Dividend/ No. of Outstanding
Shares
= 1210/
10480
= 0.12
= 309/ 7411
= 0.042
= 1320/
14834
= 0.089
= 219/ 8456
= 0.026
Return on Capital Employed
= Earning before Interest and Tax/
Capital Employed
= 1300/
10480
= 0.12
= 409/ 7411
= 0.055
= 1674/
14834
= 0.11
= 239/ 8456
= 0.028
Average Inventory Turnover
Period
= Net Sales or COGS/ Average
Inventory
Here, Average Inventory
= (Opening Inventory + Closing
Inventory)/ 2
= 57493/
2958.4
= 19.43
= 28456/
1598.7
= 17.80
= 63911/
2440.5
= 26.19
= 29007/
1869.5
= 15.52
Dividend Payout Ratio = 82/ 1210 = 212/ 309 = 357/ 1320 = 224/ 219
Asset- Inventories
Net Profit Margin Ratio
= Net Profit/ Revenue
= 1210/
63911
= 0.019
= 309/ 28456
= 0.01
= 1320/
57493
= 0.023
= 219/ 29007
= 0.008
Gross Profit Margin Ratio
=Gross Profit/ Revenue
= 3352/
63911
= 0.052
= 1882/ 28456
= 0.066
= 4144/
57493
= 0.072
= 2007/ 29007
= 0.069
Gearing Ratio
= Long Term Liabilities/ Capital
Employed
= 31135/
10480
= 2.97
= 4288/ 7411
= 0.58
= 36379/
14834
= 2.45
= 3668/ 8456
= 0.44
P/E Ratio
= Market Value Per Share/
Earning Per Share
= 229/9.35
=24.49
= 238.80/0.22
=10.85
=213.6/13.65
=16.97
= 213.40/46
=4.64
Earning Per Share
= Net Profit after Preference Share
Dividend/ No. of Outstanding
Shares
= 1210/
10480
= 0.12
= 309/ 7411
= 0.042
= 1320/
14834
= 0.089
= 219/ 8456
= 0.026
Return on Capital Employed
= Earning before Interest and Tax/
Capital Employed
= 1300/
10480
= 0.12
= 409/ 7411
= 0.055
= 1674/
14834
= 0.11
= 239/ 8456
= 0.028
Average Inventory Turnover
Period
= Net Sales or COGS/ Average
Inventory
Here, Average Inventory
= (Opening Inventory + Closing
Inventory)/ 2
= 57493/
2958.4
= 19.43
= 28456/
1598.7
= 17.80
= 63911/
2440.5
= 26.19
= 29007/
1869.5
= 15.52
Dividend Payout Ratio = 82/ 1210 = 212/ 309 = 357/ 1320 = 224/ 219
= Dividend Paid/ Net Income = 0.068 = 0.69
= 0.27
= 1.02
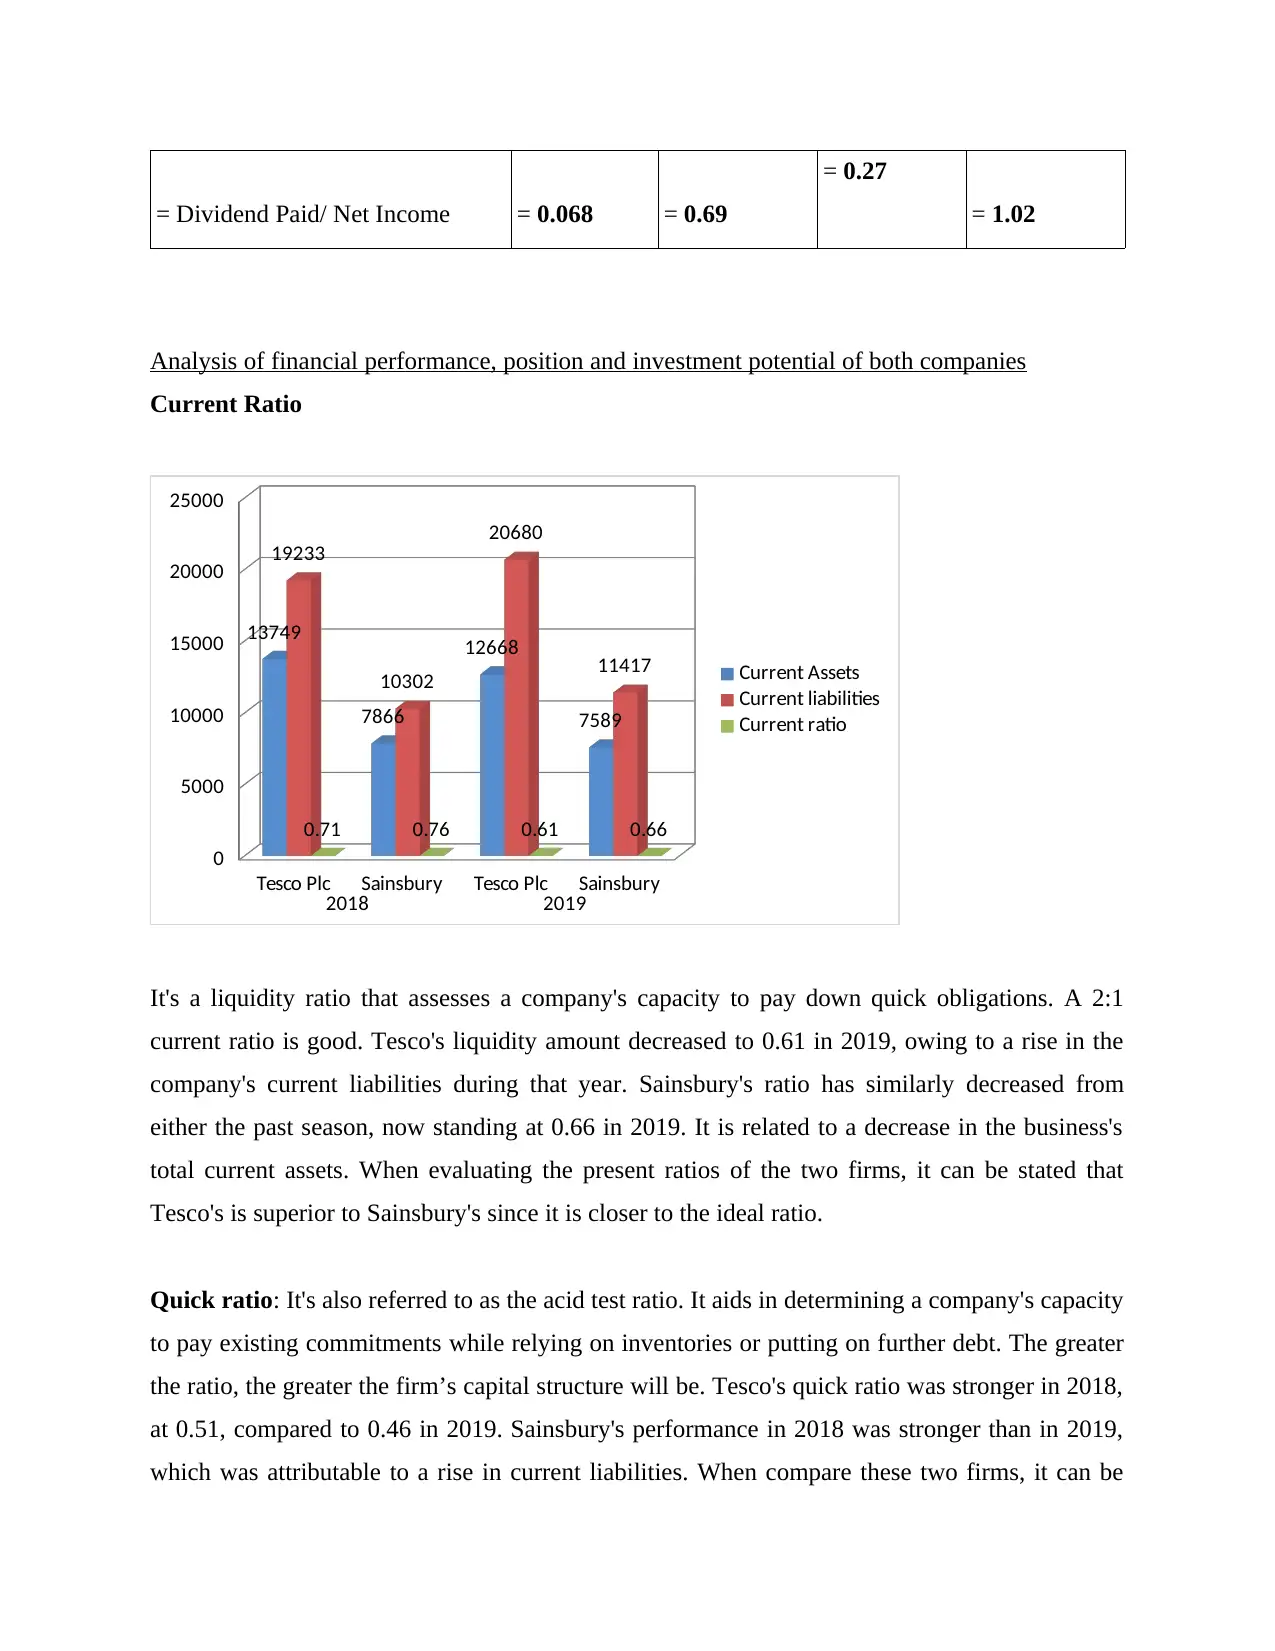
Analysis of financial performance, position and investment potential of both companies
Current Ratio
Tesco Plc Sainsbury Tesco Plc Sainsbury
2018 2019
0
5000
10000
15000
20000
25000
13749
7866
12668
7589
19233
10302
20680
11417
0.71 0.76 0.61 0.66
Current Assets
Current liabilities
Current ratio
It's a liquidity ratio that assesses a company's capacity to pay down quick obligations. A 2:1
current ratio is good. Tesco's liquidity amount decreased to 0.61 in 2019, owing to a rise in the
company's current liabilities during that year. Sainsbury's ratio has similarly decreased from
either the past season, now standing at 0.66 in 2019. It is related to a decrease in the business's
total current assets. When evaluating the present ratios of the two firms, it can be stated that
Tesco's is superior to Sainsbury's since it is closer to the ideal ratio.
Quick ratio: It's also referred to as the acid test ratio. It aids in determining a company's capacity
to pay existing commitments while relying on inventories or putting on further debt. The greater
the ratio, the greater the firm’s capital structure will be. Tesco's quick ratio was stronger in 2018,
at 0.51, compared to 0.46 in 2019. Sainsbury's performance in 2018 was stronger than in 2019,
which was attributable to a rise in current liabilities. When compare these two firms, it can be
= 0.27
= 1.02
Analysis of financial performance, position and investment potential of both companies
Current Ratio
Tesco Plc Sainsbury Tesco Plc Sainsbury
2018 2019
0
5000
10000
15000
20000
25000
13749
7866
12668
7589
19233
10302
20680
11417
0.71 0.76 0.61 0.66
Current Assets
Current liabilities
Current ratio
It's a liquidity ratio that assesses a company's capacity to pay down quick obligations. A 2:1
current ratio is good. Tesco's liquidity amount decreased to 0.61 in 2019, owing to a rise in the
company's current liabilities during that year. Sainsbury's ratio has similarly decreased from
either the past season, now standing at 0.66 in 2019. It is related to a decrease in the business's
total current assets. When evaluating the present ratios of the two firms, it can be stated that
Tesco's is superior to Sainsbury's since it is closer to the ideal ratio.
Quick ratio: It's also referred to as the acid test ratio. It aids in determining a company's capacity
to pay existing commitments while relying on inventories or putting on further debt. The greater
the ratio, the greater the firm’s capital structure will be. Tesco's quick ratio was stronger in 2018,
at 0.51, compared to 0.46 in 2019. Sainsbury's performance in 2018 was stronger than in 2019,
which was attributable to a rise in current liabilities. When compare these two firms, it can be
⊘ This is a preview!⊘
Do you want full access?
Subscribe today to unlock all pages.
Trusted by 1+ million students worldwide
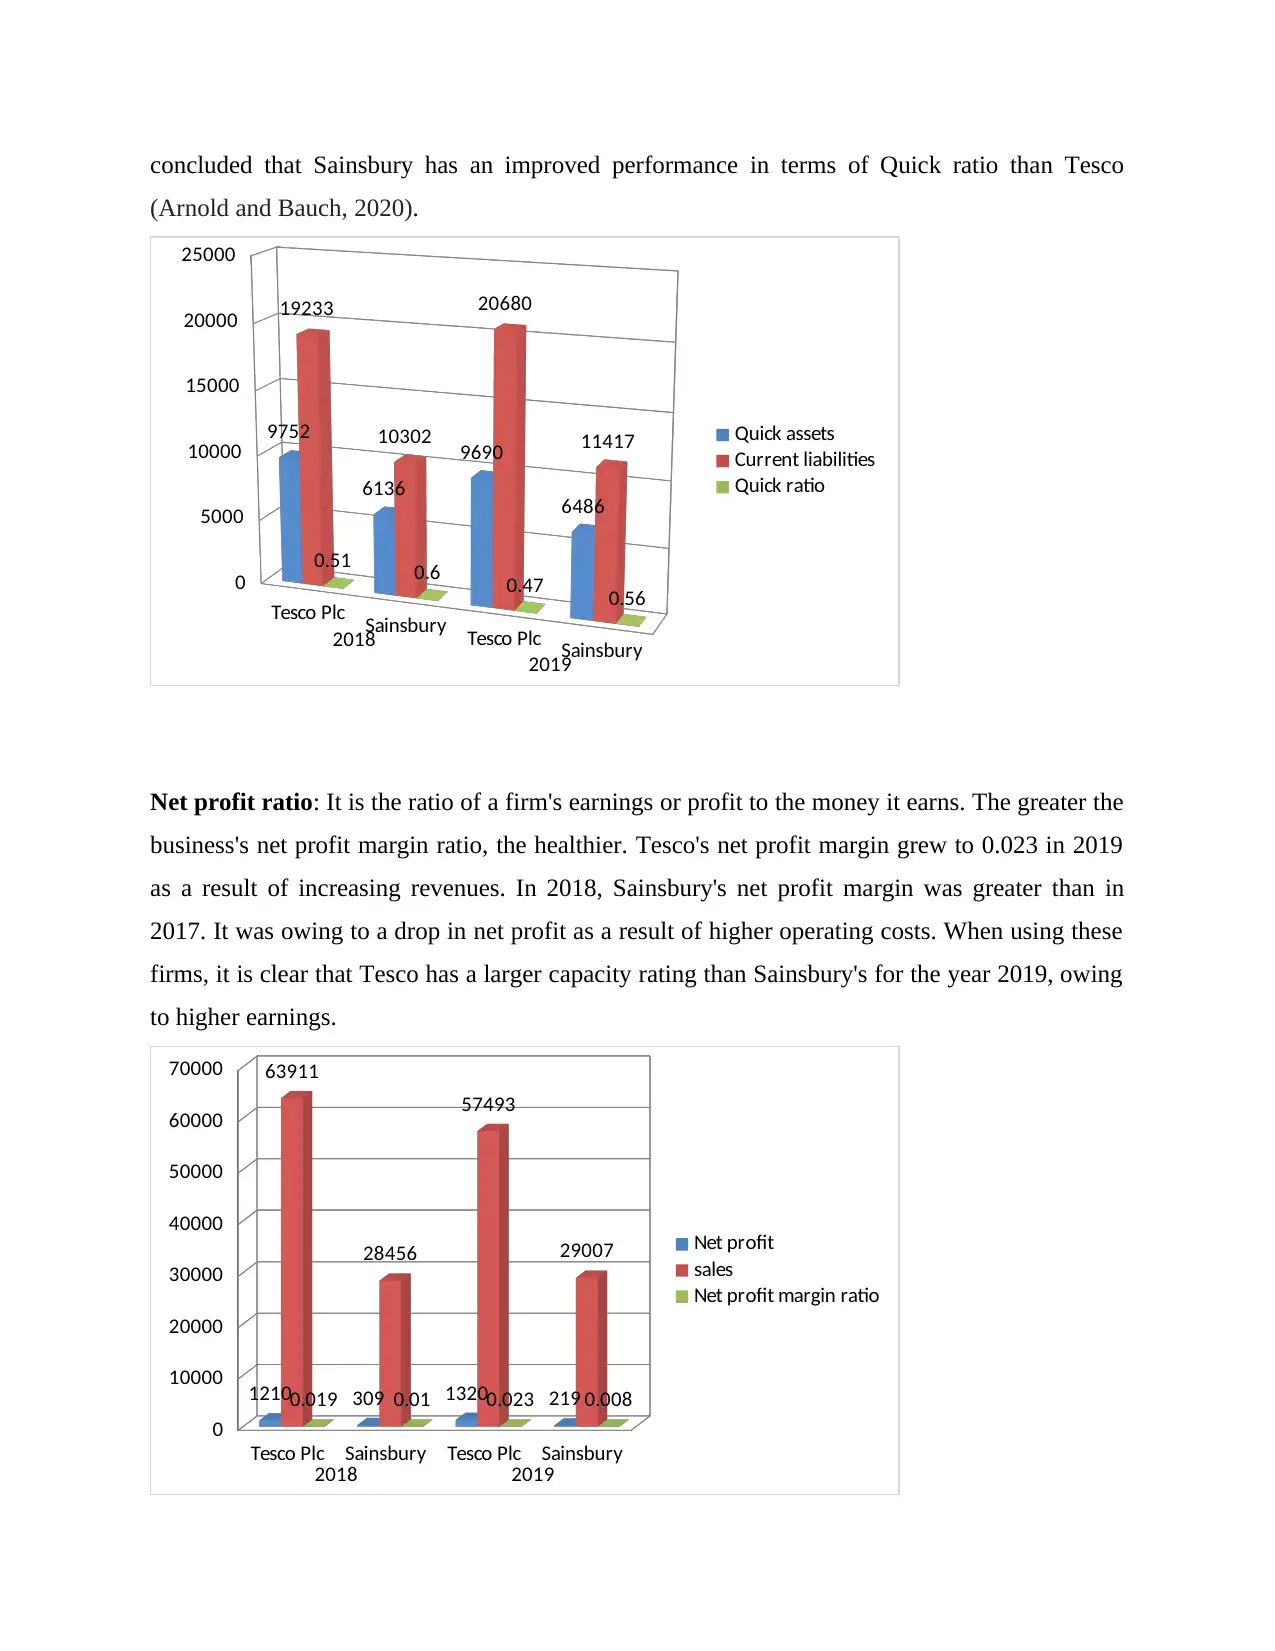
concluded that Sainsbury has an improved performance in terms of Quick ratio than Tesco
(Arnold and Bauch, 2020).
Tesco Plc Sainsbury Tesco Plc Sainsbury
2018
2019
0
5000
10000
15000
20000
25000
9752
6136
9690
6486
19233
10302
20680
11417
0.51 0.6 0.47 0.56
Quick assets
Current liabilities
Quick ratio
Net profit ratio: It is the ratio of a firm's earnings or profit to the money it earns. The greater the
business's net profit margin ratio, the healthier. Tesco's net profit margin grew to 0.023 in 2019
as a result of increasing revenues. In 2018, Sainsbury's net profit margin was greater than in
2017. It was owing to a drop in net profit as a result of higher operating costs. When using these
firms, it is clear that Tesco has a larger capacity rating than Sainsbury's for the year 2019, owing
to higher earnings.
Tesco Plc Sainsbury Tesco Plc Sainsbury
2018 2019
0
10000
20000
30000
40000
50000
60000
70000
1210 309 1320 219
63911
28456
57493
29007
0.019 0.01 0.023 0.008
Net profit
sales
Net profit margin ratio
Paraphrase This Document
Need a fresh take? Get an instant paraphrase of this document with our AI Paraphraser
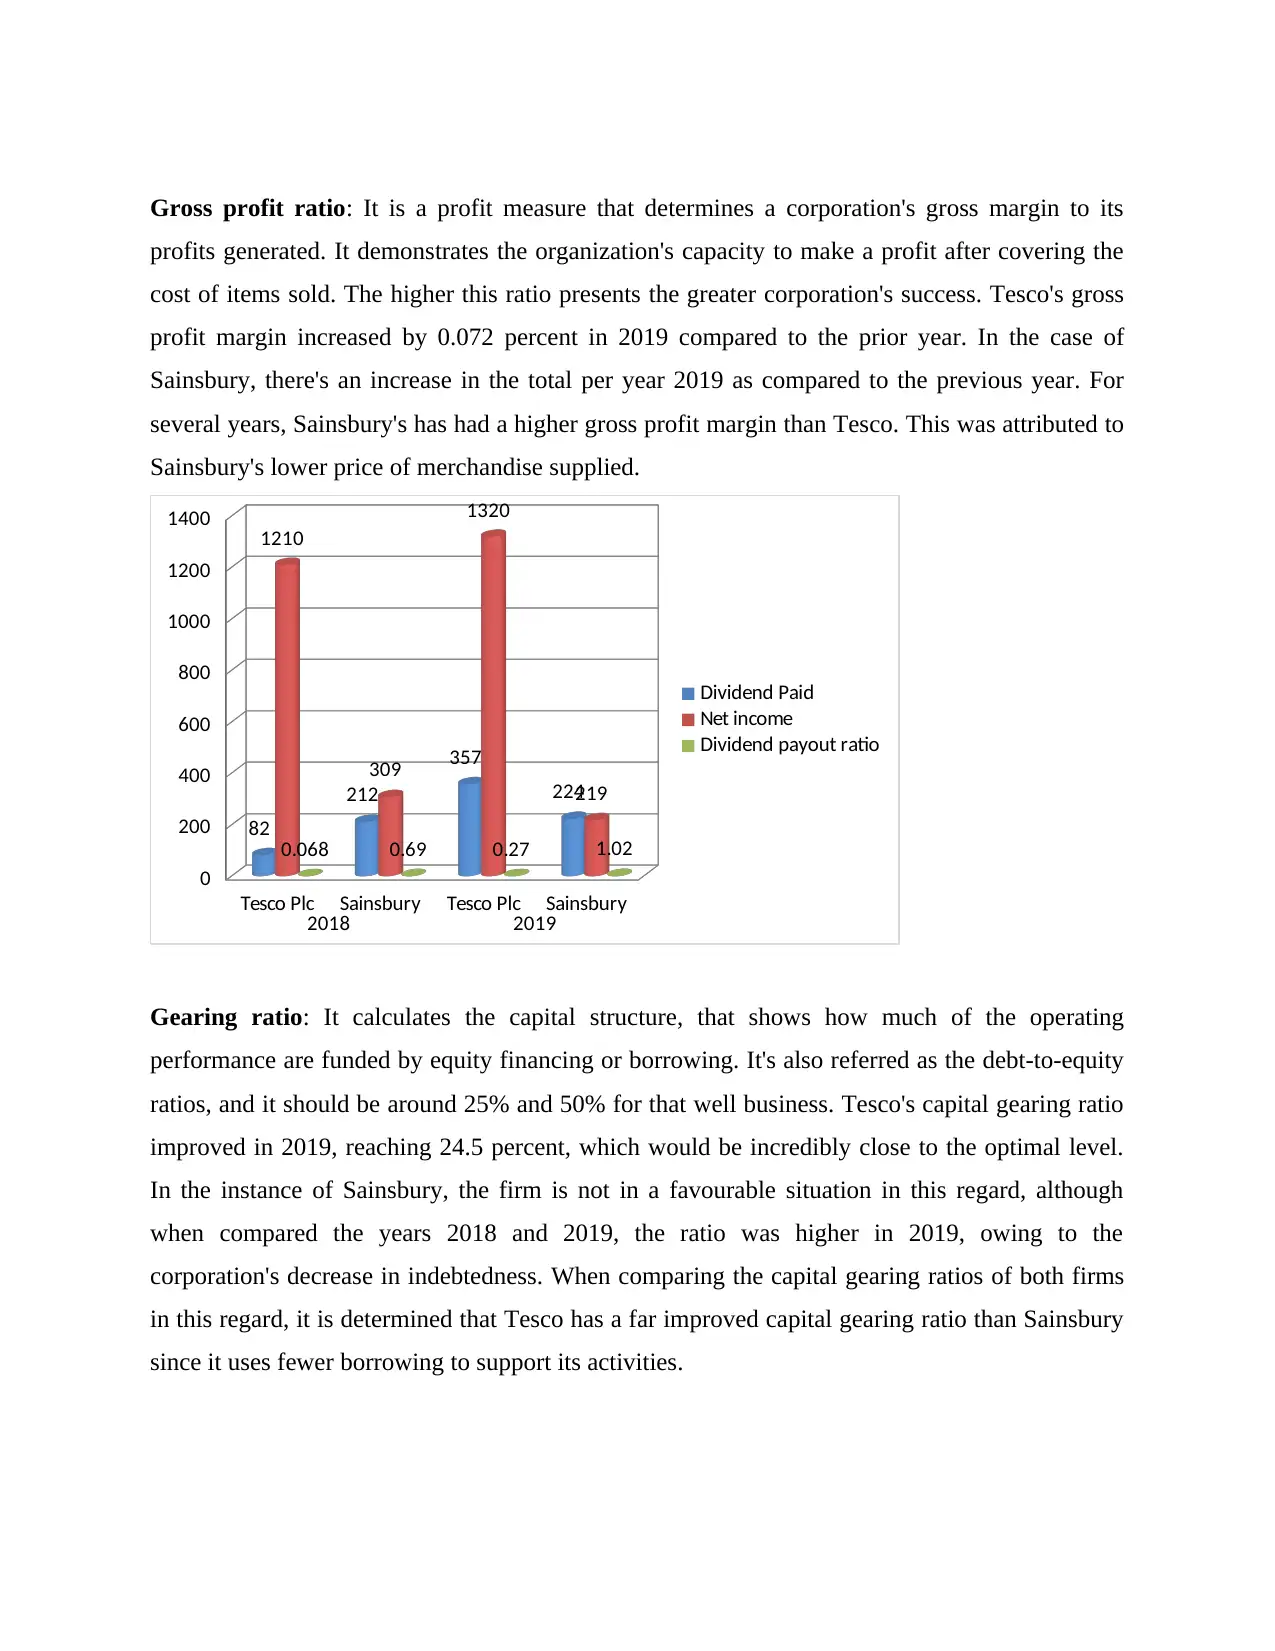
Gross profit ratio: It is a profit measure that determines a corporation's gross margin to its
profits generated. It demonstrates the organization's capacity to make a profit after covering the
cost of items sold. The higher this ratio presents the greater corporation's success. Tesco's gross
profit margin increased by 0.072 percent in 2019 compared to the prior year. In the case of
Sainsbury, there's an increase in the total per year 2019 as compared to the previous year. For
several years, Sainsbury's has had a higher gross profit margin than Tesco. This was attributed to
Sainsbury's lower price of merchandise supplied.
Tesco Plc Sainsbury Tesco Plc Sainsbury
2018 2019
0
200
400
600
800
1000
1200
1400
82
212
357
224
1210
309
1320
219
0.068 0.69 0.27 1.02
Dividend Paid
Net income
Dividend payout ratio
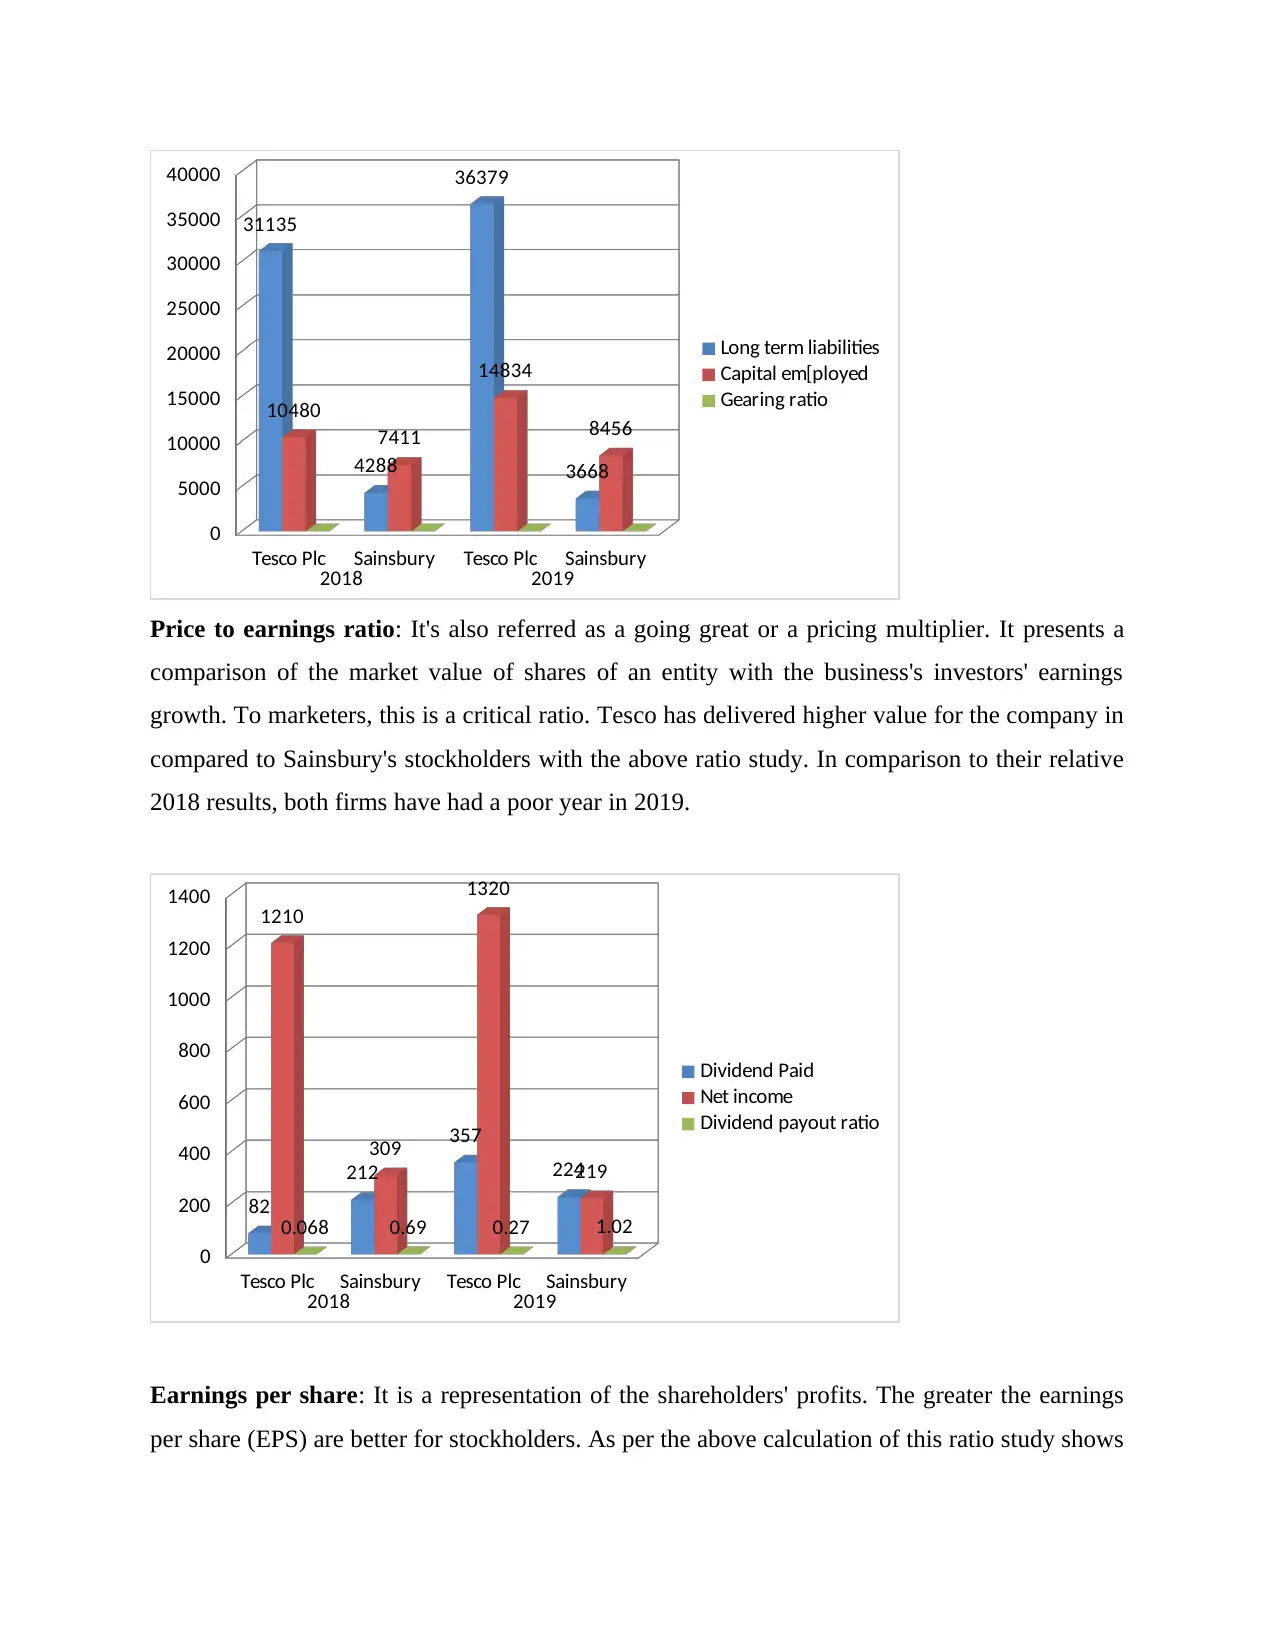
Gearing ratio: It calculates the capital structure, that shows how much of the operating
performance are funded by equity financing or borrowing. It's also referred as the debt-to-equity
ratios, and it should be around 25% and 50% for that well business. Tesco's capital gearing ratio
improved in 2019, reaching 24.5 percent, which would be incredibly close to the optimal level.
In the instance of Sainsbury, the firm is not in a favourable situation in this regard, although
when compared the years 2018 and 2019, the ratio was higher in 2019, owing to the
corporation's decrease in indebtedness. When comparing the capital gearing ratios of both firms
in this regard, it is determined that Tesco has a far improved capital gearing ratio than Sainsbury
since it uses fewer borrowing to support its activities.
profits generated. It demonstrates the organization's capacity to make a profit after covering the
cost of items sold. The higher this ratio presents the greater corporation's success. Tesco's gross
profit margin increased by 0.072 percent in 2019 compared to the prior year. In the case of
Sainsbury, there's an increase in the total per year 2019 as compared to the previous year. For
several years, Sainsbury's has had a higher gross profit margin than Tesco. This was attributed to
Sainsbury's lower price of merchandise supplied.
Tesco Plc Sainsbury Tesco Plc Sainsbury
2018 2019
0
200
400
600
800
1000
1200
1400
82
212
357
224
1210
309
1320
219
0.068 0.69 0.27 1.02
Dividend Paid
Net income
Dividend payout ratio
Gearing ratio: It calculates the capital structure, that shows how much of the operating
performance are funded by equity financing or borrowing. It's also referred as the debt-to-equity
ratios, and it should be around 25% and 50% for that well business. Tesco's capital gearing ratio
improved in 2019, reaching 24.5 percent, which would be incredibly close to the optimal level.
In the instance of Sainsbury, the firm is not in a favourable situation in this regard, although
when compared the years 2018 and 2019, the ratio was higher in 2019, owing to the
corporation's decrease in indebtedness. When comparing the capital gearing ratios of both firms
in this regard, it is determined that Tesco has a far improved capital gearing ratio than Sainsbury
since it uses fewer borrowing to support its activities.
Tesco Plc Sainsbury Tesco Plc Sainsbury
2018 2019
0
5000
10000
15000
20000
25000
30000
35000
40000
31135
4288
36379
3668
10480
7411
14834
8456
Long term liabilities
Capital em[ployed
Gearing ratio
Price to earnings ratio: It's also referred as a going great or a pricing multiplier. It presents a
comparison of the market value of shares of an entity with the business's investors' earnings
growth. To marketers, this is a critical ratio. Tesco has delivered higher value for the company in
compared to Sainsbury's stockholders with the above ratio study. In comparison to their relative
2018 results, both firms have had a poor year in 2019.
Tesco Plc Sainsbury Tesco Plc Sainsbury
2018 2019
0
200
400
600
800
1000
1200
1400
82
212
357
224
1210
309
1320
219
0.068 0.69 0.27 1.02
Dividend Paid
Net income
Dividend payout ratio
Earnings per share: It is a representation of the shareholders' profits. The greater the earnings
per share (EPS) are better for stockholders. As per the above calculation of this ratio study shows
2018 2019
0
5000
10000
15000
20000
25000
30000
35000
40000
31135
4288
36379
3668
10480
7411
14834
8456
Long term liabilities
Capital em[ployed
Gearing ratio
Price to earnings ratio: It's also referred as a going great or a pricing multiplier. It presents a
comparison of the market value of shares of an entity with the business's investors' earnings
growth. To marketers, this is a critical ratio. Tesco has delivered higher value for the company in
compared to Sainsbury's stockholders with the above ratio study. In comparison to their relative
2018 results, both firms have had a poor year in 2019.
Tesco Plc Sainsbury Tesco Plc Sainsbury
2018 2019
0
200
400
600
800
1000
1200
1400
82
212
357
224
1210
309
1320
219
0.068 0.69 0.27 1.02
Dividend Paid
Net income
Dividend payout ratio
Earnings per share: It is a representation of the shareholders' profits. The greater the earnings
per share (EPS) are better for stockholders. As per the above calculation of this ratio study shows
⊘ This is a preview!⊘
Do you want full access?
Subscribe today to unlock all pages.
Trusted by 1+ million students worldwide
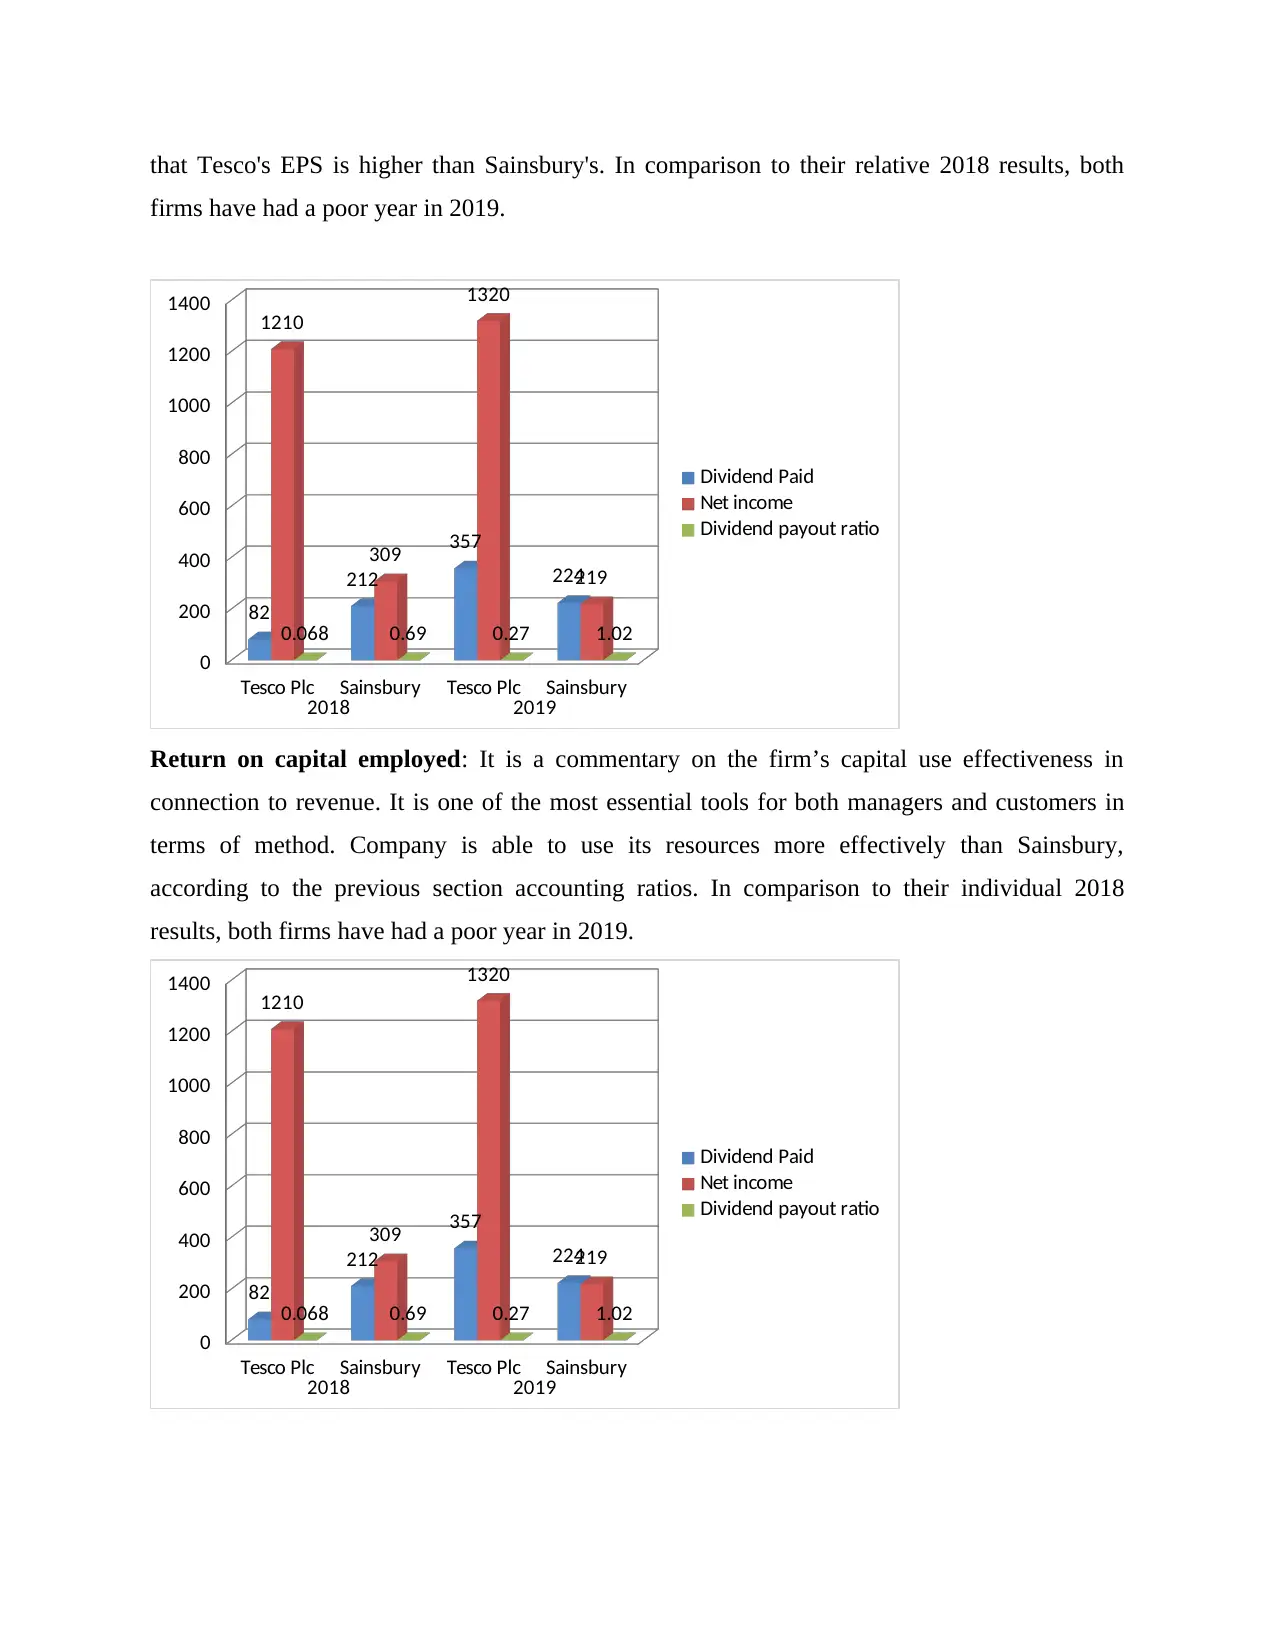
that Tesco's EPS is higher than Sainsbury's. In comparison to their relative 2018 results, both
firms have had a poor year in 2019.
Tesco Plc Sainsbury Tesco Plc Sainsbury
2018 2019
0
200
400
600
800
1000
1200
1400
82
212
357
224
1210
309
1320
219
0.068 0.69 0.27 1.02
Dividend Paid
Net income
Dividend payout ratio
Return on capital employed: It is a commentary on the firm’s capital use effectiveness in
connection to revenue. It is one of the most essential tools for both managers and customers in
terms of method. Company is able to use its resources more effectively than Sainsbury,
according to the previous section accounting ratios. In comparison to their individual 2018
results, both firms have had a poor year in 2019.
Tesco Plc Sainsbury Tesco Plc Sainsbury
2018 2019
0
200
400
600
800
1000
1200
1400
82
212
357
224
1210
309
1320
219
0.068 0.69 0.27 1.02
Dividend Paid
Net income
Dividend payout ratio
Paraphrase This Document
Need a fresh take? Get an instant paraphrase of this document with our AI Paraphraser
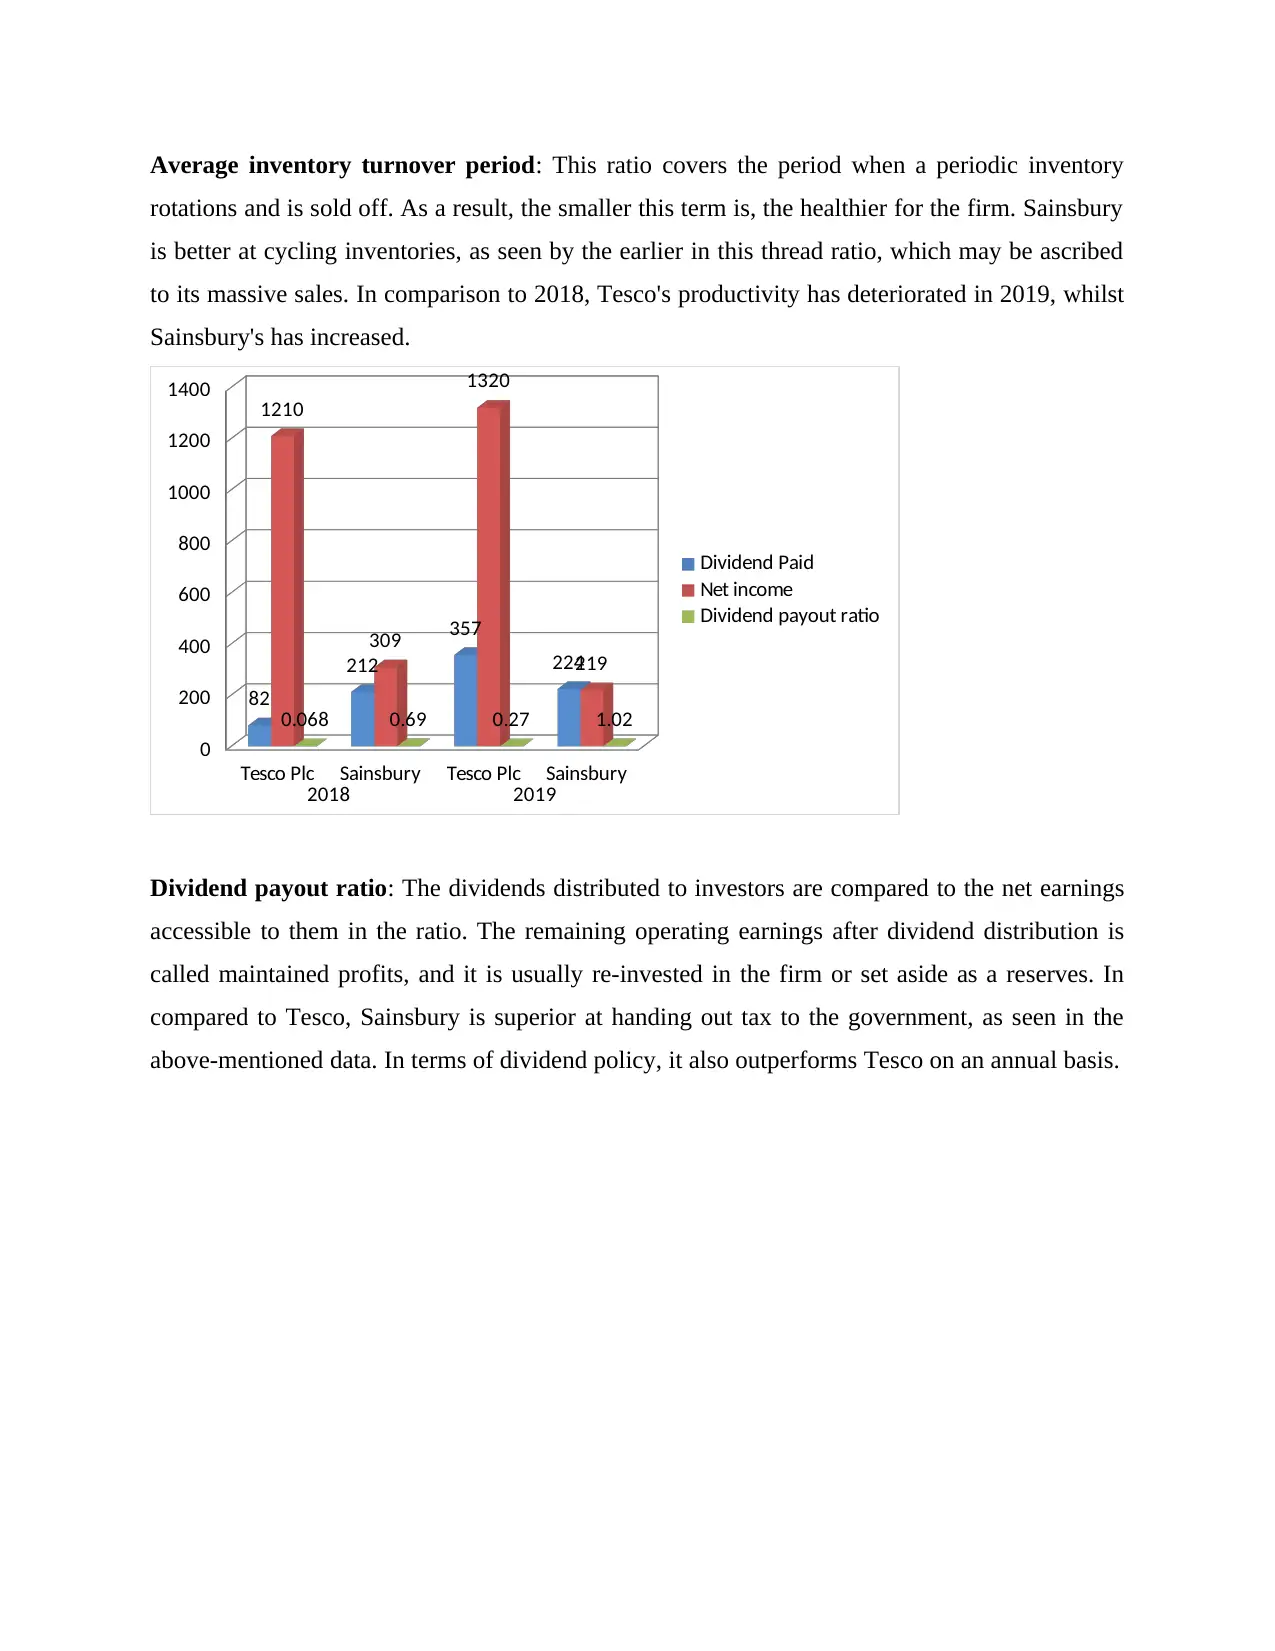
Average inventory turnover period: This ratio covers the period when a periodic inventory
rotations and is sold off. As a result, the smaller this term is, the healthier for the firm. Sainsbury
is better at cycling inventories, as seen by the earlier in this thread ratio, which may be ascribed
to its massive sales. In comparison to 2018, Tesco's productivity has deteriorated in 2019, whilst
Sainsbury's has increased.
Tesco Plc Sainsbury Tesco Plc Sainsbury
2018 2019
0
200
400
600
800
1000
1200
1400
82
212
357
224
1210
309
1320
219
0.068 0.69 0.27 1.02
Dividend Paid
Net income
Dividend payout ratio
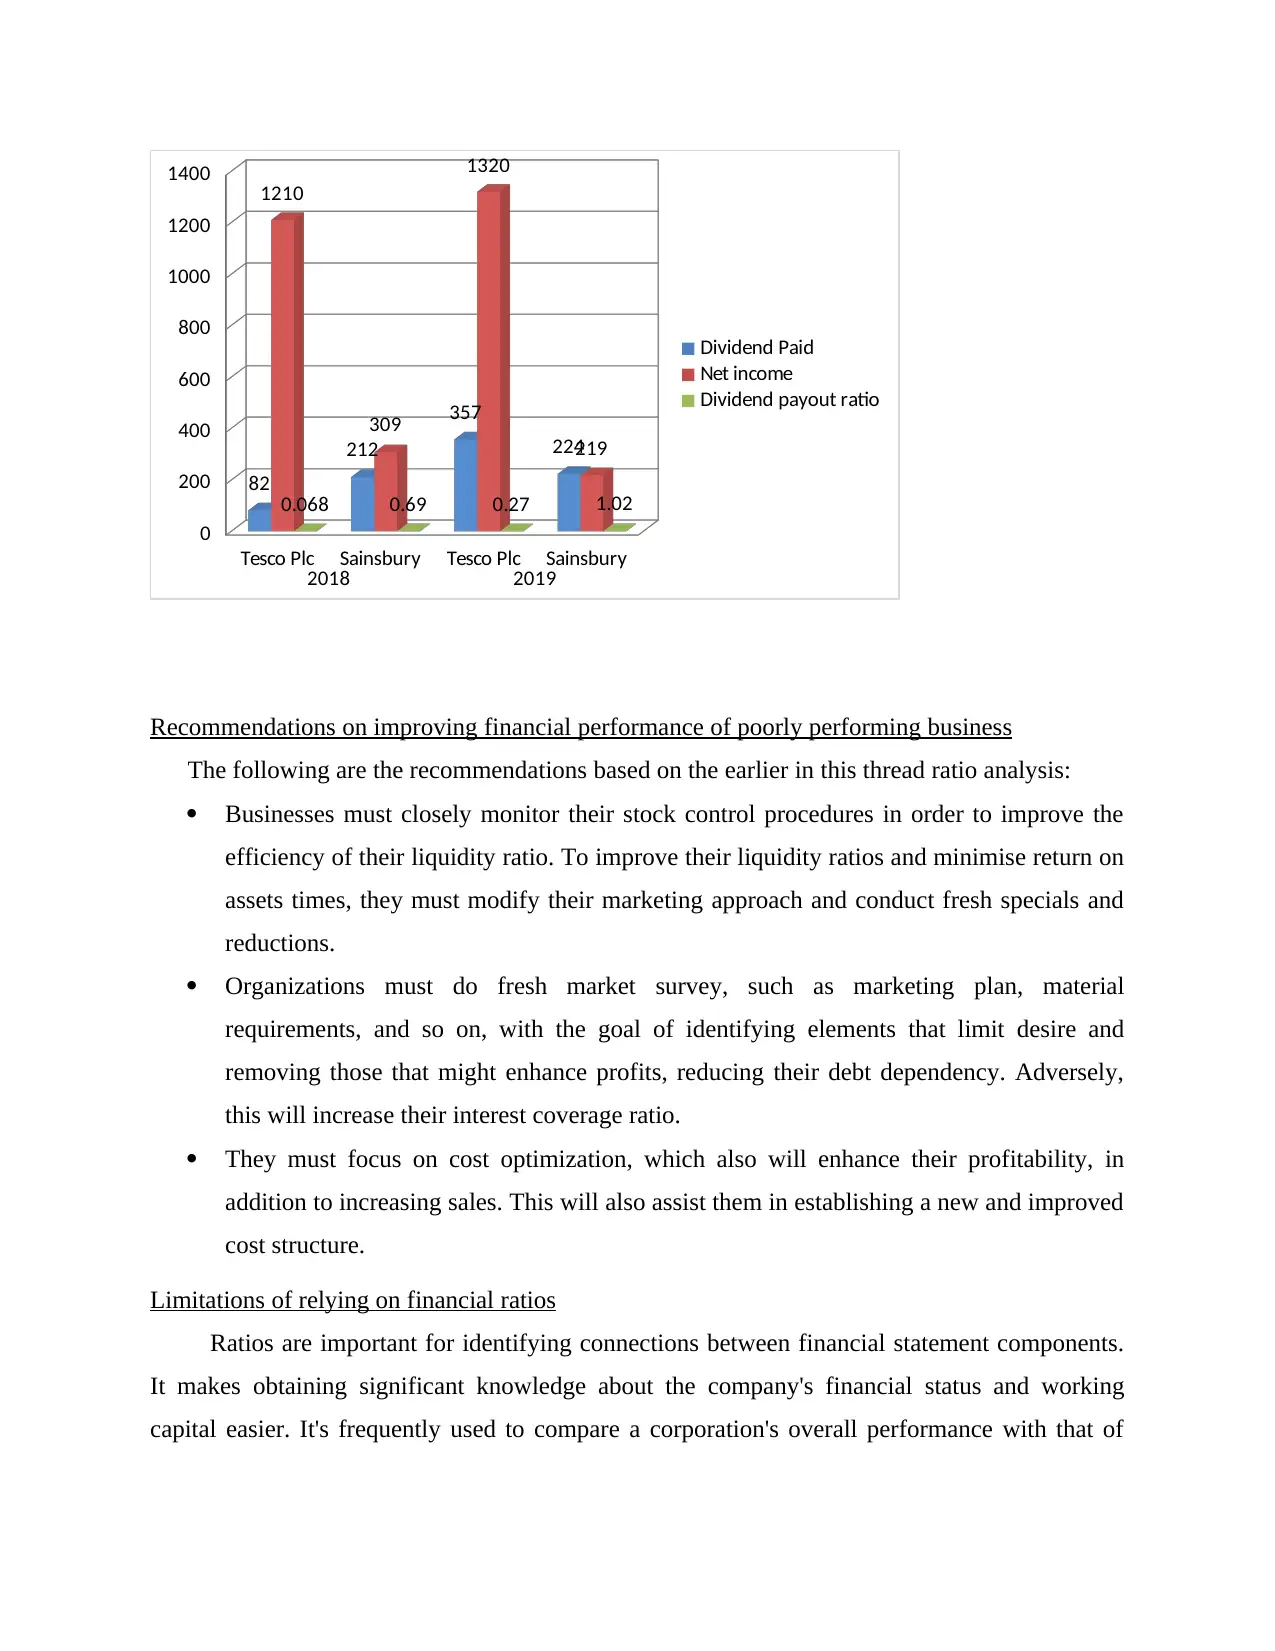
Dividend payout ratio: The dividends distributed to investors are compared to the net earnings
accessible to them in the ratio. The remaining operating earnings after dividend distribution is
called maintained profits, and it is usually re-invested in the firm or set aside as a reserves. In
compared to Tesco, Sainsbury is superior at handing out tax to the government, as seen in the
above-mentioned data. In terms of dividend policy, it also outperforms Tesco on an annual basis.
rotations and is sold off. As a result, the smaller this term is, the healthier for the firm. Sainsbury
is better at cycling inventories, as seen by the earlier in this thread ratio, which may be ascribed
to its massive sales. In comparison to 2018, Tesco's productivity has deteriorated in 2019, whilst
Sainsbury's has increased.
Tesco Plc Sainsbury Tesco Plc Sainsbury
2018 2019
0
200
400
600
800
1000
1200
1400
82
212
357
224
1210
309
1320
219
0.068 0.69 0.27 1.02
Dividend Paid
Net income
Dividend payout ratio
Dividend payout ratio: The dividends distributed to investors are compared to the net earnings
accessible to them in the ratio. The remaining operating earnings after dividend distribution is
called maintained profits, and it is usually re-invested in the firm or set aside as a reserves. In
compared to Tesco, Sainsbury is superior at handing out tax to the government, as seen in the
above-mentioned data. In terms of dividend policy, it also outperforms Tesco on an annual basis.
Tesco Plc Sainsbury Tesco Plc Sainsbury
2018 2019
0
200
400
600
800
1000
1200
1400
82
212
357
224
1210
309
1320
219
0.068 0.69 0.27 1.02
Dividend Paid
Net income
Dividend payout ratio
Recommendations on improving financial performance of poorly performing business
The following are the recommendations based on the earlier in this thread ratio analysis:
Businesses must closely monitor their stock control procedures in order to improve the
efficiency of their liquidity ratio. To improve their liquidity ratios and minimise return on
assets times, they must modify their marketing approach and conduct fresh specials and
reductions.
Organizations must do fresh market survey, such as marketing plan, material
requirements, and so on, with the goal of identifying elements that limit desire and
removing those that might enhance profits, reducing their debt dependency. Adversely,
this will increase their interest coverage ratio.
They must focus on cost optimization, which also will enhance their profitability, in
addition to increasing sales. This will also assist them in establishing a new and improved
cost structure.
Limitations of relying on financial ratios
Ratios are important for identifying connections between financial statement components.
It makes obtaining significant knowledge about the company's financial status and working
capital easier. It's frequently used to compare a corporation's overall performance with that of
⊘ This is a preview!⊘
Do you want full access?
Subscribe today to unlock all pages.
Trusted by 1+ million students worldwide
1 out of 19
Related Documents


Your All-in-One AI-Powered Toolkit for Academic Success.
+13062052269
info@desklib.com
Available 24*7 on WhatsApp / Email
![[object Object]](/_next/static/media/star-bottom.7253800d.svg)
Unlock your academic potential
Copyright © 2020–2026 A2Z Services. All Rights Reserved. Developed and managed by ZUCOL.