Managerial Finance: Financial Analysis, Investment Appraisal Report
VerifiedAdded on 2023/06/10
|18
|3854
|432
Report
AI Summary
This report delves into managerial finance, presenting a comprehensive analysis of two companies, Shell and BP, through the lens of financial ratio analysis. The analysis encompasses a variety of ratios, including current, quick, operating profit, gross profit, return on capital employed, inventory turnover, debtor and creditor days, gearing ratio, and earnings per share. The report evaluates each company's performance based on these ratios, comparing their financial positions and growth trajectories over two years. Furthermore, the report extends to capital investment appraisal, evaluating two projects (A and B) using Net Present Value (NPV) calculations to advise senior management on the optimal investment choice. The report also acknowledges and discusses the limitations of using investment appraisal techniques in long-term decision-making, offering a well-rounded perspective on financial analysis and investment strategies.

Managerial Finance
Paraphrase This Document
Need a fresh take? Get an instant paraphrase of this document with our AI Paraphraser
Table of Contents
INTRODUCTION...........................................................................................................................3
Portfolio 1 – Financial analysis........................................................................................................3
A. Evaluation of report for the potential investors which analyses is for finance and suggest
which organization is better:..................................................................................................3
B. Analysing the performance of both the company with the help of Ratio:.........................8
C. Recommendation for the poor performing company:......................................................11
D. Limitations of financial ratios to measuring a company’s performance:........................12
Portfolio 2 – Capital Investment Appraisal...................................................................................12
A. Using appropriate investment appraisal techniques, advise senior management on whether
they should opt for project A or project B............................................................................12
B. Discuss the limitations of using investment appraisal techniques in long term decision
making..................................................................................................................................15
CONCLUSION..............................................................................................................................16
REFERENCES..............................................................................................................................18
INTRODUCTION
In the below report, first task determine the two companies financial statements which
analysed by calculating two year financial ratio of each company (Aggarwal and Raja, 2018).
Ratio describe the financial position, growth or expansion of the company Shell and BP plc by
obtaining the difference of two years. In this report, ten types of ratios are calculated, such as
current ratio, Quick ratio, operating profit ratio, gross profit margin, return on capital employed,
Average inventories turnover ratio period, debtor's days, creditor's days, gearing ratio and
earning per ratio. In second task, two projects are provided Project A and Project B in which 6
years cash flow and initial cash investment for both plants will be £ 100000 given. This report
calculate the NPV of both the project for advising the senior management on whether they
should opt for project A or project B. It also discuss the limitation of using investment appraisal
technique in long term decision making.
Portfolio 1 – Financial analysis
A. Evaluation of report for the potential investors which analyses is for finance and suggest
which organization is better:
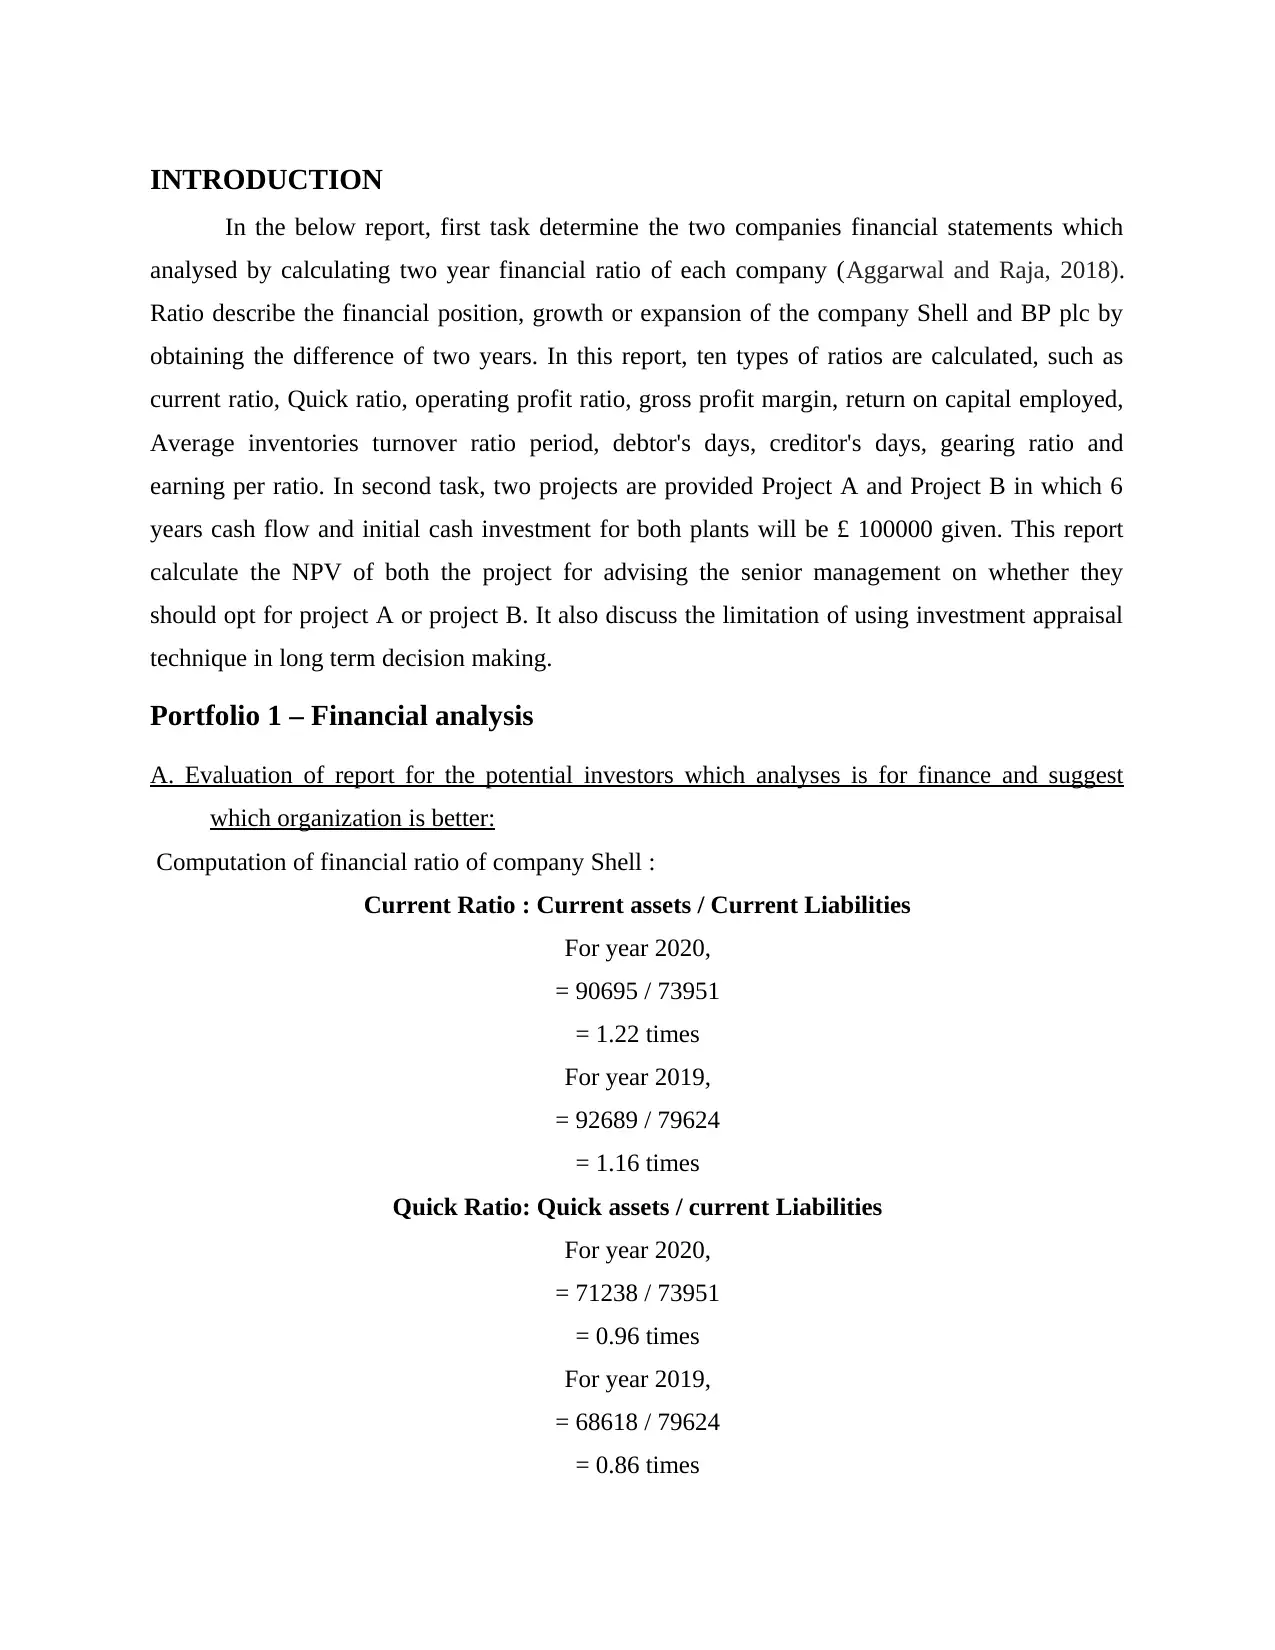
Computation of financial ratio of company Shell :
Current Ratio : Current assets / Current Liabilities
For year 2020,
= 90695 / 73951
= 1.22 times
For year 2019,
= 92689 / 79624
= 1.16 times
Quick Ratio: Quick assets / current Liabilities
For year 2020,
= 71238 / 73951
= 0.96 times
For year 2019,
= 68618 / 79624
= 0.86 times
In the below report, first task determine the two companies financial statements which
analysed by calculating two year financial ratio of each company (Aggarwal and Raja, 2018).
Ratio describe the financial position, growth or expansion of the company Shell and BP plc by
obtaining the difference of two years. In this report, ten types of ratios are calculated, such as
current ratio, Quick ratio, operating profit ratio, gross profit margin, return on capital employed,
Average inventories turnover ratio period, debtor's days, creditor's days, gearing ratio and
earning per ratio. In second task, two projects are provided Project A and Project B in which 6
years cash flow and initial cash investment for both plants will be £ 100000 given. This report
calculate the NPV of both the project for advising the senior management on whether they
should opt for project A or project B. It also discuss the limitation of using investment appraisal
technique in long term decision making.
Portfolio 1 – Financial analysis
A. Evaluation of report for the potential investors which analyses is for finance and suggest
which organization is better:
Computation of financial ratio of company Shell :
Current Ratio : Current assets / Current Liabilities
For year 2020,
= 90695 / 73951
= 1.22 times
For year 2019,
= 92689 / 79624
= 1.16 times
Quick Ratio: Quick assets / current Liabilities
For year 2020,
= 71238 / 73951
= 0.96 times
For year 2019,
= 68618 / 79624
= 0.86 times
⊘ This is a preview!⊘
Do you want full access?
Subscribe today to unlock all pages.
Trusted by 1+ million students worldwide
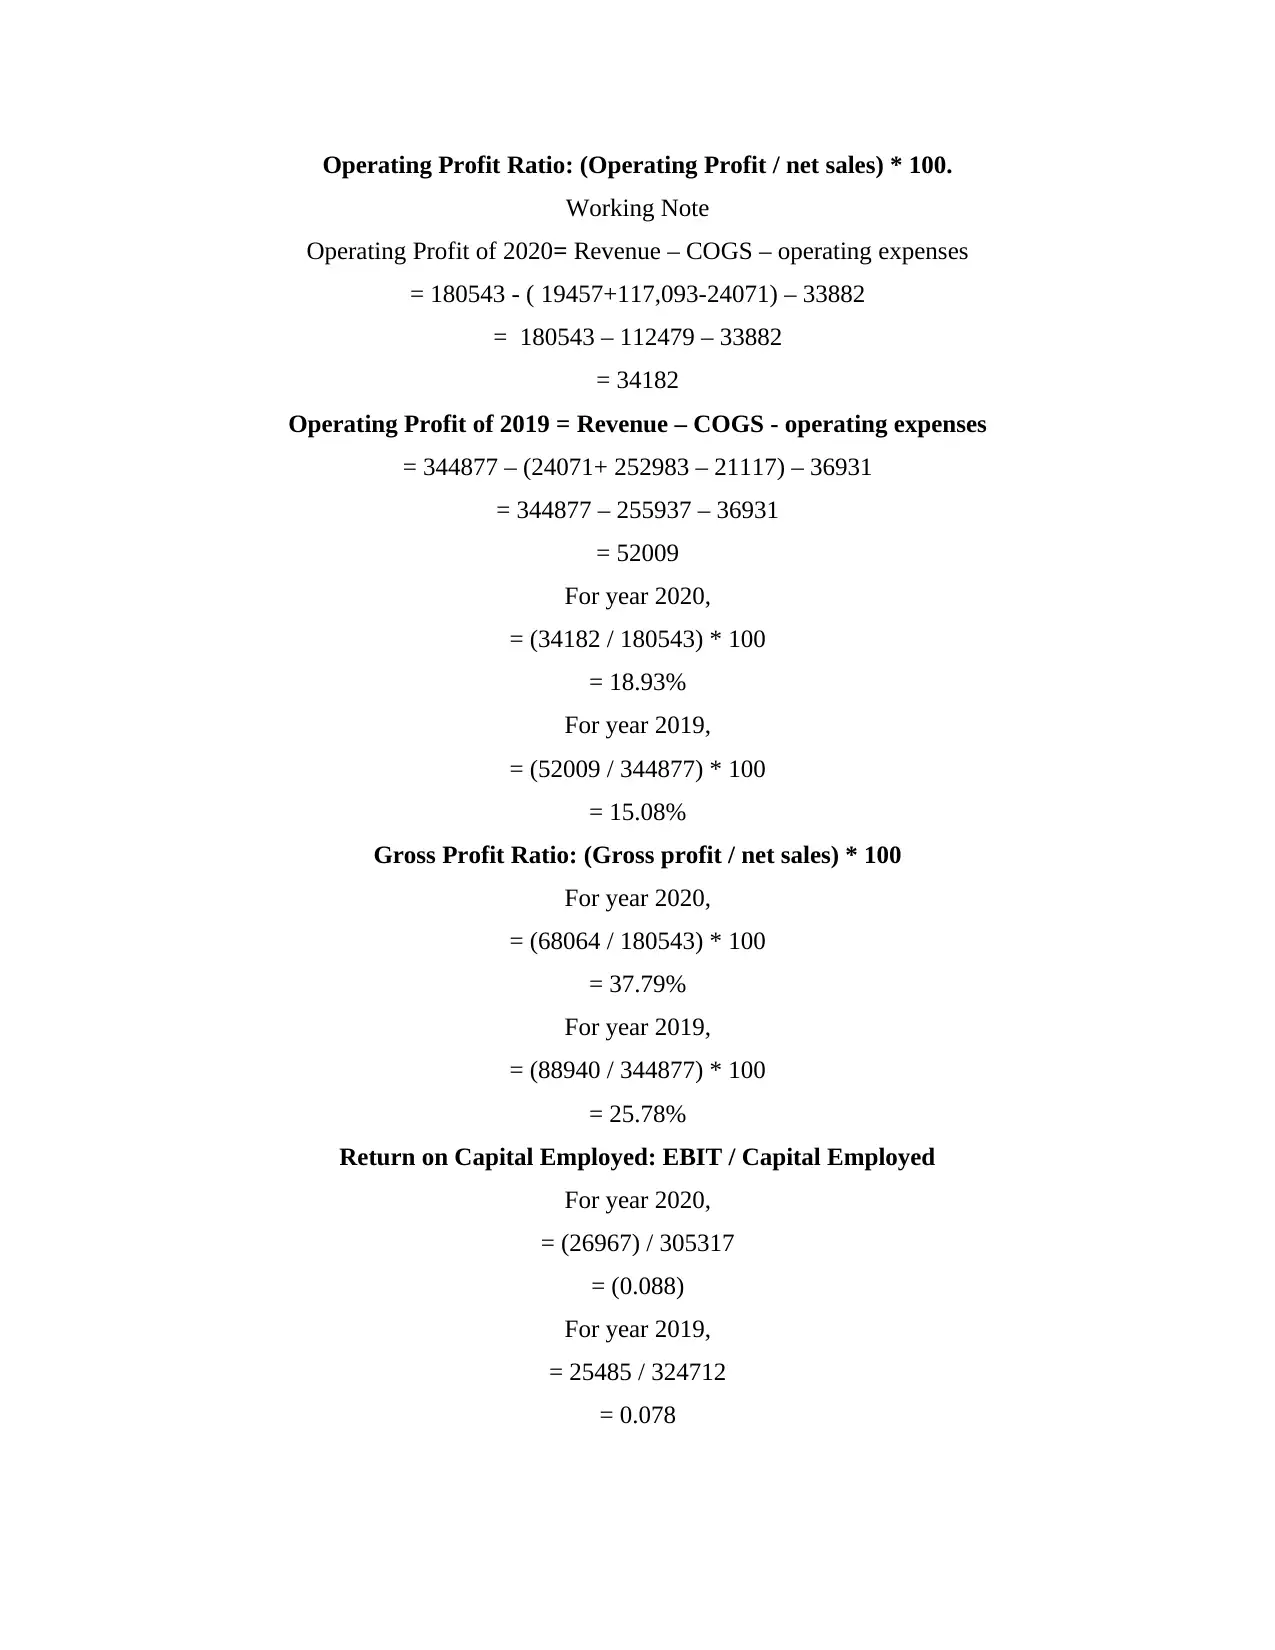
Operating Profit Ratio: (Operating Profit / net sales) * 100.
Working Note
Operating Profit of 2020= Revenue – COGS – operating expenses
= 180543 - ( 19457+117,093-24071) – 33882
= 180543 – 112479 – 33882
= 34182
Operating Profit of 2019 = Revenue – COGS - operating expenses
= 344877 – (24071+ 252983 – 21117) – 36931
= 344877 – 255937 – 36931
= 52009
For year 2020,
= (34182 / 180543) * 100
= 18.93%
For year 2019,
= (52009 / 344877) * 100
= 15.08%
Gross Profit Ratio: (Gross profit / net sales) * 100
For year 2020,
= (68064 / 180543) * 100
= 37.79%
For year 2019,
= (88940 / 344877) * 100
= 25.78%
Return on Capital Employed: EBIT / Capital Employed
For year 2020,
= (26967) / 305317
= (0.088)
For year 2019,
= 25485 / 324712
= 0.078
Paraphrase This Document
Need a fresh take? Get an instant paraphrase of this document with our AI Paraphraser
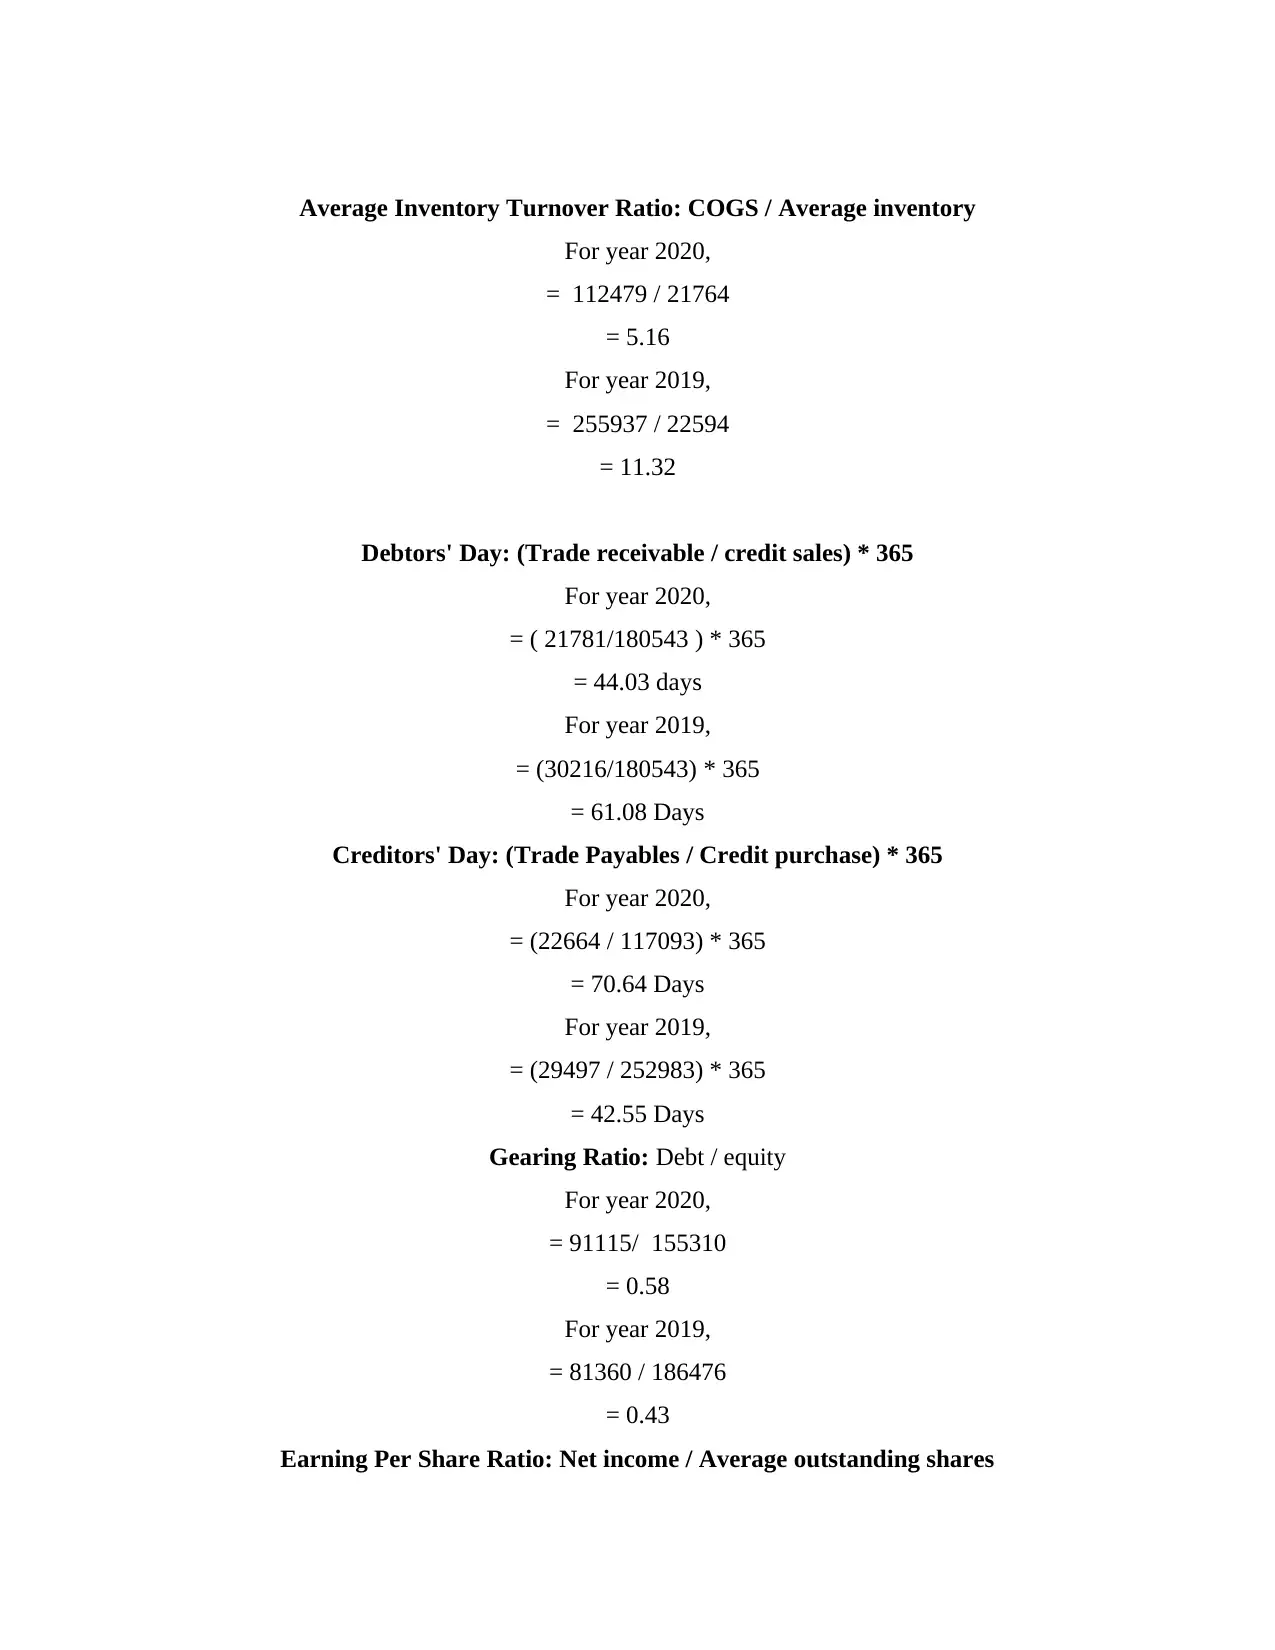
Average Inventory Turnover Ratio: COGS / Average inventory
For year 2020,
= 112479 / 21764
= 5.16
For year 2019,
= 255937 / 22594
= 11.32
Debtors' Day: (Trade receivable / credit sales) * 365
For year 2020,
= ( 21781/180543 ) * 365
= 44.03 days
For year 2019,
= (30216/180543) * 365
= 61.08 Days
Creditors' Day: (Trade Payables / Credit purchase) * 365
For year 2020,
= (22664 / 117093) * 365
= 70.64 Days
For year 2019,
= (29497 / 252983) * 365
= 42.55 Days
Gearing Ratio: Debt / equity
For year 2020,
= 91115/ 155310
= 0.58
For year 2019,
= 81360 / 186476
= 0.43
Earning Per Share Ratio: Net income / Average outstanding shares
For year 2020,
= The company has earned loss in this year
For year 2019,
= 16432 / 3940.6
= 4.16
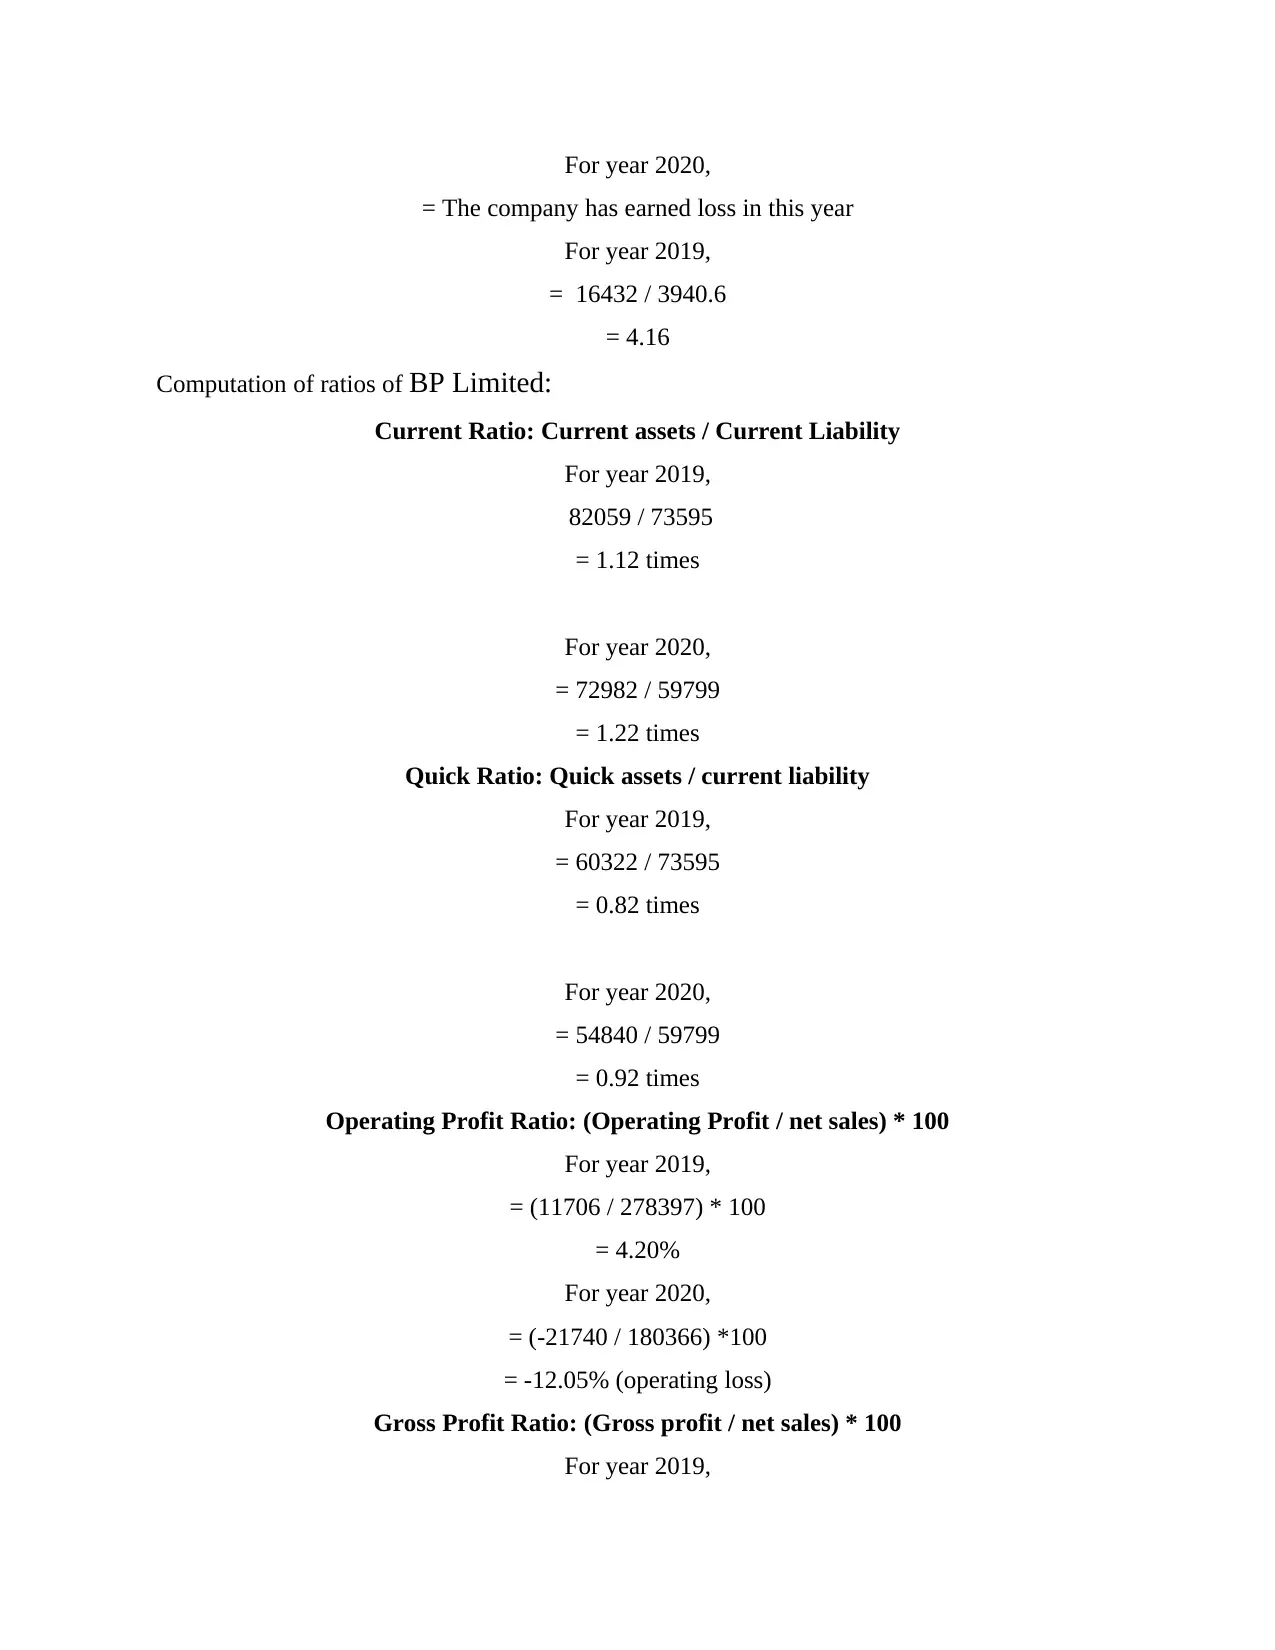
Computation of ratios of BP Limited:
Current Ratio: Current assets / Current Liability
For year 2019,
82059 / 73595
= 1.12 times
For year 2020,
= 72982 / 59799
= 1.22 times
Quick Ratio: Quick assets / current liability
For year 2019,
= 60322 / 73595
= 0.82 times
For year 2020,
= 54840 / 59799
= 0.92 times
Operating Profit Ratio: (Operating Profit / net sales) * 100
For year 2019,
= (11706 / 278397) * 100
= 4.20%
For year 2020,
= (-21740 / 180366) *100
= -12.05% (operating loss)
Gross Profit Ratio: (Gross profit / net sales) * 100
For year 2019,
= The company has earned loss in this year
For year 2019,
= 16432 / 3940.6
= 4.16
Computation of ratios of BP Limited:
Current Ratio: Current assets / Current Liability
For year 2019,
82059 / 73595
= 1.12 times
For year 2020,
= 72982 / 59799
= 1.22 times
Quick Ratio: Quick assets / current liability
For year 2019,
= 60322 / 73595
= 0.82 times
For year 2020,
= 54840 / 59799
= 0.92 times
Operating Profit Ratio: (Operating Profit / net sales) * 100
For year 2019,
= (11706 / 278397) * 100
= 4.20%
For year 2020,
= (-21740 / 180366) *100
= -12.05% (operating loss)
Gross Profit Ratio: (Gross profit / net sales) * 100
For year 2019,
⊘ This is a preview!⊘
Do you want full access?
Subscribe today to unlock all pages.
Trusted by 1+ million students worldwide
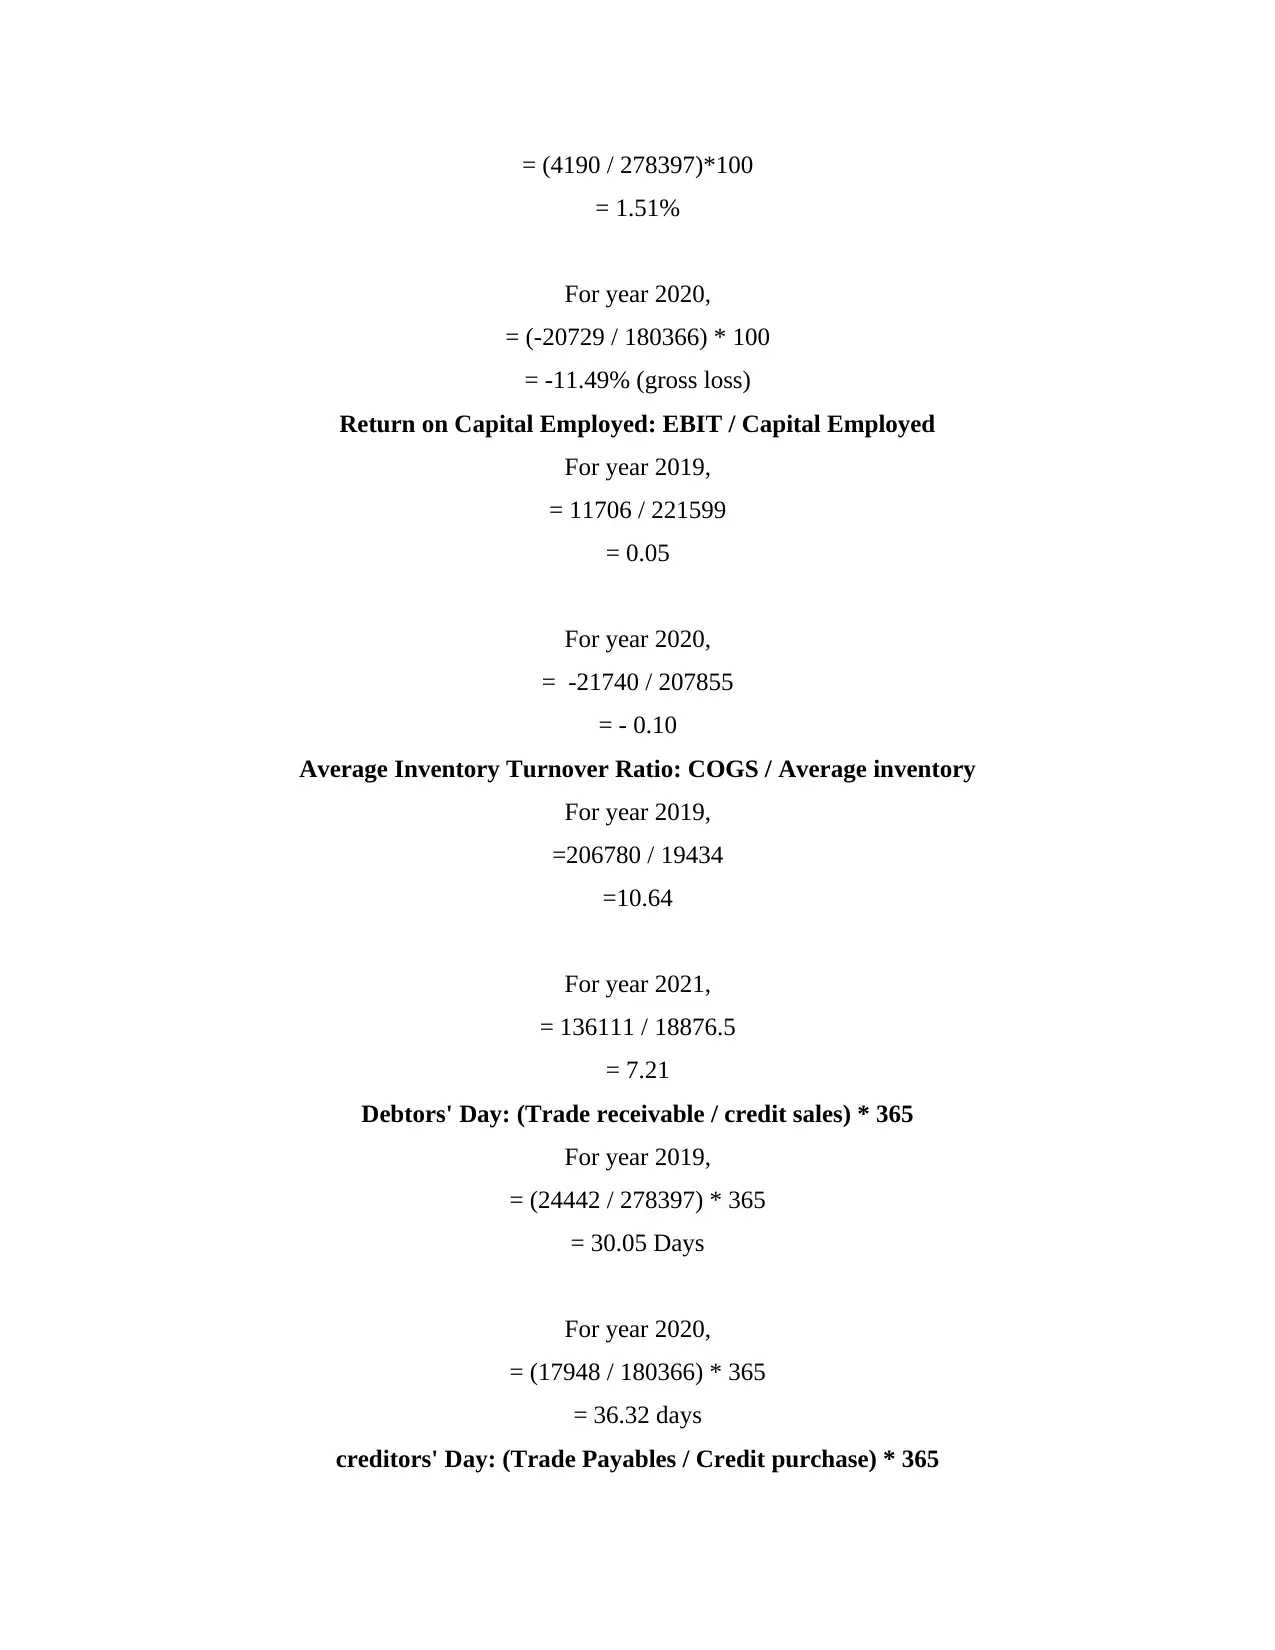
= (4190 / 278397)*100
= 1.51%
For year 2020,
= (-20729 / 180366) * 100
= -11.49% (gross loss)
Return on Capital Employed: EBIT / Capital Employed
For year 2019,
= 11706 / 221599
= 0.05
For year 2020,
= -21740 / 207855
= - 0.10
Average Inventory Turnover Ratio: COGS / Average inventory
For year 2019,
=206780 / 19434
=10.64
For year 2021,
= 136111 / 18876.5
= 7.21
Debtors' Day: (Trade receivable / credit sales) * 365
For year 2019,
= (24442 / 278397) * 365
= 30.05 Days
For year 2020,
= (17948 / 180366) * 365
= 36.32 days
creditors' Day: (Trade Payables / Credit purchase) * 365
Paraphrase This Document
Need a fresh take? Get an instant paraphrase of this document with our AI Paraphraser
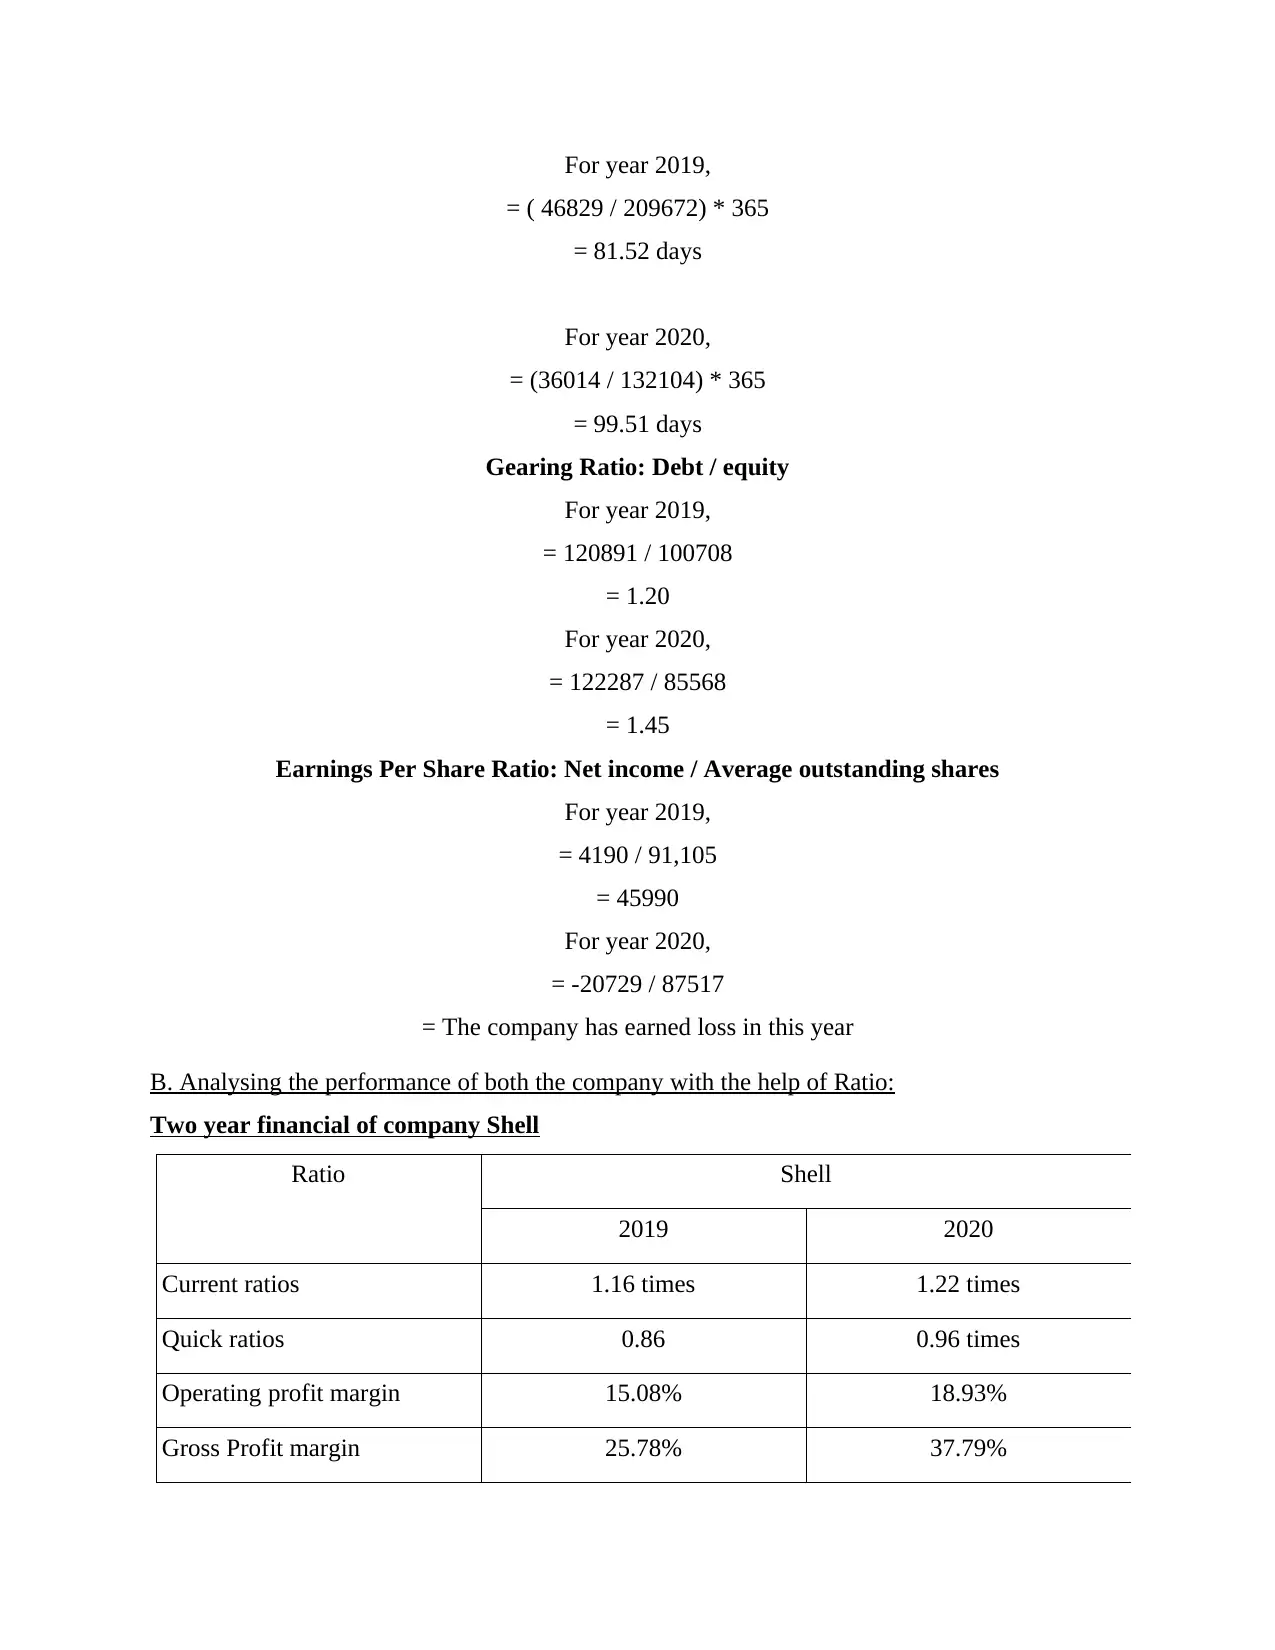
For year 2019,
= ( 46829 / 209672) * 365
= 81.52 days
For year 2020,
= (36014 / 132104) * 365
= 99.51 days
Gearing Ratio: Debt / equity
For year 2019,
= 120891 / 100708
= 1.20
For year 2020,
= 122287 / 85568
= 1.45
Earnings Per Share Ratio: Net income / Average outstanding shares
For year 2019,
= 4190 / 91,105
= 45990
For year 2020,
= -20729 / 87517
= The company has earned loss in this year
B. Analysing the performance of both the company with the help of Ratio:
Two year financial of company Shell
Ratio Shell
2019 2020
Current ratios 1.16 times 1.22 times
Quick ratios 0.86 0.96 times
Operating profit margin 15.08% 18.93%
Gross Profit margin 25.78% 37.79%
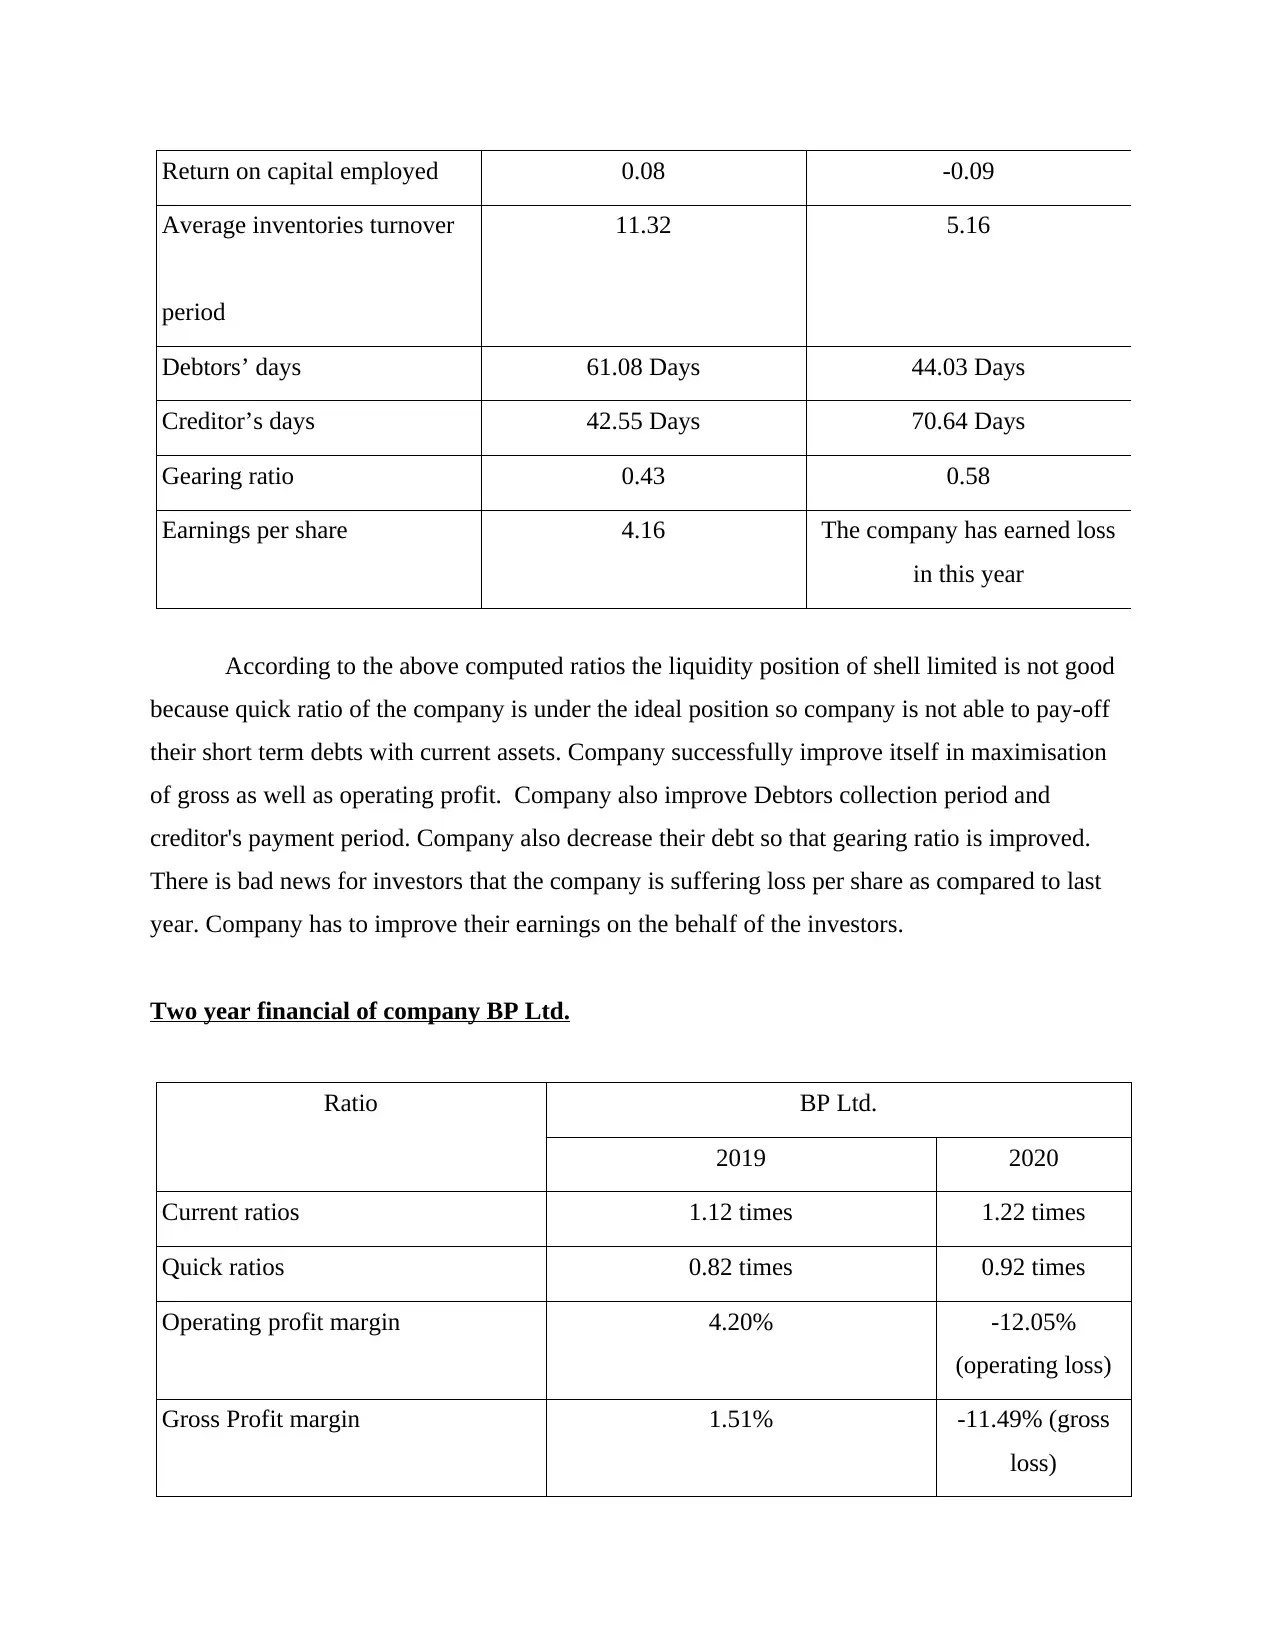
Return on capital employed 0.08 -0.09
Average inventories turnover
period
11.32 5.16
Debtors’ days 61.08 Days 44.03 Days
Creditor’s days 42.55 Days 70.64 Days
Gearing ratio 0.43 0.58
Earnings per share 4.16 The company has earned loss
in this year
According to the above computed ratios the liquidity position of shell limited is not good
because quick ratio of the company is under the ideal position so company is not able to pay-off
their short term debts with current assets. Company successfully improve itself in maximisation
of gross as well as operating profit. Company also improve Debtors collection period and
creditor's payment period. Company also decrease their debt so that gearing ratio is improved.
There is bad news for investors that the company is suffering loss per share as compared to last
year. Company has to improve their earnings on the behalf of the investors.
Two year financial of company BP Ltd.
Ratio BP Ltd.
2019 2020
Current ratios 1.12 times 1.22 times
Quick ratios 0.82 times 0.92 times
Operating profit margin 4.20% -12.05%
(operating loss)
Gross Profit margin 1.51% -11.49% (gross
loss)
⊘ This is a preview!⊘
Do you want full access?
Subscribe today to unlock all pages.
Trusted by 1+ million students worldwide
Return on capital employed 0.05 -0.1
Average inventories turnover
period
10.64 7.21
Debtors’ days 30.05 Days 36.32 Days
Creditor’s days 81.52 Days 99.51 Days
Gearing ratio 1.2 1.45
Earnings per share 45990 -236556.84
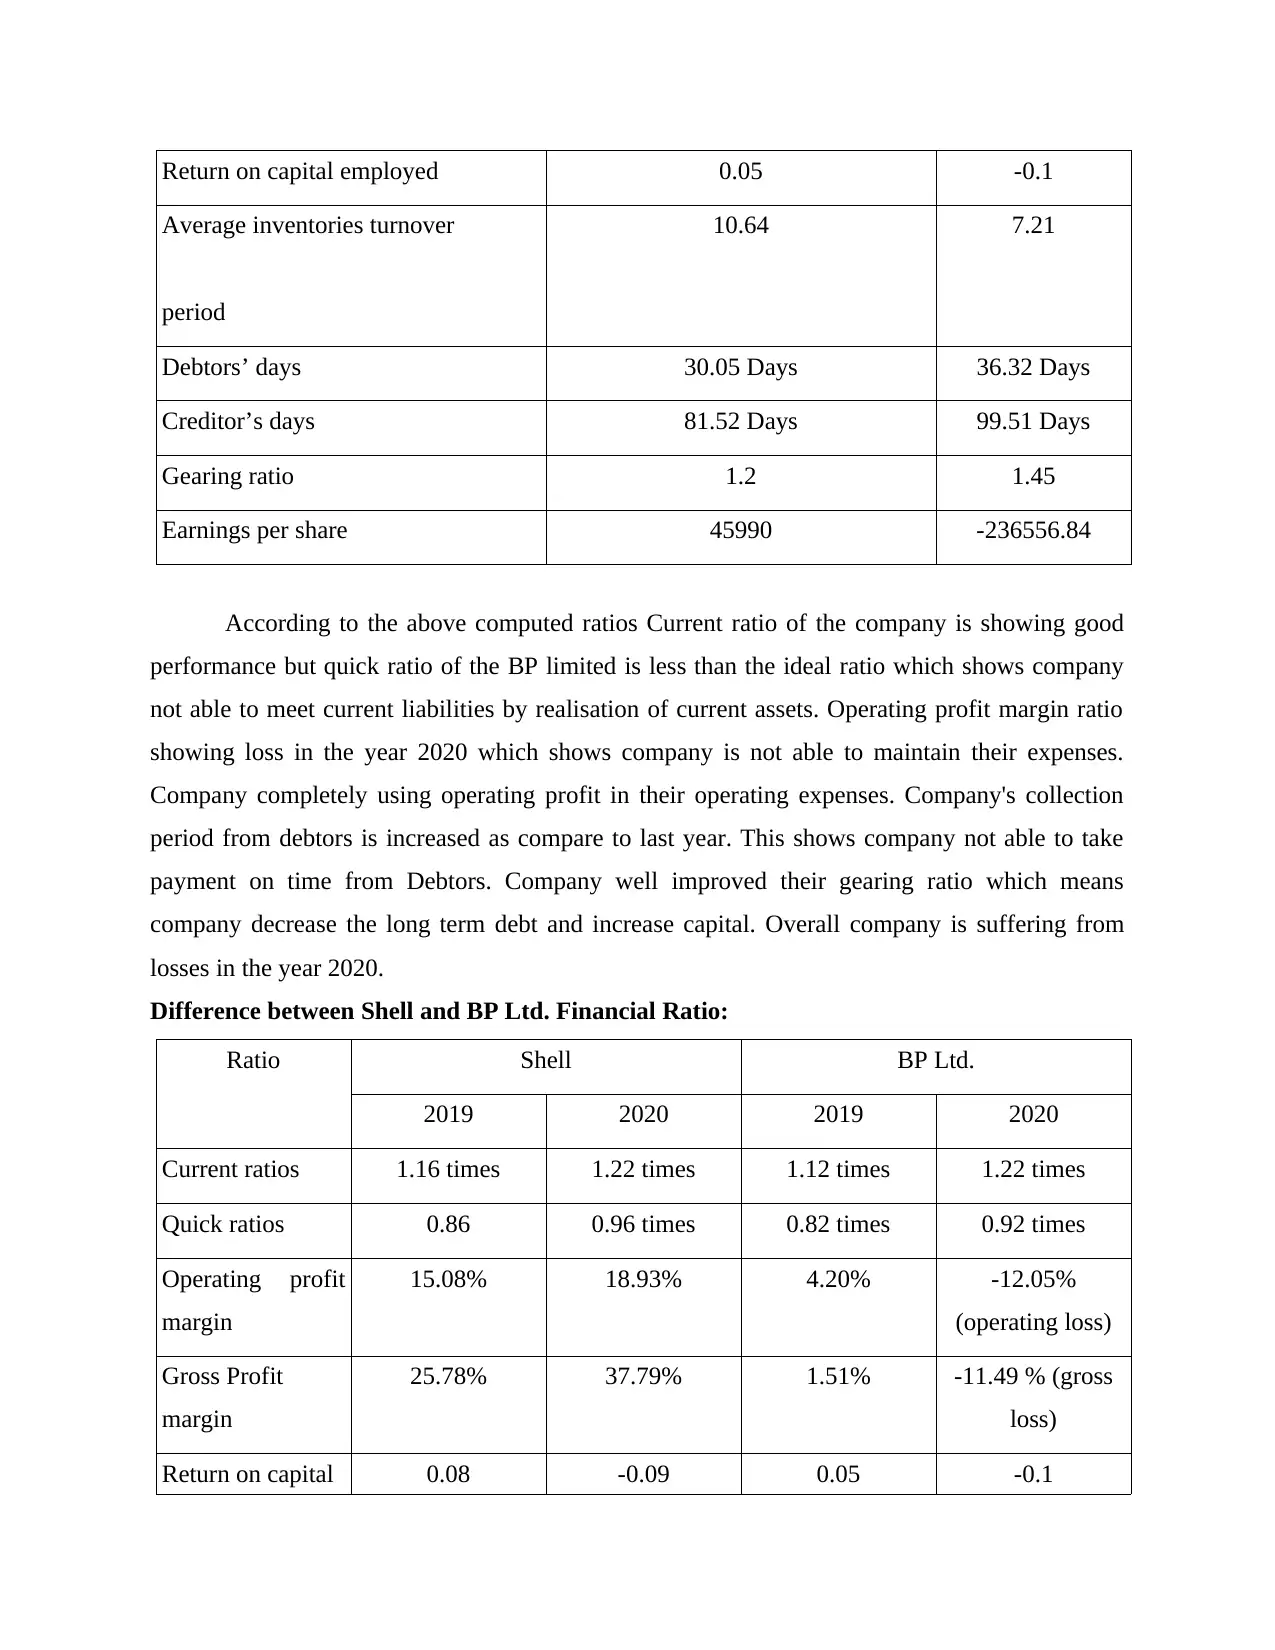
According to the above computed ratios Current ratio of the company is showing good
performance but quick ratio of the BP limited is less than the ideal ratio which shows company
not able to meet current liabilities by realisation of current assets. Operating profit margin ratio
showing loss in the year 2020 which shows company is not able to maintain their expenses.
Company completely using operating profit in their operating expenses. Company's collection
period from debtors is increased as compare to last year. This shows company not able to take
payment on time from Debtors. Company well improved their gearing ratio which means
company decrease the long term debt and increase capital. Overall company is suffering from
losses in the year 2020.
Difference between Shell and BP Ltd. Financial Ratio:
Ratio Shell BP Ltd.
2019 2020 2019 2020
Current ratios 1.16 times 1.22 times 1.12 times 1.22 times
Quick ratios 0.86 0.96 times 0.82 times 0.92 times
Operating profit
margin
15.08% 18.93% 4.20% -12.05%
(operating loss)
Gross Profit
margin
25.78% 37.79% 1.51% -11.49 % (gross
loss)
Return on capital 0.08 -0.09 0.05 -0.1
Average inventories turnover
period
10.64 7.21
Debtors’ days 30.05 Days 36.32 Days
Creditor’s days 81.52 Days 99.51 Days
Gearing ratio 1.2 1.45
Earnings per share 45990 -236556.84
According to the above computed ratios Current ratio of the company is showing good
performance but quick ratio of the BP limited is less than the ideal ratio which shows company
not able to meet current liabilities by realisation of current assets. Operating profit margin ratio
showing loss in the year 2020 which shows company is not able to maintain their expenses.
Company completely using operating profit in their operating expenses. Company's collection
period from debtors is increased as compare to last year. This shows company not able to take
payment on time from Debtors. Company well improved their gearing ratio which means
company decrease the long term debt and increase capital. Overall company is suffering from
losses in the year 2020.
Difference between Shell and BP Ltd. Financial Ratio:
Ratio Shell BP Ltd.
2019 2020 2019 2020
Current ratios 1.16 times 1.22 times 1.12 times 1.22 times
Quick ratios 0.86 0.96 times 0.82 times 0.92 times
Operating profit
margin
15.08% 18.93% 4.20% -12.05%
(operating loss)
Gross Profit
margin
25.78% 37.79% 1.51% -11.49 % (gross
loss)
Return on capital 0.08 -0.09 0.05 -0.1
Paraphrase This Document
Need a fresh take? Get an instant paraphrase of this document with our AI Paraphraser
employed
Average
inventories
turnover
period
11.32 5.16 10.64 7.21
Debtors’ days 61.08 Days 44.03 Days 30.05 Days 36.32 Days
Creditor’s days 42.55 Days 70.64 Days 81.52 Days 99.51 Days
Gearing ratio 0.43 0.58 1.2 1.45
Earnings per
share
4.16 The company has
earned loss in this
year
4.59 The company has
earned loss in this
year
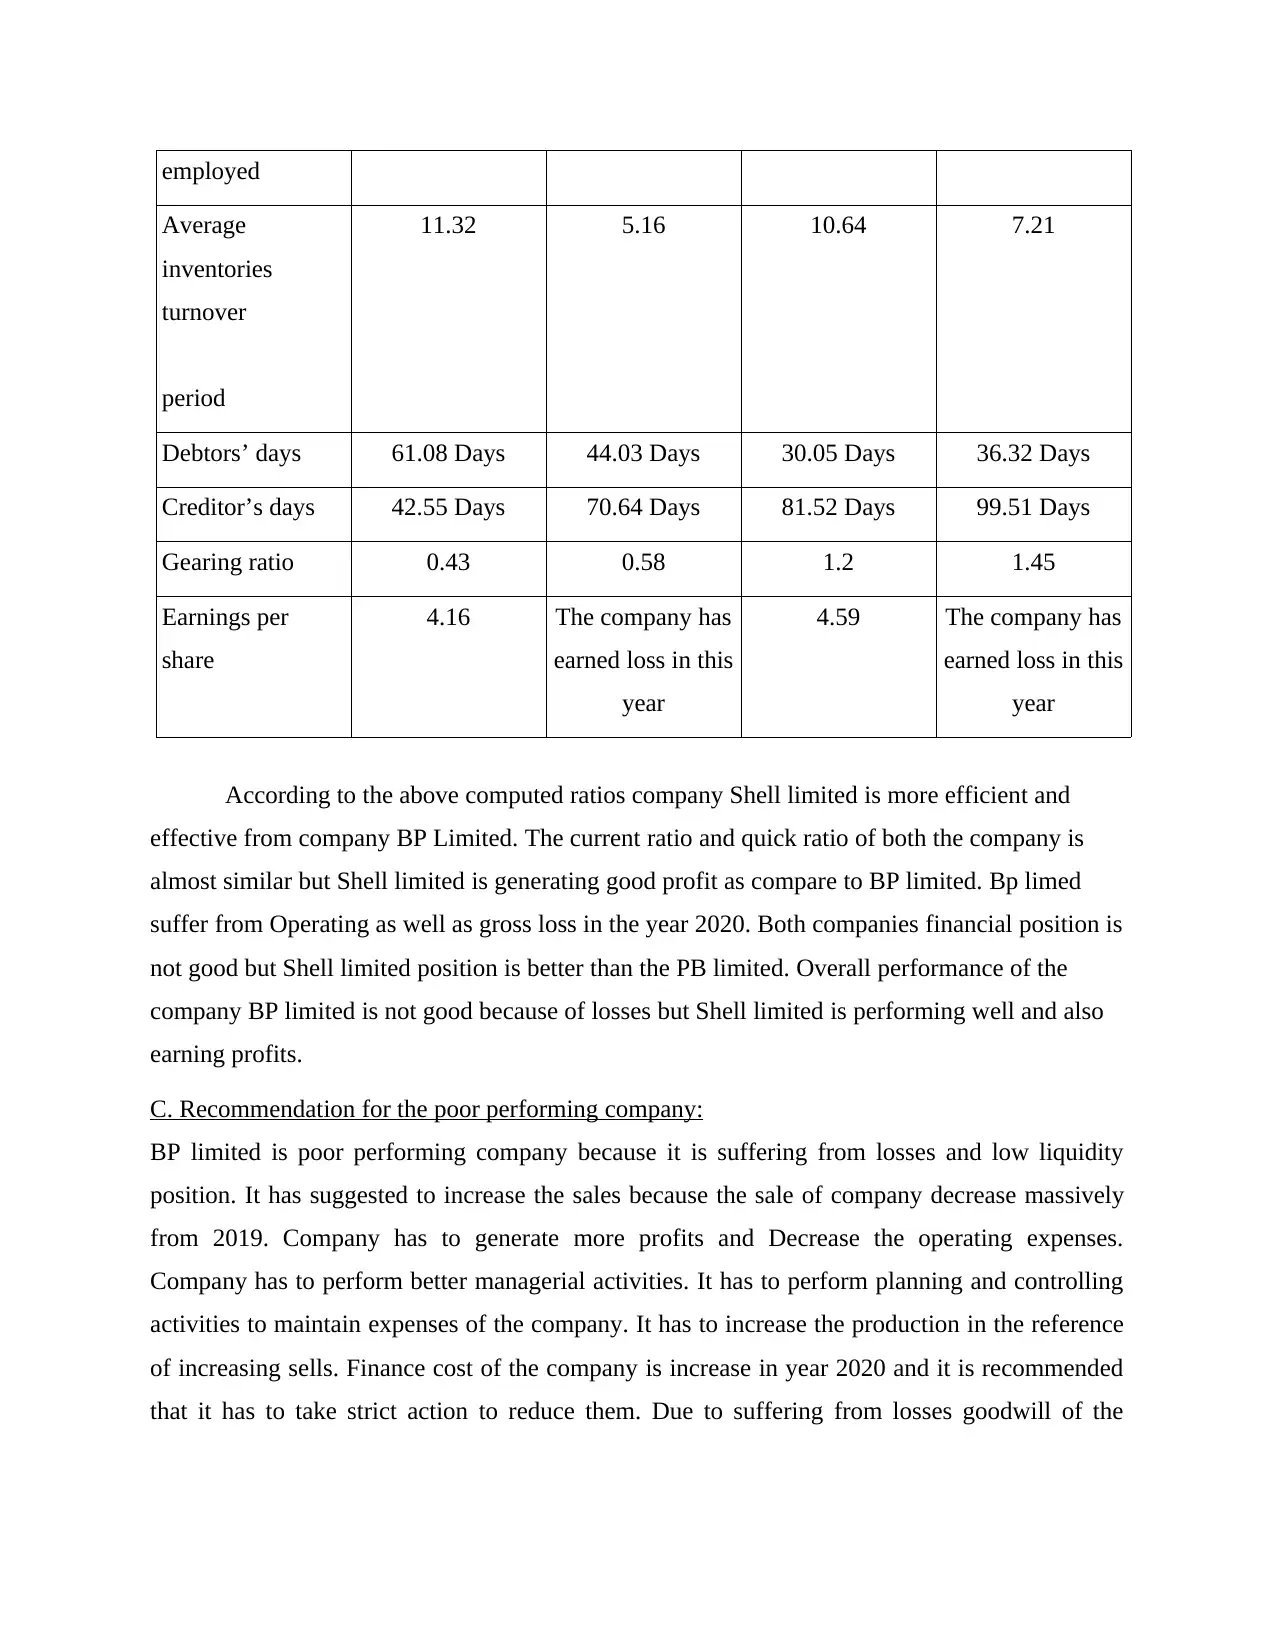
According to the above computed ratios company Shell limited is more efficient and
effective from company BP Limited. The current ratio and quick ratio of both the company is
almost similar but Shell limited is generating good profit as compare to BP limited. Bp limed
suffer from Operating as well as gross loss in the year 2020. Both companies financial position is
not good but Shell limited position is better than the PB limited. Overall performance of the
company BP limited is not good because of losses but Shell limited is performing well and also
earning profits.
C. Recommendation for the poor performing company:
BP limited is poor performing company because it is suffering from losses and low liquidity
position. It has suggested to increase the sales because the sale of company decrease massively
from 2019. Company has to generate more profits and Decrease the operating expenses.
Company has to perform better managerial activities. It has to perform planning and controlling
activities to maintain expenses of the company. It has to increase the production in the reference
of increasing sells. Finance cost of the company is increase in year 2020 and it is recommended
that it has to take strict action to reduce them. Due to suffering from losses goodwill of the
Average
inventories
turnover
period
11.32 5.16 10.64 7.21
Debtors’ days 61.08 Days 44.03 Days 30.05 Days 36.32 Days
Creditor’s days 42.55 Days 70.64 Days 81.52 Days 99.51 Days
Gearing ratio 0.43 0.58 1.2 1.45
Earnings per
share
4.16 The company has
earned loss in this
year
4.59 The company has
earned loss in this
year
According to the above computed ratios company Shell limited is more efficient and
effective from company BP Limited. The current ratio and quick ratio of both the company is
almost similar but Shell limited is generating good profit as compare to BP limited. Bp limed
suffer from Operating as well as gross loss in the year 2020. Both companies financial position is
not good but Shell limited position is better than the PB limited. Overall performance of the
company BP limited is not good because of losses but Shell limited is performing well and also
earning profits.
C. Recommendation for the poor performing company:
BP limited is poor performing company because it is suffering from losses and low liquidity
position. It has suggested to increase the sales because the sale of company decrease massively
from 2019. Company has to generate more profits and Decrease the operating expenses.
Company has to perform better managerial activities. It has to perform planning and controlling
activities to maintain expenses of the company. It has to increase the production in the reference
of increasing sells. Finance cost of the company is increase in year 2020 and it is recommended
that it has to take strict action to reduce them. Due to suffering from losses goodwill of the
company is also damaged. Company's net assets also decreased. It has to also manage the cash
and cash equivalents because there is decrease in them from 2019.
D. Limitations of financial ratios to measuring a company’s performance:
Ratio help in measuring results and analysing performance of a company. This is an important
tool for outsider or investors to measuring company's performance. Ratios are computed on the
basis of past results. There are many limitations of the ratios which creates problems in analysing
them (Al-Okaily and Naueihed, 2019).
Past actual company's financial statement help in calculating ratios so that it is not
possible that the result are same in future. They only shows current position of the
company.
Ratios are calculated on the basis of current cost but in future cost may be increased so
the results of ratio is unusual (Andayani and et.al., 2021).
If inflation rate is changed in the period of computation of ratios, this means that the
values are not included for such period. The value of different period is not comparable
without adjusting inflation.
Every company have its own policies of recording transactions so that comparing of
different ratios of different companies is inaccurate just like comparison of mangos and
grapes. For example, if two companies using different methods of depreciation then the
results of ratios are not usable (Ashrafi, 2019).
Ratios are calculated on the basis of normal business environment but business
environment may change during the year. For example company trade payable are less in
the period of massive sale but in down market environment payable are more.
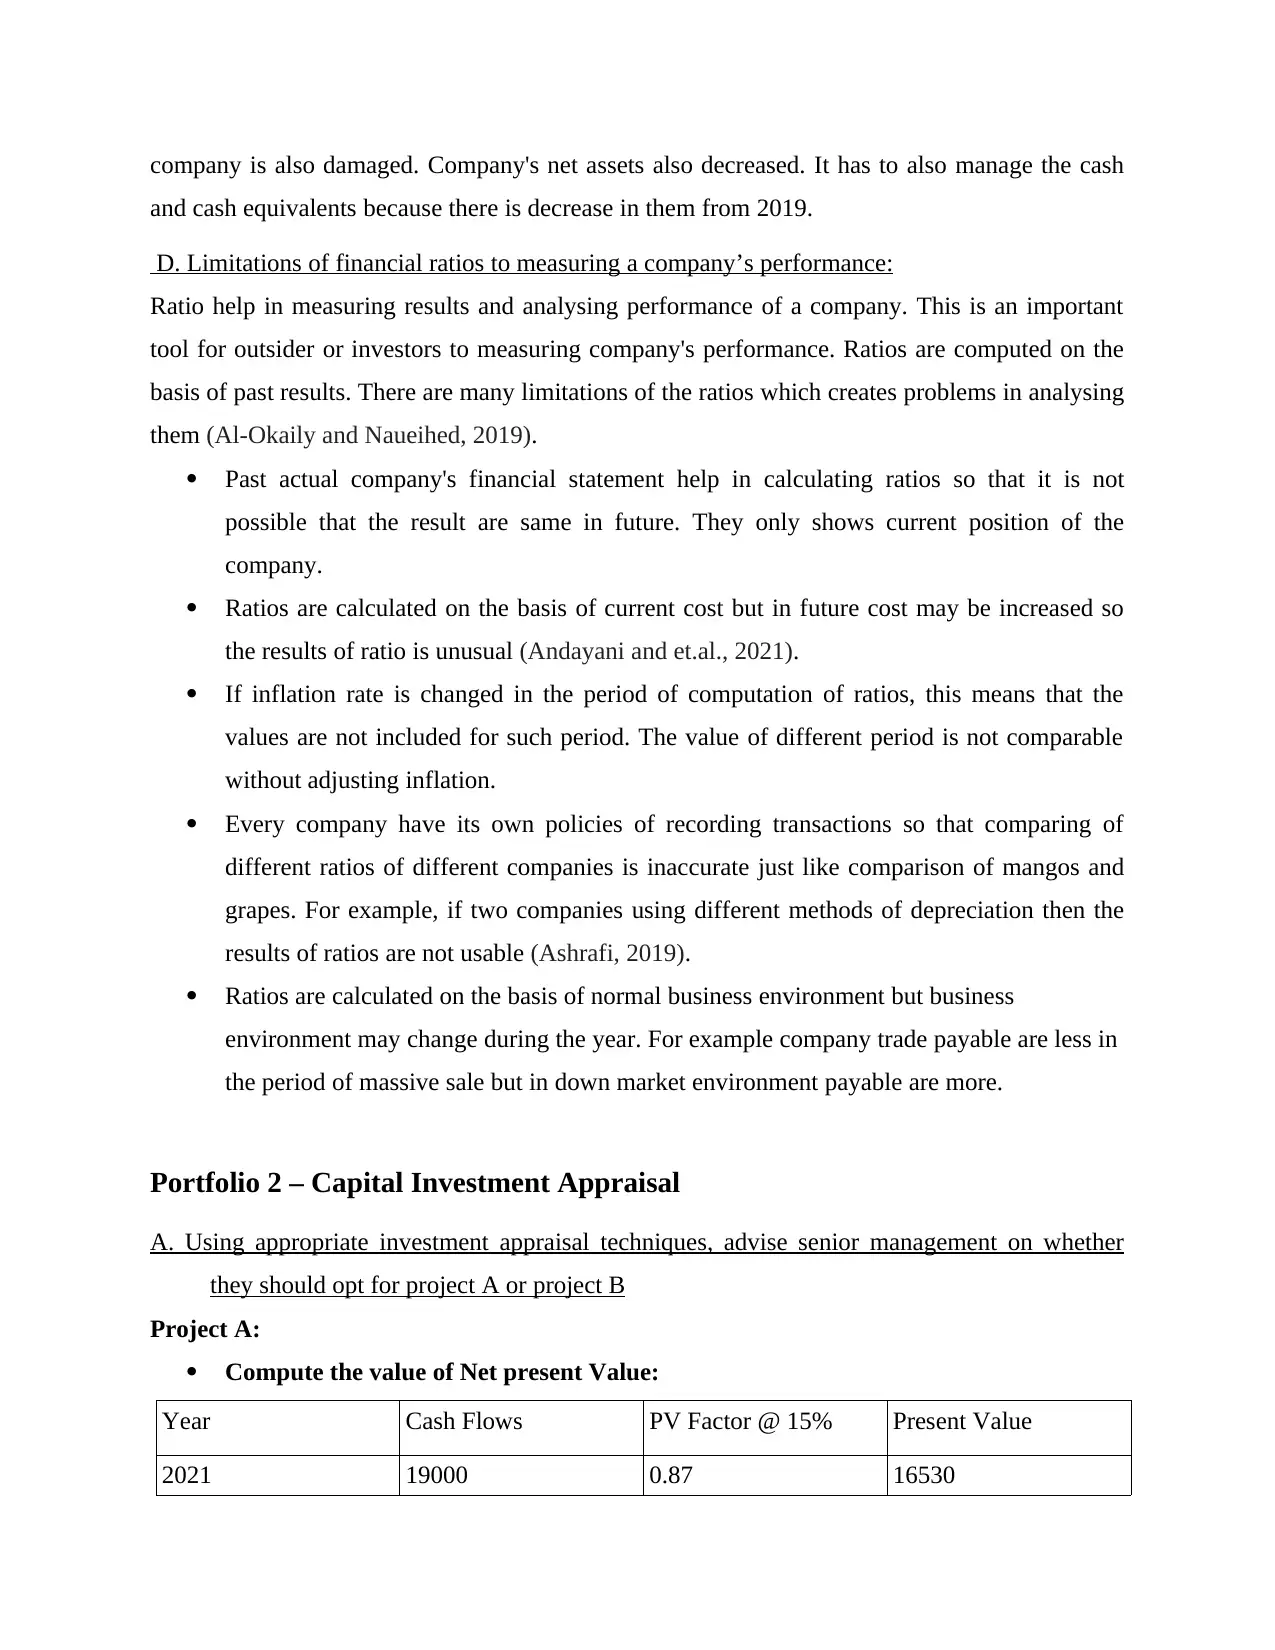
Portfolio 2 – Capital Investment Appraisal
A. Using appropriate investment appraisal techniques, advise senior management on whether
they should opt for project A or project B
Project A:
Compute the value of Net present Value:
Year Cash Flows PV Factor @ 15% Present Value
2021 19000 0.87 16530
and cash equivalents because there is decrease in them from 2019.
D. Limitations of financial ratios to measuring a company’s performance:
Ratio help in measuring results and analysing performance of a company. This is an important
tool for outsider or investors to measuring company's performance. Ratios are computed on the
basis of past results. There are many limitations of the ratios which creates problems in analysing
them (Al-Okaily and Naueihed, 2019).
Past actual company's financial statement help in calculating ratios so that it is not
possible that the result are same in future. They only shows current position of the
company.
Ratios are calculated on the basis of current cost but in future cost may be increased so
the results of ratio is unusual (Andayani and et.al., 2021).
If inflation rate is changed in the period of computation of ratios, this means that the
values are not included for such period. The value of different period is not comparable
without adjusting inflation.
Every company have its own policies of recording transactions so that comparing of
different ratios of different companies is inaccurate just like comparison of mangos and
grapes. For example, if two companies using different methods of depreciation then the
results of ratios are not usable (Ashrafi, 2019).
Ratios are calculated on the basis of normal business environment but business
environment may change during the year. For example company trade payable are less in
the period of massive sale but in down market environment payable are more.
Portfolio 2 – Capital Investment Appraisal
A. Using appropriate investment appraisal techniques, advise senior management on whether
they should opt for project A or project B
Project A:
Compute the value of Net present Value:
Year Cash Flows PV Factor @ 15% Present Value
2021 19000 0.87 16530
⊘ This is a preview!⊘
Do you want full access?
Subscribe today to unlock all pages.
Trusted by 1+ million students worldwide
1 out of 18
Related Documents


Your All-in-One AI-Powered Toolkit for Academic Success.
+13062052269
info@desklib.com
Available 24*7 on WhatsApp / Email
![[object Object]](/_next/static/media/star-bottom.7253800d.svg)
Unlock your academic potential
Copyright © 2020–2026 A2Z Services. All Rights Reserved. Developed and managed by ZUCOL.