Managerial Finance Report: Analysis of JD and SD Financial Performance

Verified

Added on  2020/06/06

|30
|4984
|25
Report
AI Summary
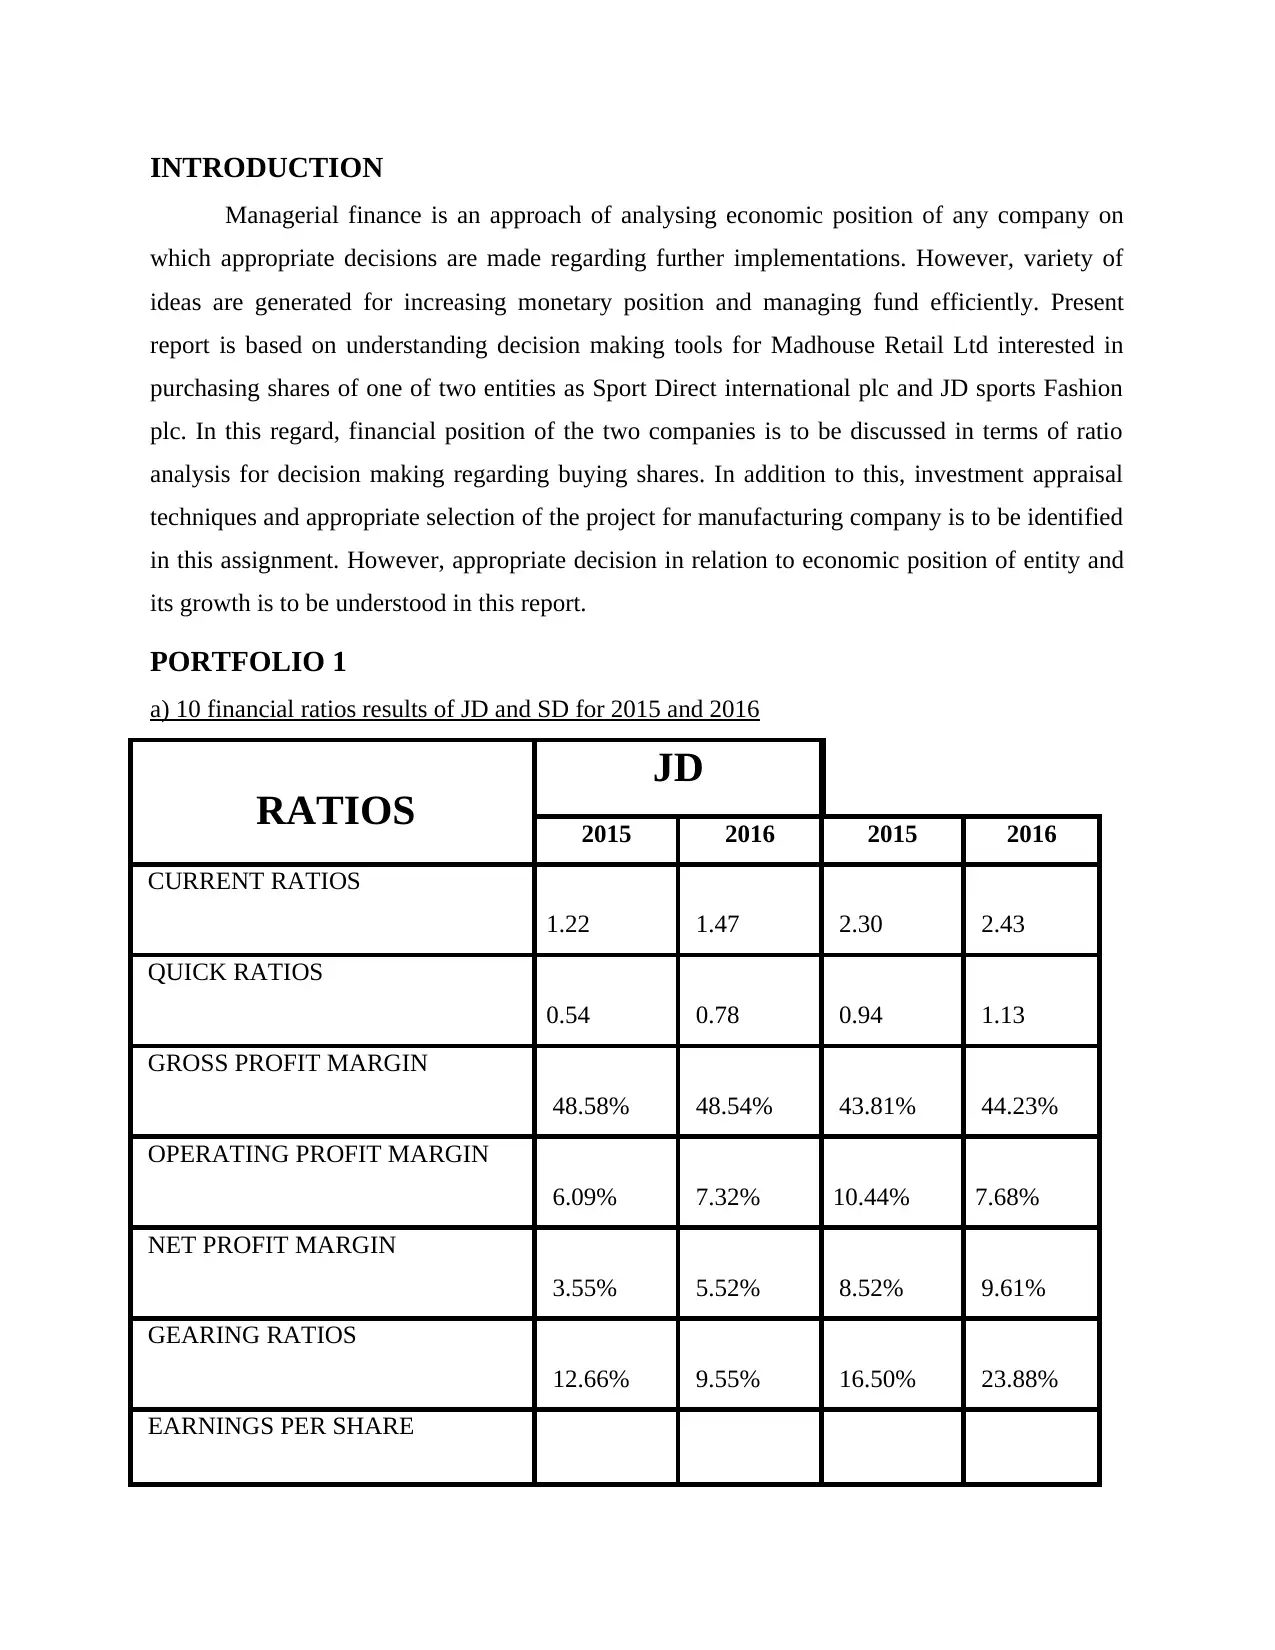
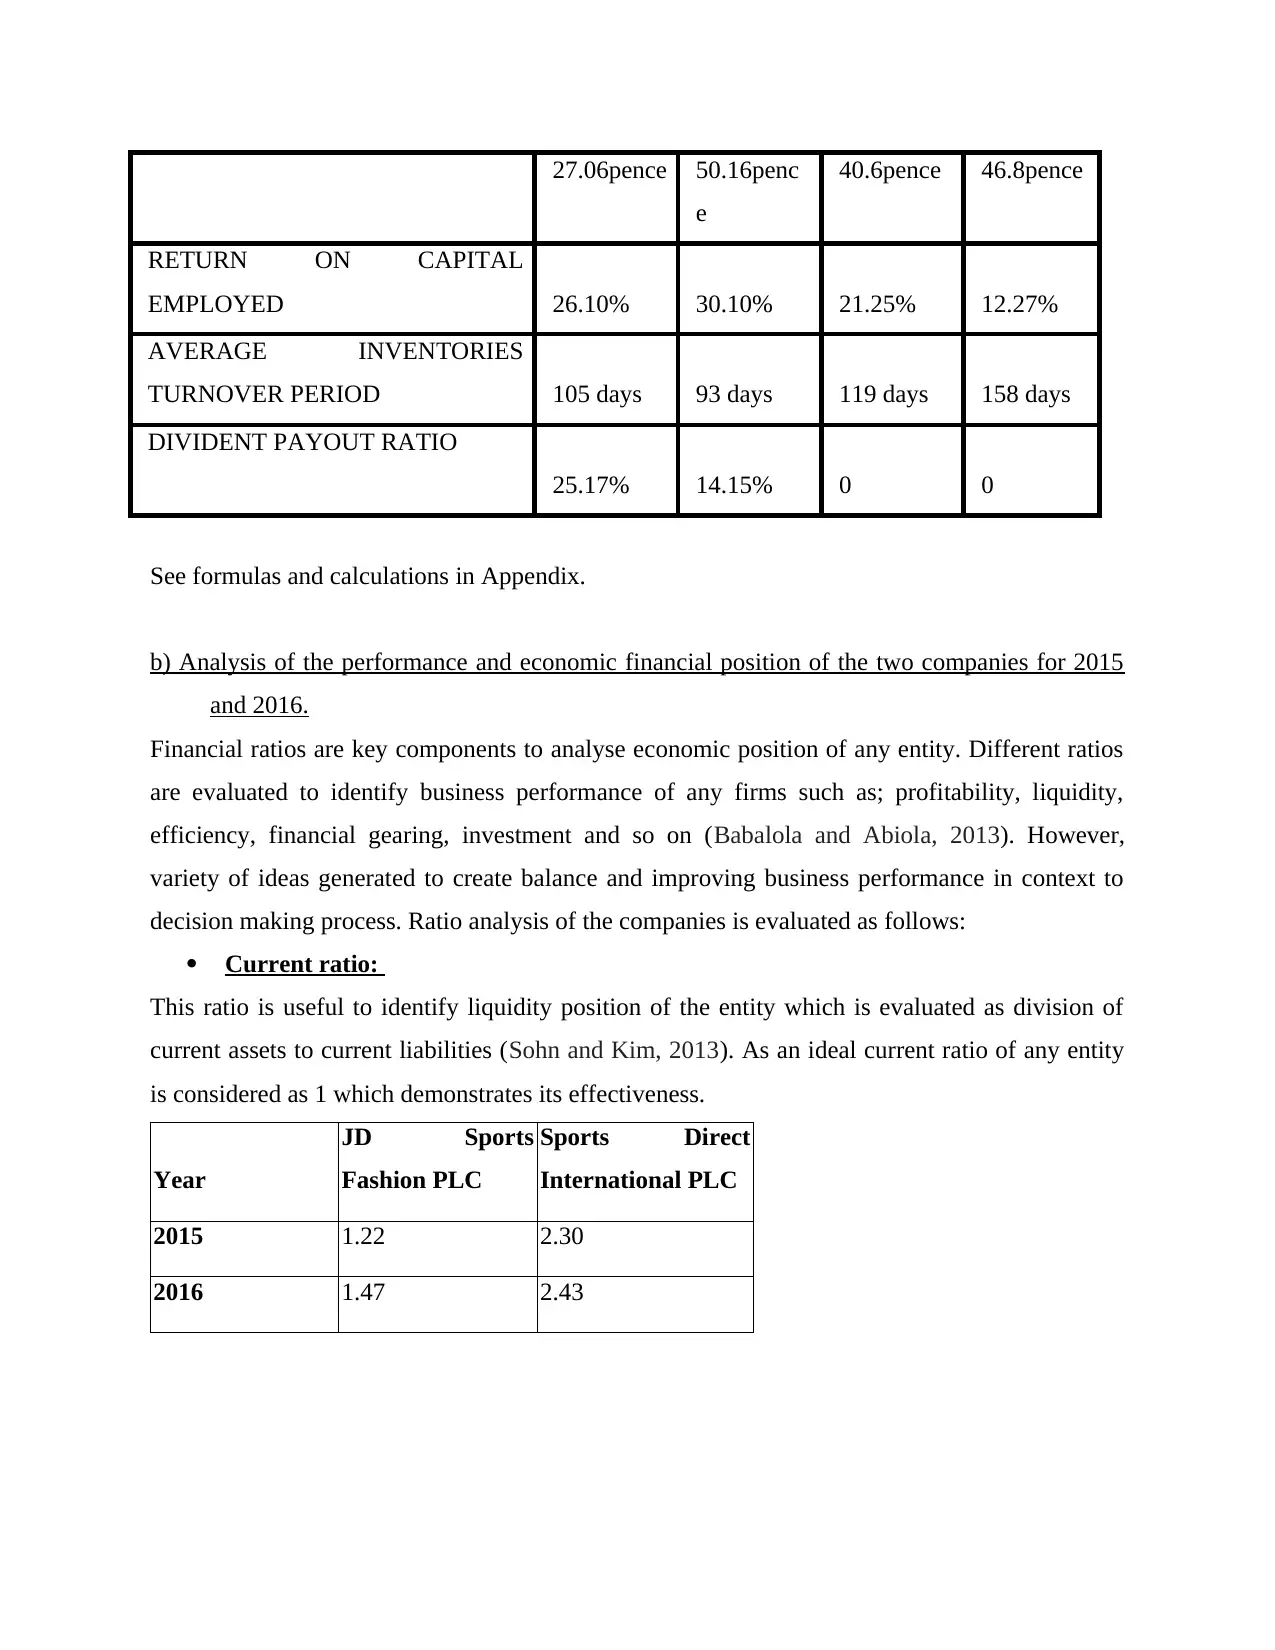
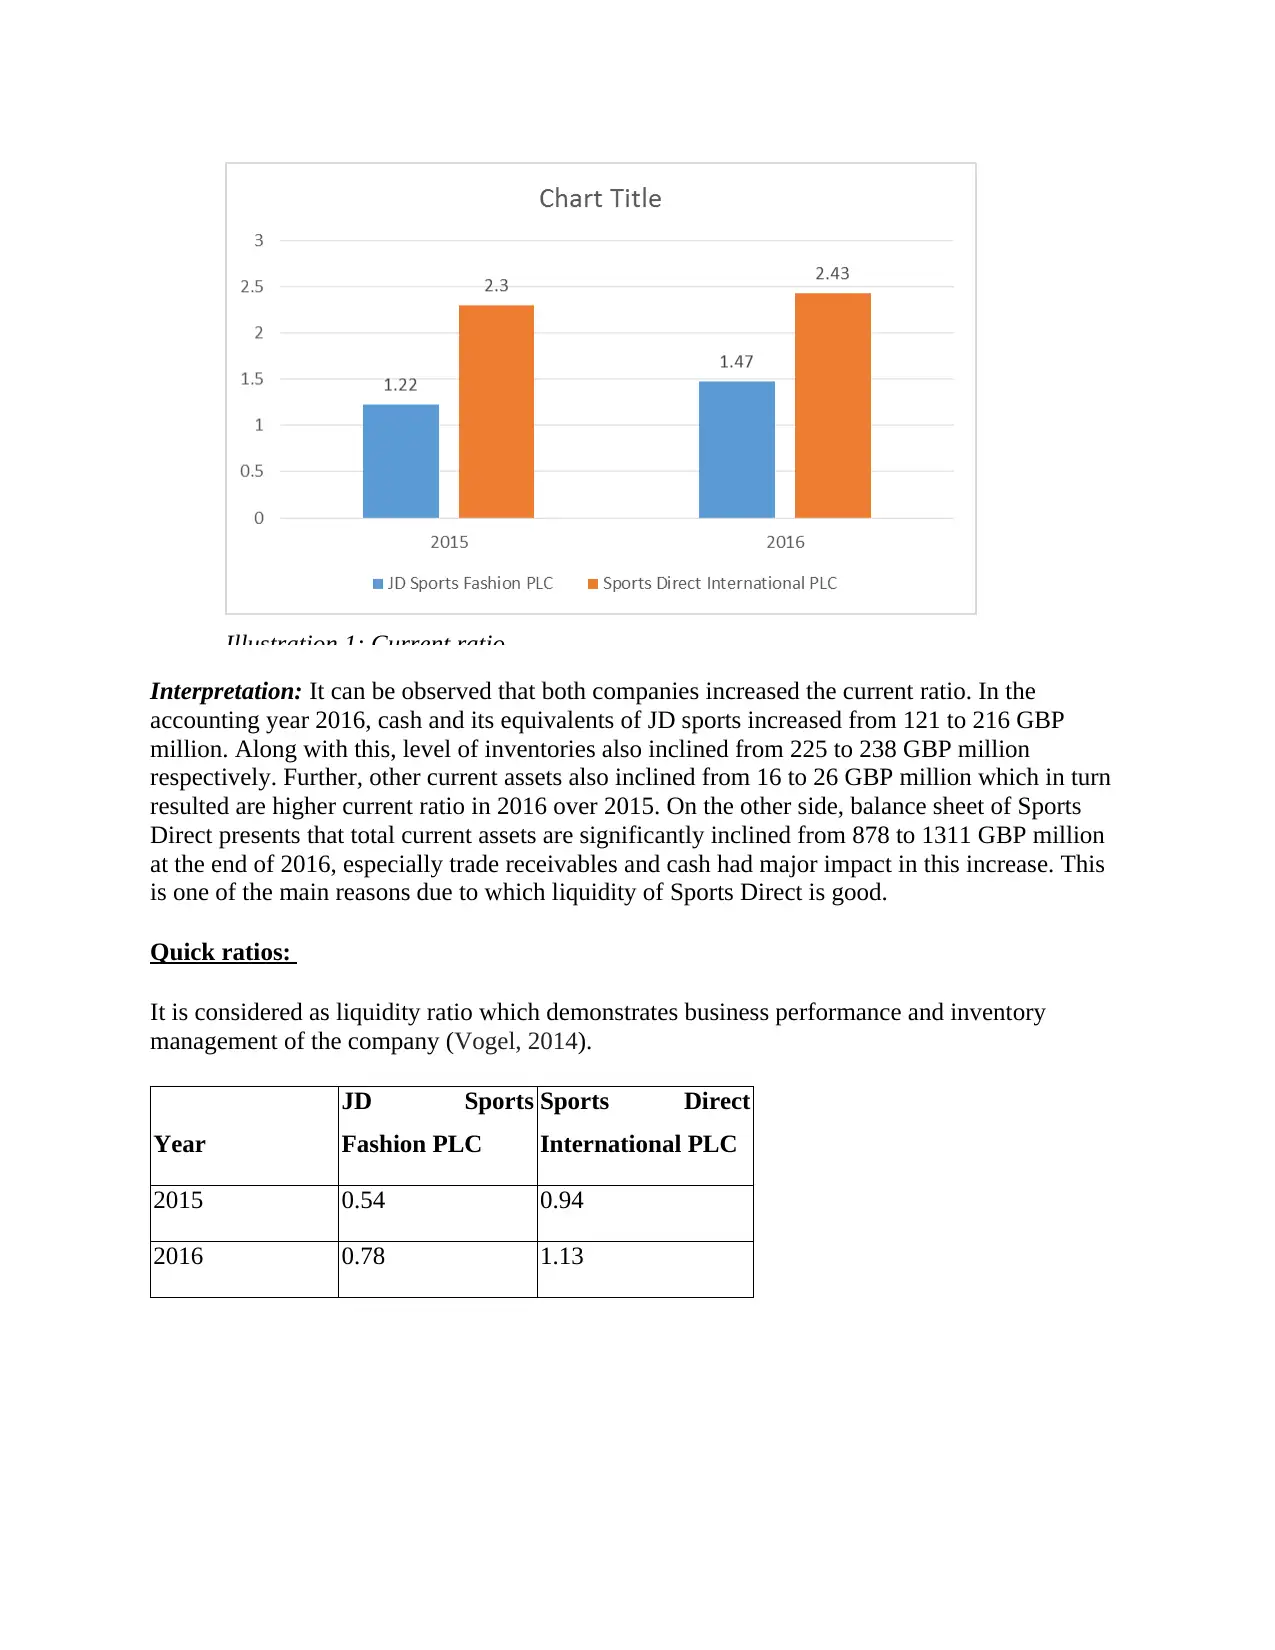
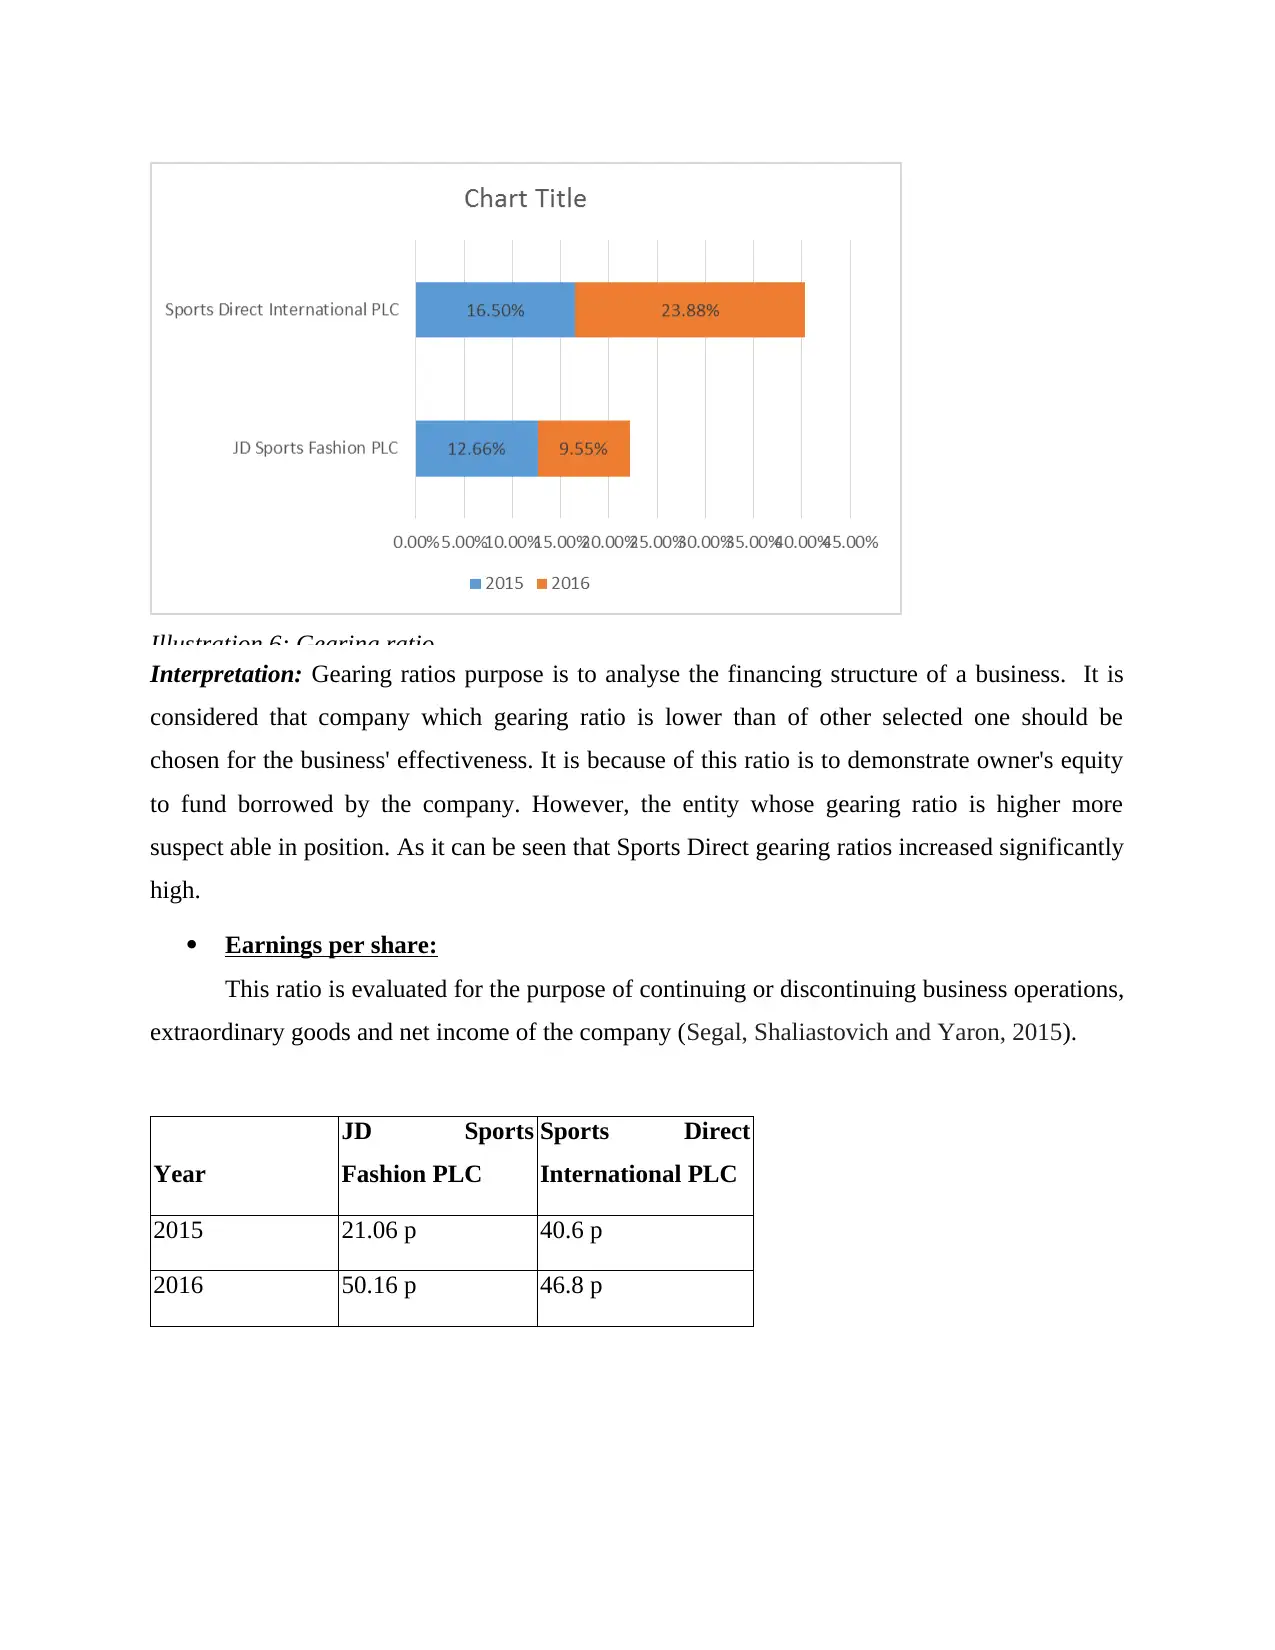
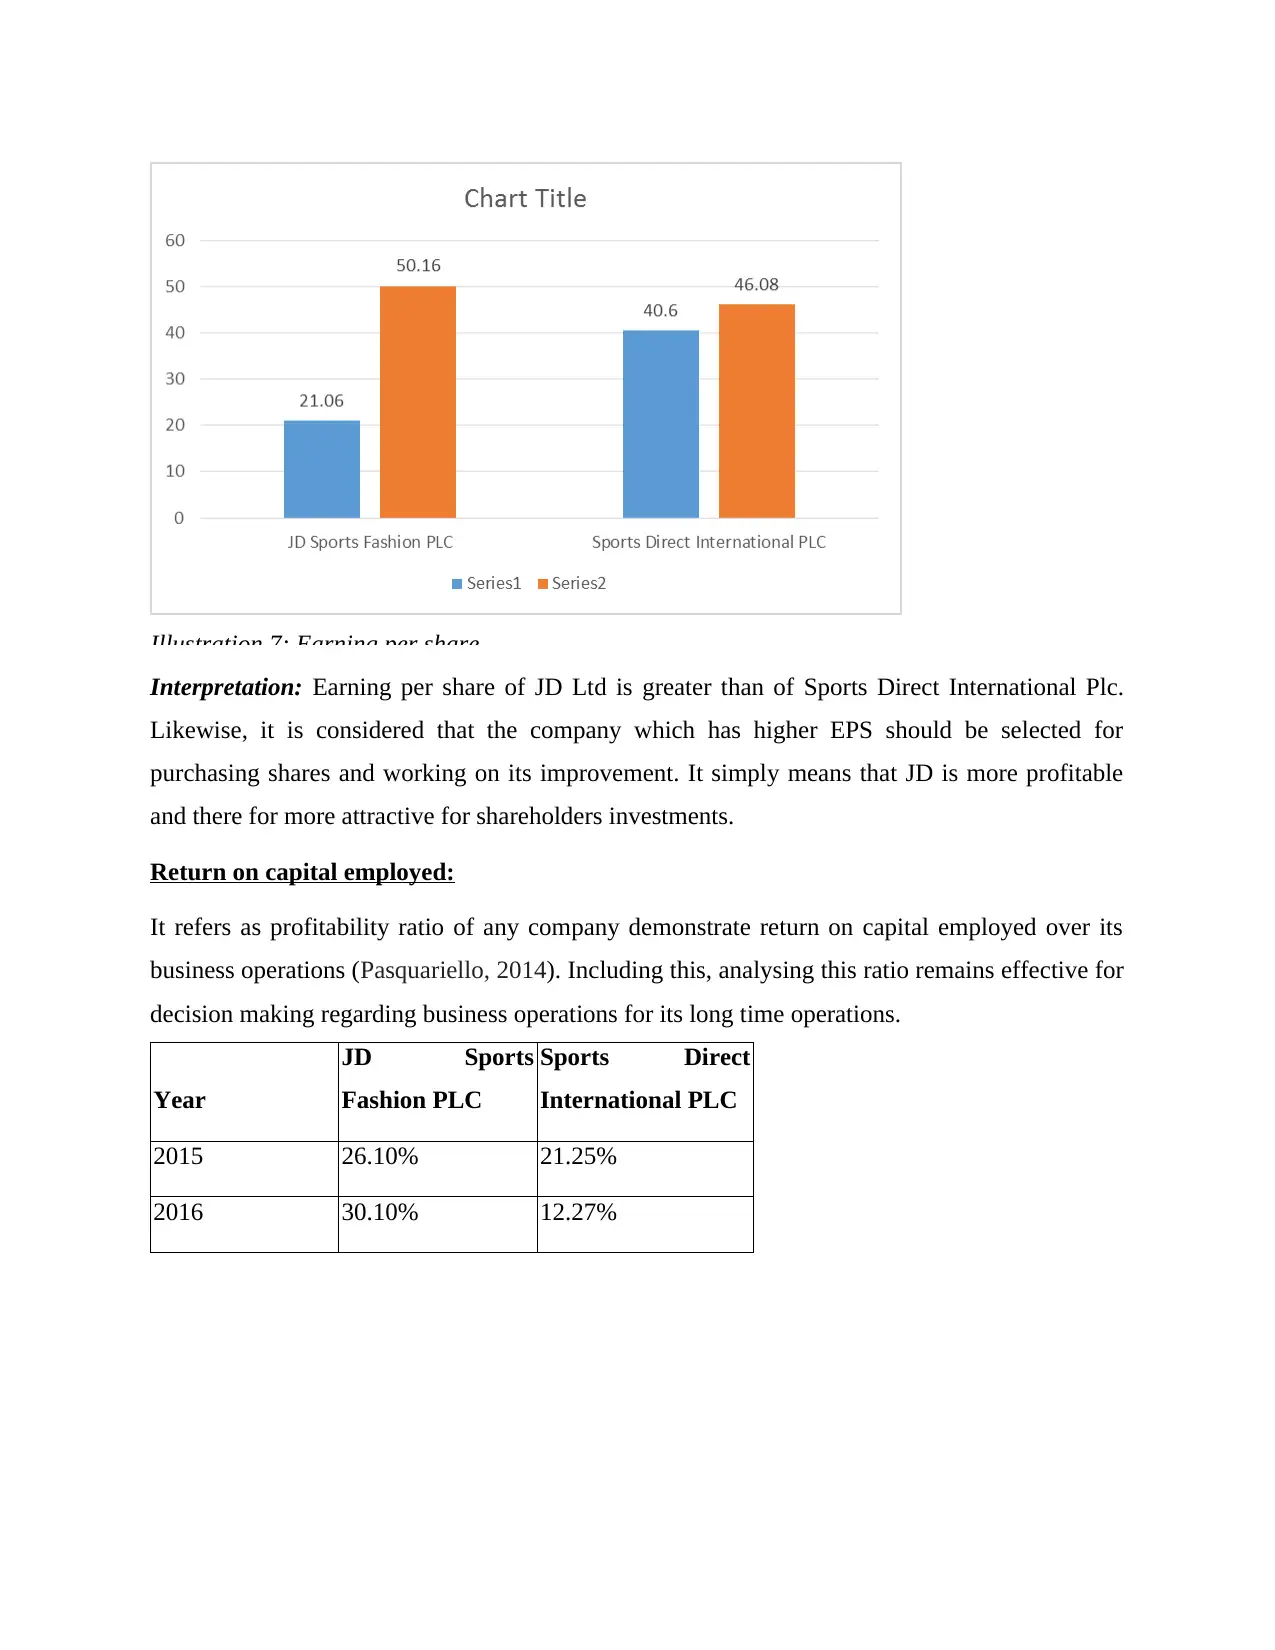
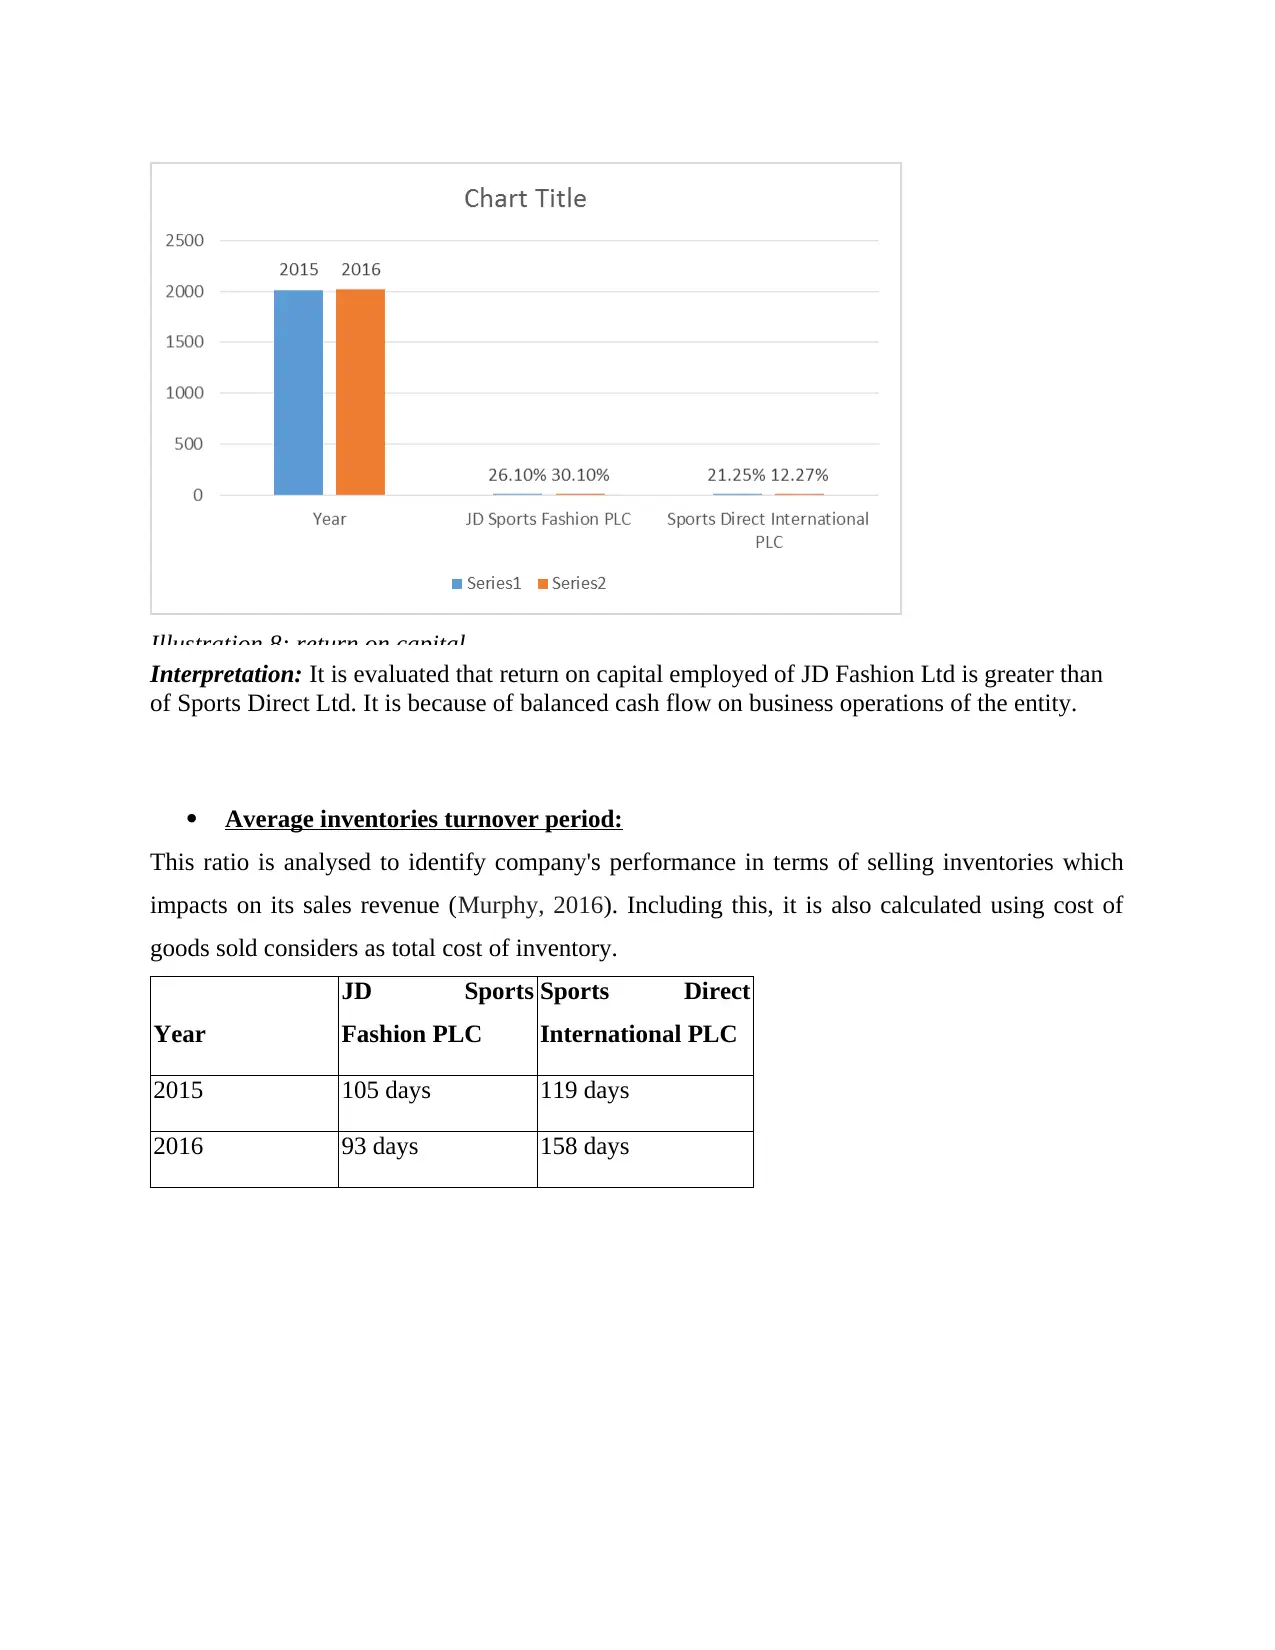
This report provides a comprehensive analysis of managerial finance, focusing on the financial performance of JD Sports Fashion PLC and Sports Direct International PLC. The report begins with an introduction to managerial finance and its application in decision-making, particularly in the context of share purchases. The core of the report is Portfolio 1, which includes a detailed analysis of ten key financial ratios for both companies over the years 2015 and 2016. These ratios include current ratio, quick ratio, gross profit margin, operating profit margin, net profit margin, gearing ratio, earnings per share, return on capital employed, average inventories turnover, and dividend payout ratio. The analysis compares the performance of the two companies, highlighting their strengths and weaknesses based on these ratios. Portfolio 2 then discusses the limitations of investment appraisal techniques in long-term decision-making. The report concludes with recommendations for improving financial performance, such as inventory turnover optimization and budgetary control. Formulas, calculations, and interpretations are provided to support the analysis, making it a valuable resource for understanding financial performance and investment potential. The report is concluded with references and an appendix with the calculations.
Document Page
MANAGERIAL FINANCE
tabler-icon-diamond-filled.svg

Paraphrase This Document

Need a fresh take? Get an instant paraphrase of this document with our AI Paraphraser
Document Page
TABLE OF CONTENTS
INTRODUCTION...........................................................................................................................3
PORTFOLIO 1.................................................................................................................................3
b) Analysis of the performance and economic financial position of the two companies for
2015 and 2016.............................................................................................................................4
c) Recommendations to improve financial performance ...........................................................9
d) Limitations of financial ratios and interpretation.................................................................10
PORTFOLIO 2...............................................................................................................................11
b) Limitations of using investment appraisal techniques for long time decision making.........15
CONCLUSION..............................................................................................................................17
REFERENCES..............................................................................................................................18
Appendix…………………………………………………………………………………………21
Document Page
INTRODUCTION
Managerial finance is an approach of analysing economic position of any company on
which appropriate decisions are made regarding further implementations. However, variety of
ideas are generated for increasing monetary position and managing fund efficiently. Present
report is based on understanding decision making tools for Madhouse Retail Ltd interested in
purchasing shares of one of two entities as Sport Direct international plc and JD sports Fashion
plc. In this regard, financial position of the two companies is to be discussed in terms of ratio
analysis for decision making regarding buying shares. In addition to this, investment appraisal
techniques and appropriate selection of the project for manufacturing company is to be identified
in this assignment. However, appropriate decision in relation to economic position of entity and
its growth is to be understood in this report.
PORTFOLIO 1
a) 10 financial ratios results of JD and SD for 2015 and 2016
RATIOS
JD
2015 2016 2015 2016
CURRENT RATIOS
1.22 1.47 2.30 2.43
QUICK RATIOS
0.54 0.78 0.94 1.13
GROSS PROFIT MARGIN
48.58% 48.54% 43.81% 44.23%
OPERATING PROFIT MARGIN
6.09% 7.32% 10.44% 7.68%
NET PROFIT MARGIN
3.55% 5.52% 8.52% 9.61%
GEARING RATIOS
12.66% 9.55% 16.50% 23.88%
EARNINGS PER SHARE
Document Page
27.06pence 50.16penc
e
40.6pence 46.8pence
RETURN ON CAPITAL
EMPLOYED 26.10% 30.10% 21.25% 12.27%
AVERAGE INVENTORIES
TURNOVER PERIOD 105 days 93 days 119 days 158 days
DIVIDENT PAYOUT RATIO
25.17% 14.15% 0 0
See formulas and calculations in Appendix.
b) Analysis of the performance and economic financial position of the two companies for 2015
and 2016.
Financial ratios are key components to analyse economic position of any entity. Different ratios
are evaluated to identify business performance of any firms such as; profitability, liquidity,
efficiency, financial gearing, investment and so on (Babalola and Abiola, 2013). However,
variety of ideas generated to create balance and improving business performance in context to
decision making process. Ratio analysis of the companies is evaluated as follows:
Current ratio:
This ratio is useful to identify liquidity position of the entity which is evaluated as division of
current assets to current liabilities (Sohn and Kim, 2013). As an ideal current ratio of any entity
is considered as 1 which demonstrates its effectiveness.
Year
JD Sports
Fashion PLC
Sports Direct
International PLC
2015 1.22 2.30
2016 1.47 2.43
tabler-icon-diamond-filled.svg

Paraphrase This Document

Need a fresh take? Get an instant paraphrase of this document with our AI Paraphraser
Document Page
Illustration 1: Current ratio
Interpretation: It can be observed that both companies increased the current ratio. In the
accounting year 2016, cash and its equivalents of JD sports increased from 121 to 216 GBP
million. Along with this, level of inventories also inclined from 225 to 238 GBP million
respectively. Further, other current assets also inclined from 16 to 26 GBP million which in turn
resulted are higher current ratio in 2016 over 2015. On the other side, balance sheet of Sports
Direct presents that total current assets are significantly inclined from 878 to 1311 GBP million
at the end of 2016, especially trade receivables and cash had major impact in this increase. This
is one of the main reasons due to which liquidity of Sports Direct is good.
Quick ratios:
It is considered as liquidity ratio which demonstrates business performance and inventory
management of the company (Vogel, 2014).
Year
JD Sports
Fashion PLC
Sports Direct
International PLC
2015 0.54 0.94
2016 0.78 1.13
Document Page
Illustration 2: Quick ratio
Interpretation: Analysing quick ratio it can be concluded that JD with weak 0.78 ratio in 2016
indicate poor liquidity position. That would indicate that they will not be able to pay all of their current
debt liabilities using only quick assets. On the other side SD 1.13 ratio in 2016 puts them in a better
position than the competing firm as with this figures it can be stated that after paying off all of their
current liabilities with quick assets they will still have assets left over.
Gross profit margin:
It is profitability ratio to identify financial position and profit level of the company
(Cheng, Ioannou and Serafeim, 2014).
Year
JD Sports
Fashion PLC
Sports Direct
International PLC
2015 48.58% 43.85%
2016 48.54% 44.23%
Document Page
Illustration 3: Gross profit ratio
Interpretation: It is analysed that JD Sports higher Gross profit margin score shows that they are
controlling their costs of raw materials and direct labour more efficiently than Sports Direct.
Operating profit margin:
Analysing this ratio remains effective to identify profit level of the company through
business operations (Midrigan and Xu, 2014
Year
JD Sports
Fashion PLC
Sports Direct
International PLC
2015 6.09% 10.44%
2016 7.32% 7.68%
tabler-icon-diamond-filled.svg

Paraphrase This Document

Need a fresh take? Get an instant paraphrase of this document with our AI Paraphraser
Document Page
Illustration 4: Operating profit ratio
Interpretation: On analysing individual entity's operation margin, it is observed that this profit
level of Sports Direct International plc has decreased in 2016 in comparison to 2015. While, on
the other hand, JD Fashion Plc's operation profit margin has increased which shows good
performance of its entity. Higher operating profit margin is more beneficial than a lower ratio
because this shows that the company is making enough money from its ongoing operations to
pay for its variable costs as well as its fixed costs.
Net profit margin:
It is a profitability ratio which shows profitability of the entity (Battiston and et.al. 2016).
Year
JD Sports
Fashion PLC
Sports Direct
International PLC
2015 3.55% 8.52%
2016 5.52% 9.61%
Document Page
Illustration 5: net margin ratio
Interpretation: As comparing net profit margin of both selected companies, it is recognised that
this performance of Sports Direct International Plc is higher than of JD Ltd. It is because of
differences in expenses incurred on additional overhead during business operations. On behalf
of analysing net profit margin of the companies, performance of JD Ltd in better than the other
one.
Gearing ratio:
It is considered as a fundamental ratio which expresses company's level in respect of long term
debt in comparison to the ratio of equity capital to capital employed (Bartram, Brown and
Waller, 2016).
Year
JD Sports
Fashion PLC
Sports Direct
International PLC
2015 12.66% 16.50%
2016 9.55% 23.88%
Document Page
Illustration 6: Gearing ratio
Interpretation: Gearing ratios purpose is to analyse the financing structure of a business. It is
considered that company which gearing ratio is lower than of other selected one should be
chosen for the business' effectiveness. It is because of this ratio is to demonstrate owner's equity
to fund borrowed by the company. However, the entity whose gearing ratio is higher more
suspect able in position. As it can be seen that Sports Direct gearing ratios increased significantly
high.
Earnings per share:
This ratio is evaluated for the purpose of continuing or discontinuing business operations,
extraordinary goods and net income of the company (Segal, Shaliastovich and Yaron, 2015).
Year
JD Sports
Fashion PLC
Sports Direct
International PLC
2015 21.06 p 40.6 p
2016 50.16 p 46.8 p
tabler-icon-diamond-filled.svg

Paraphrase This Document

Need a fresh take? Get an instant paraphrase of this document with our AI Paraphraser
Document Page
Illustration 7: Earning per share
Interpretation: Earning per share of JD Ltd is greater than of Sports Direct International Plc.
Likewise, it is considered that the company which has higher EPS should be selected for
purchasing shares and working on its improvement. It simply means that JD is more profitable
and there for more attractive for shareholders investments.
Return on capital employed:
It refers as profitability ratio of any company demonstrate return on capital employed over its
business operations (Pasquariello, 2014). Including this, analysing this ratio remains effective for
decision making regarding business operations for its long time operations.
Year
JD Sports
Fashion PLC
Sports Direct
International PLC
2015 26.10% 21.25%
2016 30.10% 12.27%
Document Page
Illustration 8: return on capital
Interpretation: It is evaluated that return on capital employed of JD Fashion Ltd is greater than
of Sports Direct Ltd. It is because of balanced cash flow on business operations of the entity.
Average inventories turnover period:
This ratio is analysed to identify company's performance in terms of selling inventories which
impacts on its sales revenue (Murphy, 2016). Including this, it is also calculated using cost of
goods sold considers as total cost of inventory.
Year
JD Sports
Fashion PLC
Sports Direct
International PLC
2015 105 days 119 days
2016 93 days 158 days
chevron_up_icon
1 out of 30
circle_padding
hide_on_mobile
zoom_out_icon
[object Object]