Managerial Finance: Share Purchase Decision for Sports Retailers, UK
VerifiedAdded on 2020/06/06
|20
|4269
|24
Report
AI Summary
This report, prepared for Madhouse Retail Ltd, compares the financial performance of two major UK sports goods retailers, Sports Direct International PLC and JD Sports Fashion PLC, to determine which company's shares would be a better investment. The analysis includes the calculation and interpretation of ten financial ratios for both companies from 2015 and 2016, assessing their liquidity, profitability, and solvency. The report also examines capital investment appraisal techniques to advise on investment choices and discusses the limitations of these techniques in long-term decision-making. The findings suggest that while both companies demonstrate growth, specific ratios indicate areas where each could improve, providing insights for potential investors. The report concludes with recommendations and acknowledges the limitations of using financial ratios in isolation.

Managerial Finance
Paraphrase This Document
Need a fresh take? Get an instant paraphrase of this document with our AI Paraphraser
TABLE OF CONTENTS
INTRODUCTION...........................................................................................................................1
Question 1. Comparing share of which company to be bought.......................................................1
A) Calculation of 10 financial ratios 2015 and 2016..................................................................1
B) Analysing the performance of both the companies for 2 years..............................................2
C) Recommendations of how financial performance could be improved.................................11
D) Discussing limitations of financial ratios.............................................................................12
Question 2 Capital investment appraisals......................................................................................12
A) Using appropriate investment appraisal techniques to advise which should be selected....12
B) Discussing limitations of using investment appraisals techniques in long term decision
making.......................................................................................................................................15
CONCLUSION..............................................................................................................................15
REFERENCES..............................................................................................................................17
INTRODUCTION
Finance is the most important part of everyday working of any company whether big or
small and the also need to manage it by identifying all potential sources of finance and selecting
best from alternative. The present report will be covering two of the major companies of UK in
sports goods retailers. As been the finance manager at Madhouse Retail Ltd who is interested in
buying shares of one of the two companies which are Sports direct international PLC and JD
sports fashion PLC. Sports direct international is famous British retailing company in sports
goods in UK and all over the world operating since 1982 and having 670 stores. While JD sports
fashion is also leading sports company of UK which was first to be listed on London Stock
exchange and is having 800+ stores including sports and branded fashion. The report will be
including the financial statements of both company like ratios and capital appraisals to show
which company is better and in what sense.
Question 1. Comparing share of which company to be bought.
A) Calculation of 10 financial ratios 2015 and 2016.
Companies Sports Direct International
PLC.
JD Sports fashion PLC.
Ratios 2015 2016 2015 2016
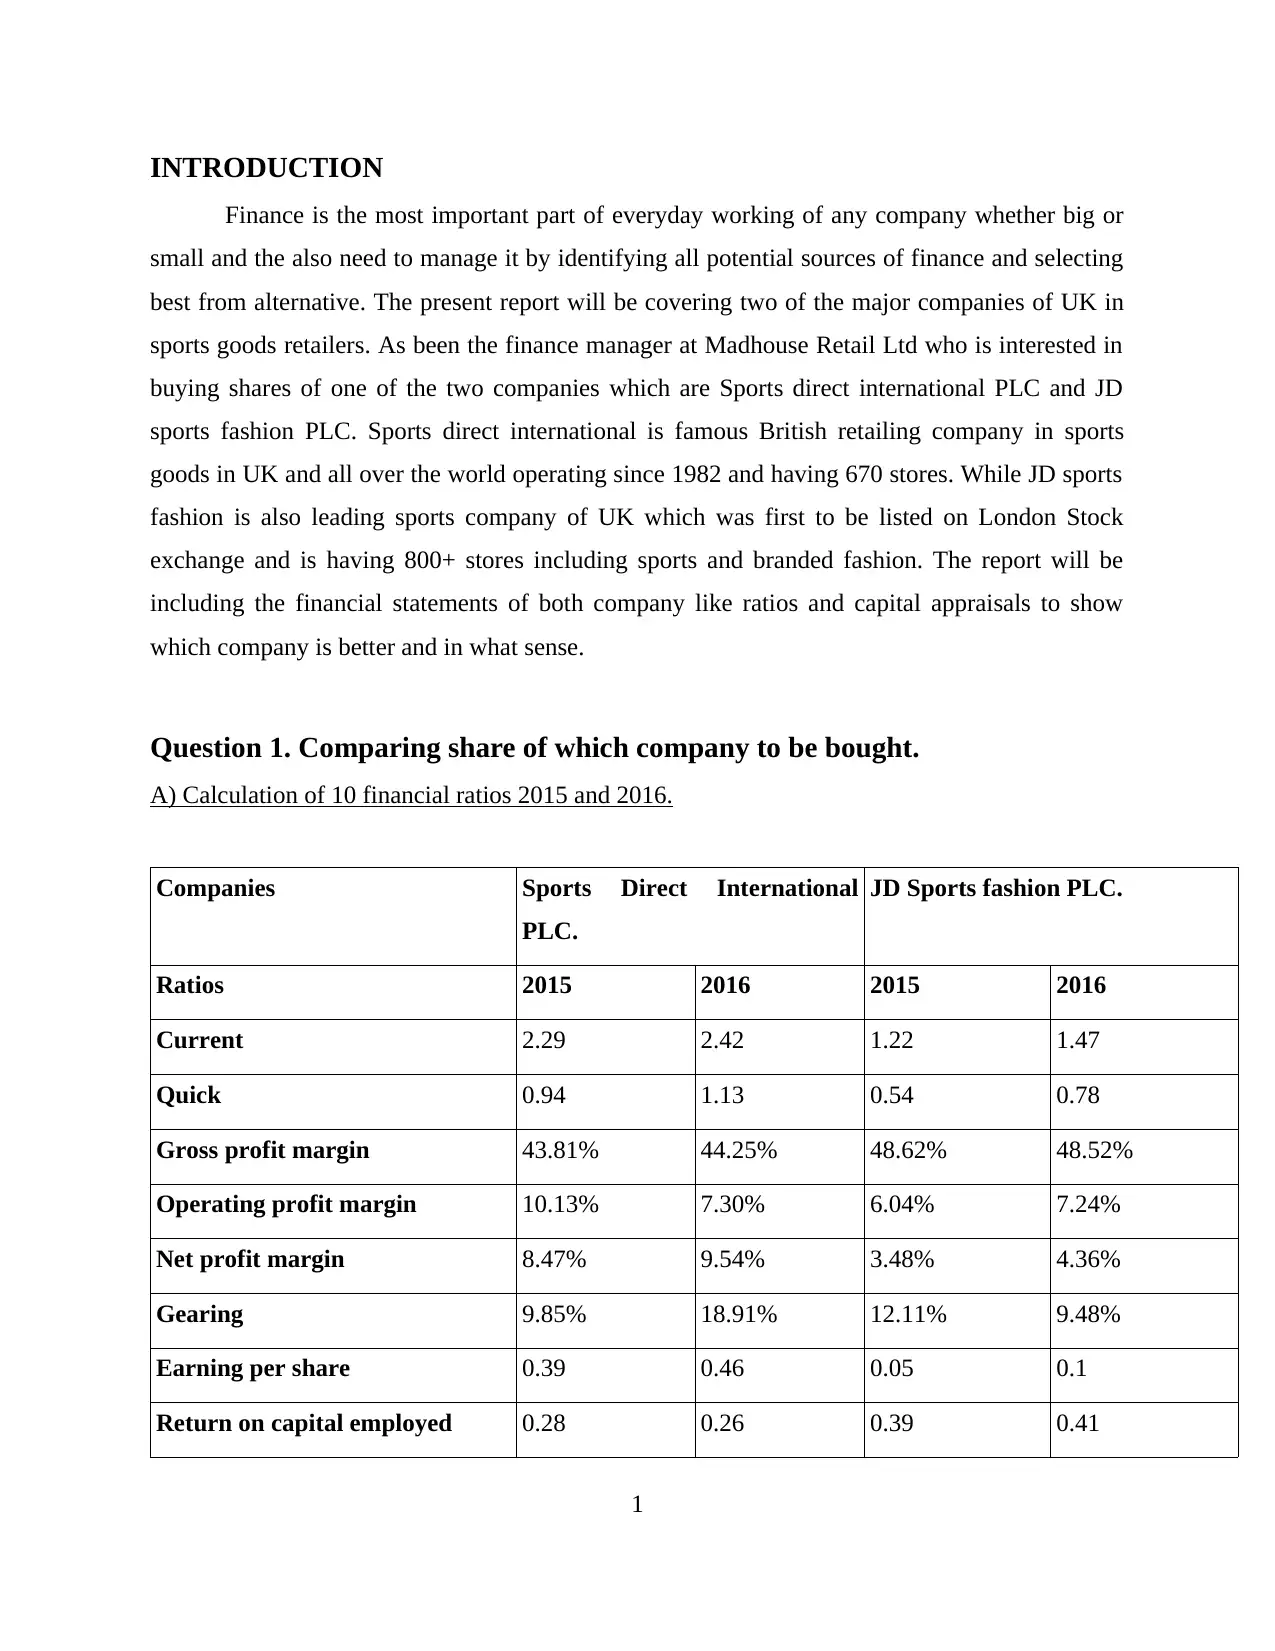
Current 2.29 2.42 1.22 1.47
Quick 0.94 1.13 0.54 0.78
Gross profit margin 43.81% 44.25% 48.62% 48.52%
Operating profit margin 10.13% 7.30% 6.04% 7.24%
Net profit margin 8.47% 9.54% 3.48% 4.36%
Gearing 9.85% 18.91% 12.11% 9.48%
Earning per share 0.39 0.46 0.05 0.1
Return on capital employed 0.28 0.26 0.39 0.41
1
Finance is the most important part of everyday working of any company whether big or
small and the also need to manage it by identifying all potential sources of finance and selecting
best from alternative. The present report will be covering two of the major companies of UK in
sports goods retailers. As been the finance manager at Madhouse Retail Ltd who is interested in
buying shares of one of the two companies which are Sports direct international PLC and JD
sports fashion PLC. Sports direct international is famous British retailing company in sports
goods in UK and all over the world operating since 1982 and having 670 stores. While JD sports
fashion is also leading sports company of UK which was first to be listed on London Stock
exchange and is having 800+ stores including sports and branded fashion. The report will be
including the financial statements of both company like ratios and capital appraisals to show
which company is better and in what sense.
Question 1. Comparing share of which company to be bought.
A) Calculation of 10 financial ratios 2015 and 2016.
Companies Sports Direct International
PLC.
JD Sports fashion PLC.
Ratios 2015 2016 2015 2016
Current 2.29 2.42 1.22 1.47
Quick 0.94 1.13 0.54 0.78
Gross profit margin 43.81% 44.25% 48.62% 48.52%
Operating profit margin 10.13% 7.30% 6.04% 7.24%
Net profit margin 8.47% 9.54% 3.48% 4.36%
Gearing 9.85% 18.91% 12.11% 9.48%
Earning per share 0.39 0.46 0.05 0.1
Return on capital employed 0.28 0.26 0.39 0.41
1
⊘ This is a preview!⊘
Do you want full access?
Subscribe today to unlock all pages.
Trusted by 1+ million students worldwide
Average inventories turnover
period
1.93 1.87 2.62 2.72
Dividend payout 0 0 0.19 0.1
B) Analysing the performance of both the companies for 2 years.
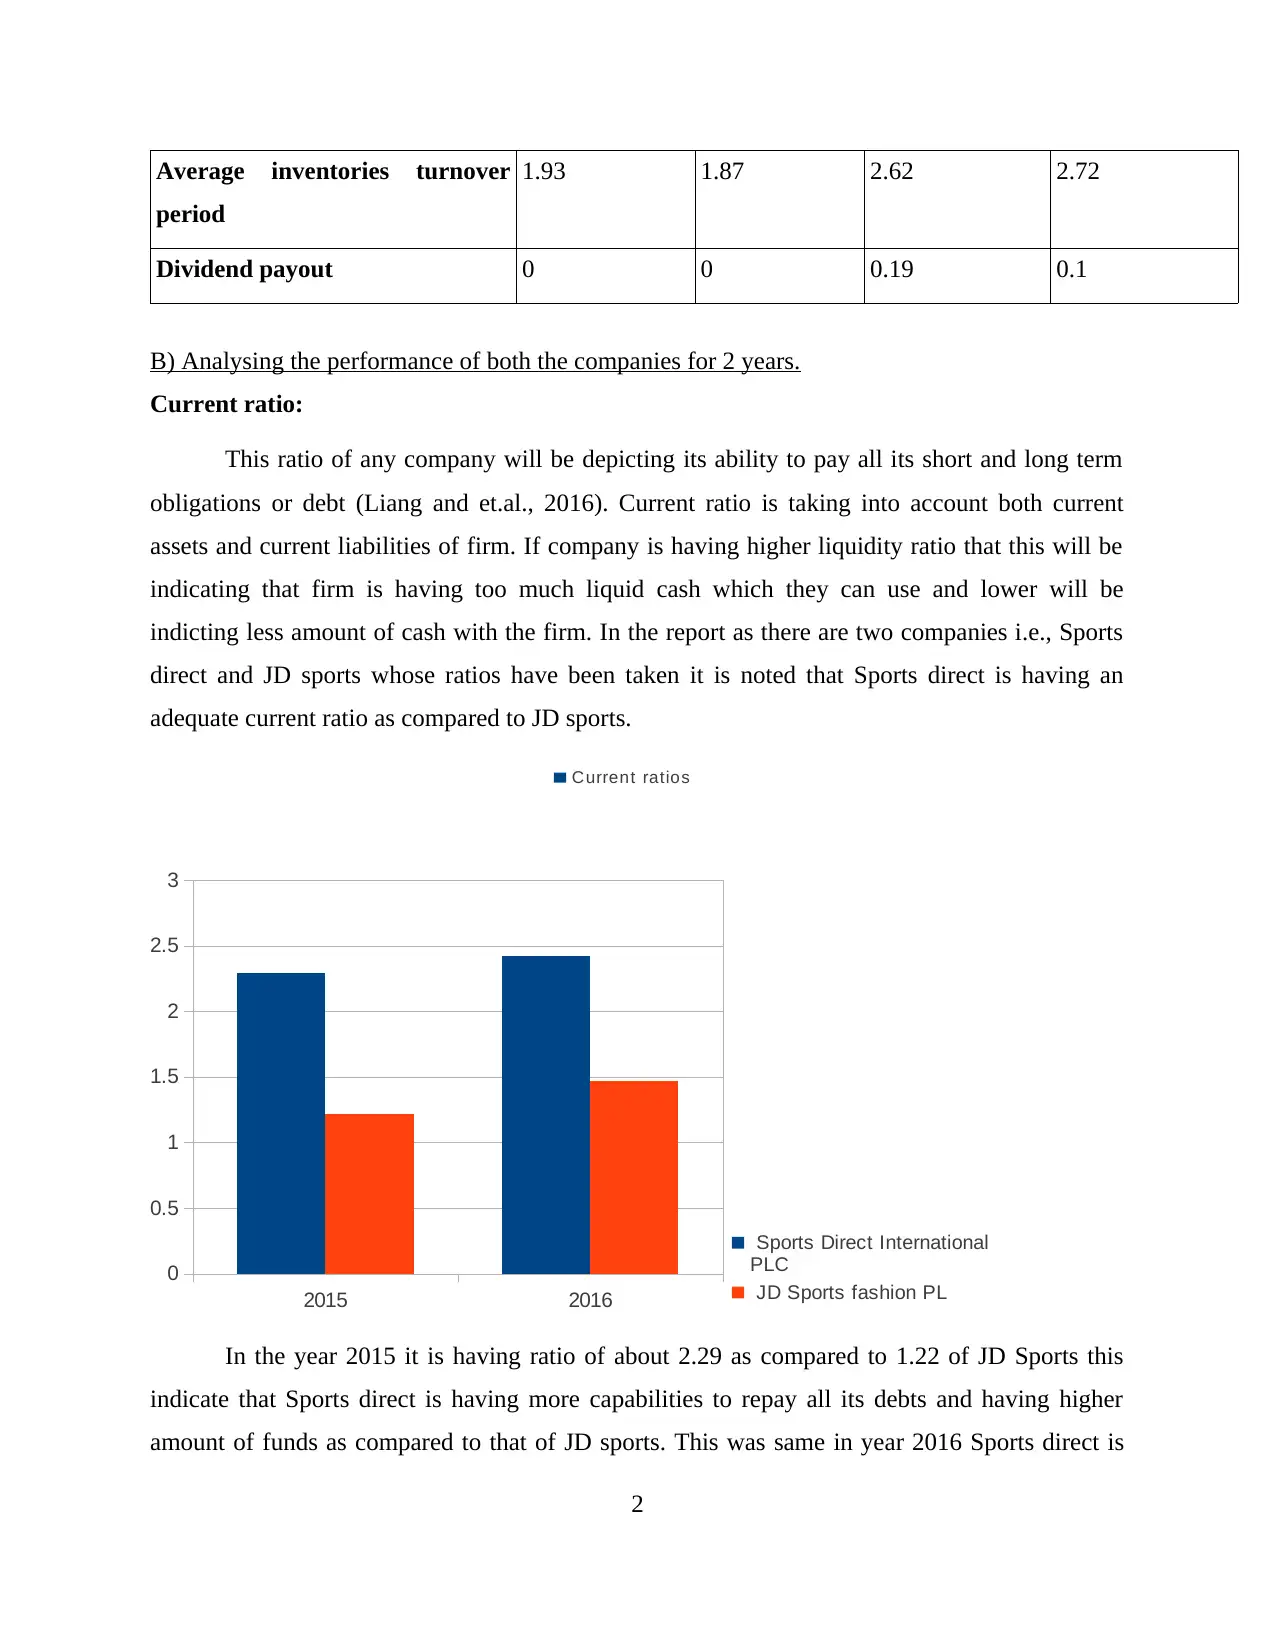
Current ratio:
This ratio of any company will be depicting its ability to pay all its short and long term
obligations or debt (Liang and et.al., 2016). Current ratio is taking into account both current
assets and current liabilities of firm. If company is having higher liquidity ratio that this will be
indicating that firm is having too much liquid cash which they can use and lower will be
indicting less amount of cash with the firm. In the report as there are two companies i.e., Sports
direct and JD sports whose ratios have been taken it is noted that Sports direct is having an
adequate current ratio as compared to JD sports.
2015 2016
0
0.5
1
1.5
2
2.5
3
Sports Direct International
PLC
JD Sports fashion PL
In the year 2015 it is having ratio of about 2.29 as compared to 1.22 of JD Sports this
indicate that Sports direct is having more capabilities to repay all its debts and having higher
amount of funds as compared to that of JD sports. This was same in year 2016 Sports direct is
2
Current ratios
period
1.93 1.87 2.62 2.72
Dividend payout 0 0 0.19 0.1
B) Analysing the performance of both the companies for 2 years.
Current ratio:
This ratio of any company will be depicting its ability to pay all its short and long term
obligations or debt (Liang and et.al., 2016). Current ratio is taking into account both current
assets and current liabilities of firm. If company is having higher liquidity ratio that this will be
indicating that firm is having too much liquid cash which they can use and lower will be
indicting less amount of cash with the firm. In the report as there are two companies i.e., Sports
direct and JD sports whose ratios have been taken it is noted that Sports direct is having an
adequate current ratio as compared to JD sports.
2015 2016
0
0.5
1
1.5
2
2.5
3
Sports Direct International
PLC
JD Sports fashion PL
In the year 2015 it is having ratio of about 2.29 as compared to 1.22 of JD Sports this
indicate that Sports direct is having more capabilities to repay all its debts and having higher
amount of funds as compared to that of JD sports. This was same in year 2016 Sports direct is
2
Current ratios
Paraphrase This Document
Need a fresh take? Get an instant paraphrase of this document with our AI Paraphraser
having 2.42 while JD sports is having 1.47 which is again higher. This shows that JD sports
should be making more improvements in their activities so that it can get higher current ratio.
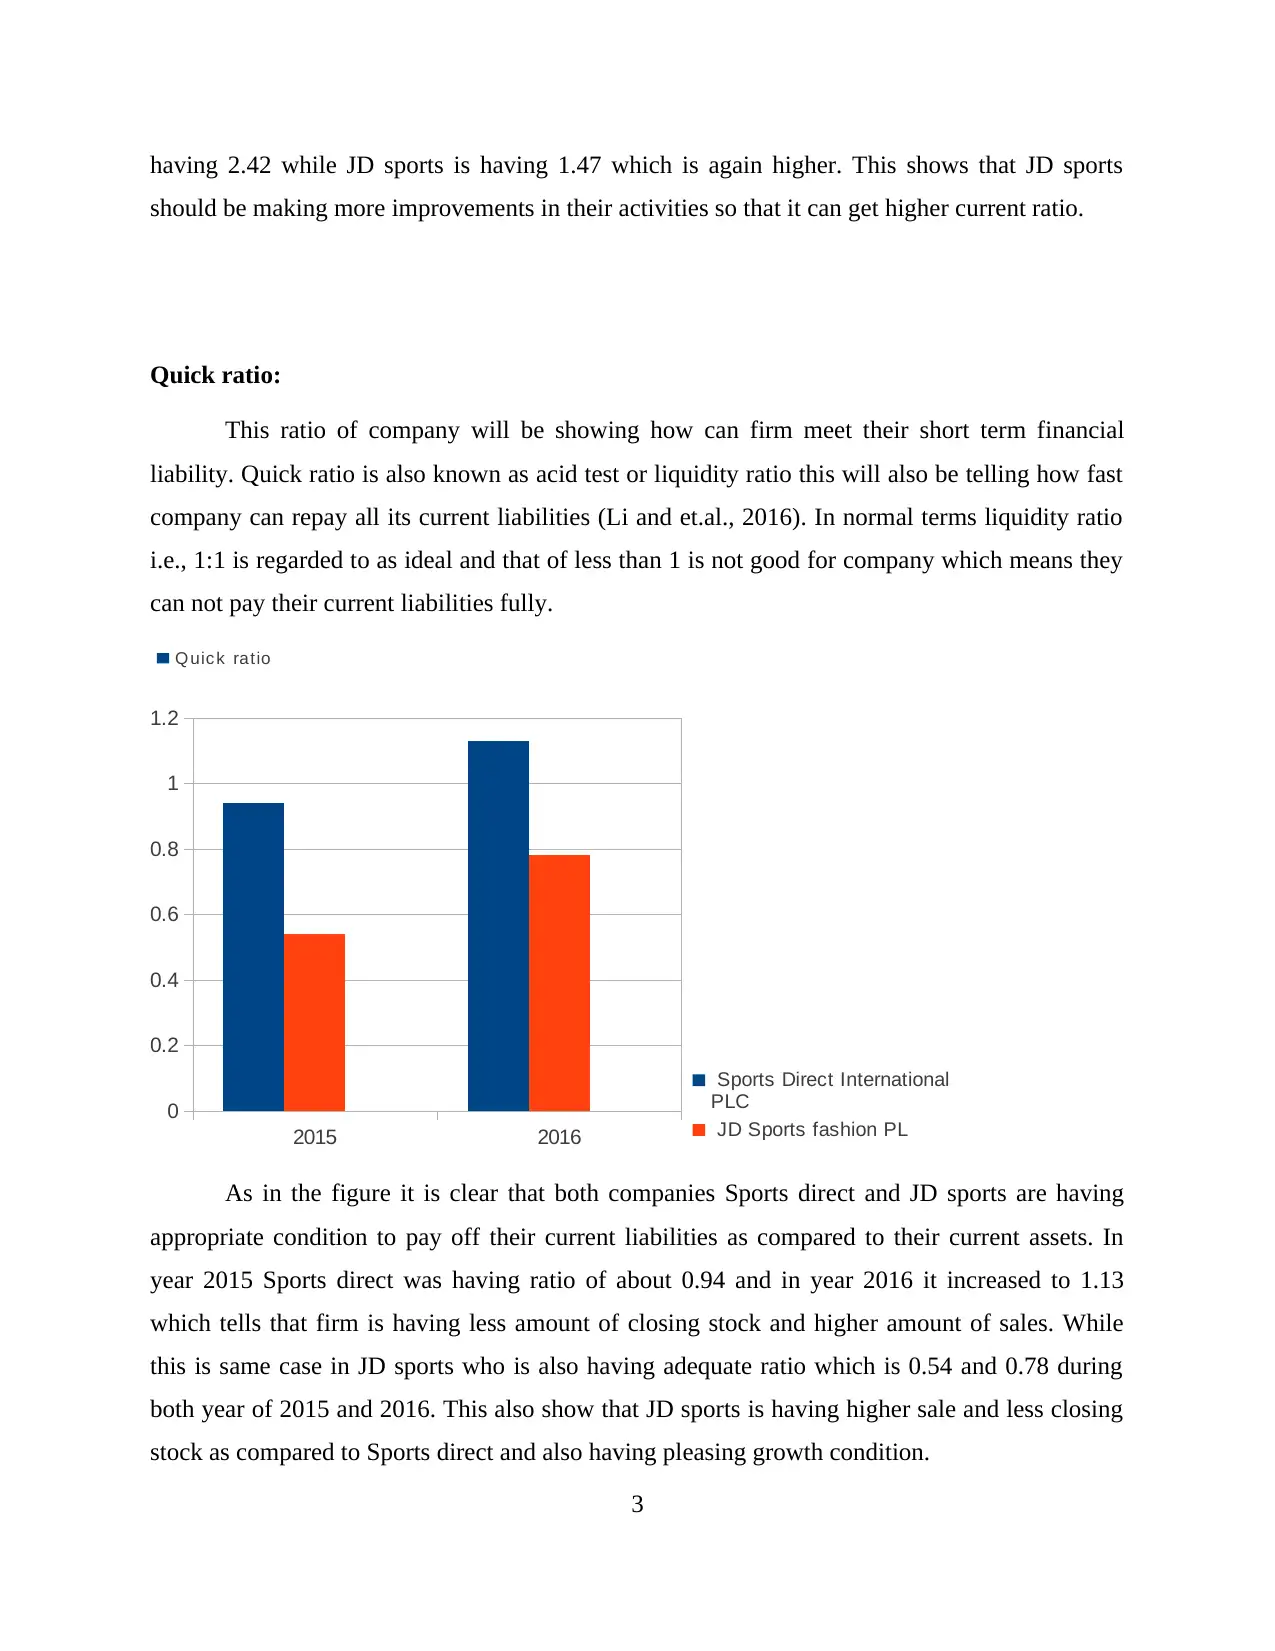
Quick ratio:
This ratio of company will be showing how can firm meet their short term financial
liability. Quick ratio is also known as acid test or liquidity ratio this will also be telling how fast
company can repay all its current liabilities (Li and et.al., 2016). In normal terms liquidity ratio
i.e., 1:1 is regarded to as ideal and that of less than 1 is not good for company which means they
can not pay their current liabilities fully.
Q uic k ratio
2015 2016
0
0.2
0.4
0.6
0.8
1
1.2
Sports Direct International
PLC
JD Sports fashion PL
As in the figure it is clear that both companies Sports direct and JD sports are having
appropriate condition to pay off their current liabilities as compared to their current assets. In
year 2015 Sports direct was having ratio of about 0.94 and in year 2016 it increased to 1.13
which tells that firm is having less amount of closing stock and higher amount of sales. While
this is same case in JD sports who is also having adequate ratio which is 0.54 and 0.78 during
both year of 2015 and 2016. This also show that JD sports is having higher sale and less closing
stock as compared to Sports direct and also having pleasing growth condition.
3
should be making more improvements in their activities so that it can get higher current ratio.
Quick ratio:
This ratio of company will be showing how can firm meet their short term financial
liability. Quick ratio is also known as acid test or liquidity ratio this will also be telling how fast
company can repay all its current liabilities (Li and et.al., 2016). In normal terms liquidity ratio
i.e., 1:1 is regarded to as ideal and that of less than 1 is not good for company which means they
can not pay their current liabilities fully.
Q uic k ratio
2015 2016
0
0.2
0.4
0.6
0.8
1
1.2
Sports Direct International
PLC
JD Sports fashion PL
As in the figure it is clear that both companies Sports direct and JD sports are having
appropriate condition to pay off their current liabilities as compared to their current assets. In
year 2015 Sports direct was having ratio of about 0.94 and in year 2016 it increased to 1.13
which tells that firm is having less amount of closing stock and higher amount of sales. While
this is same case in JD sports who is also having adequate ratio which is 0.54 and 0.78 during
both year of 2015 and 2016. This also show that JD sports is having higher sale and less closing
stock as compared to Sports direct and also having pleasing growth condition.
3
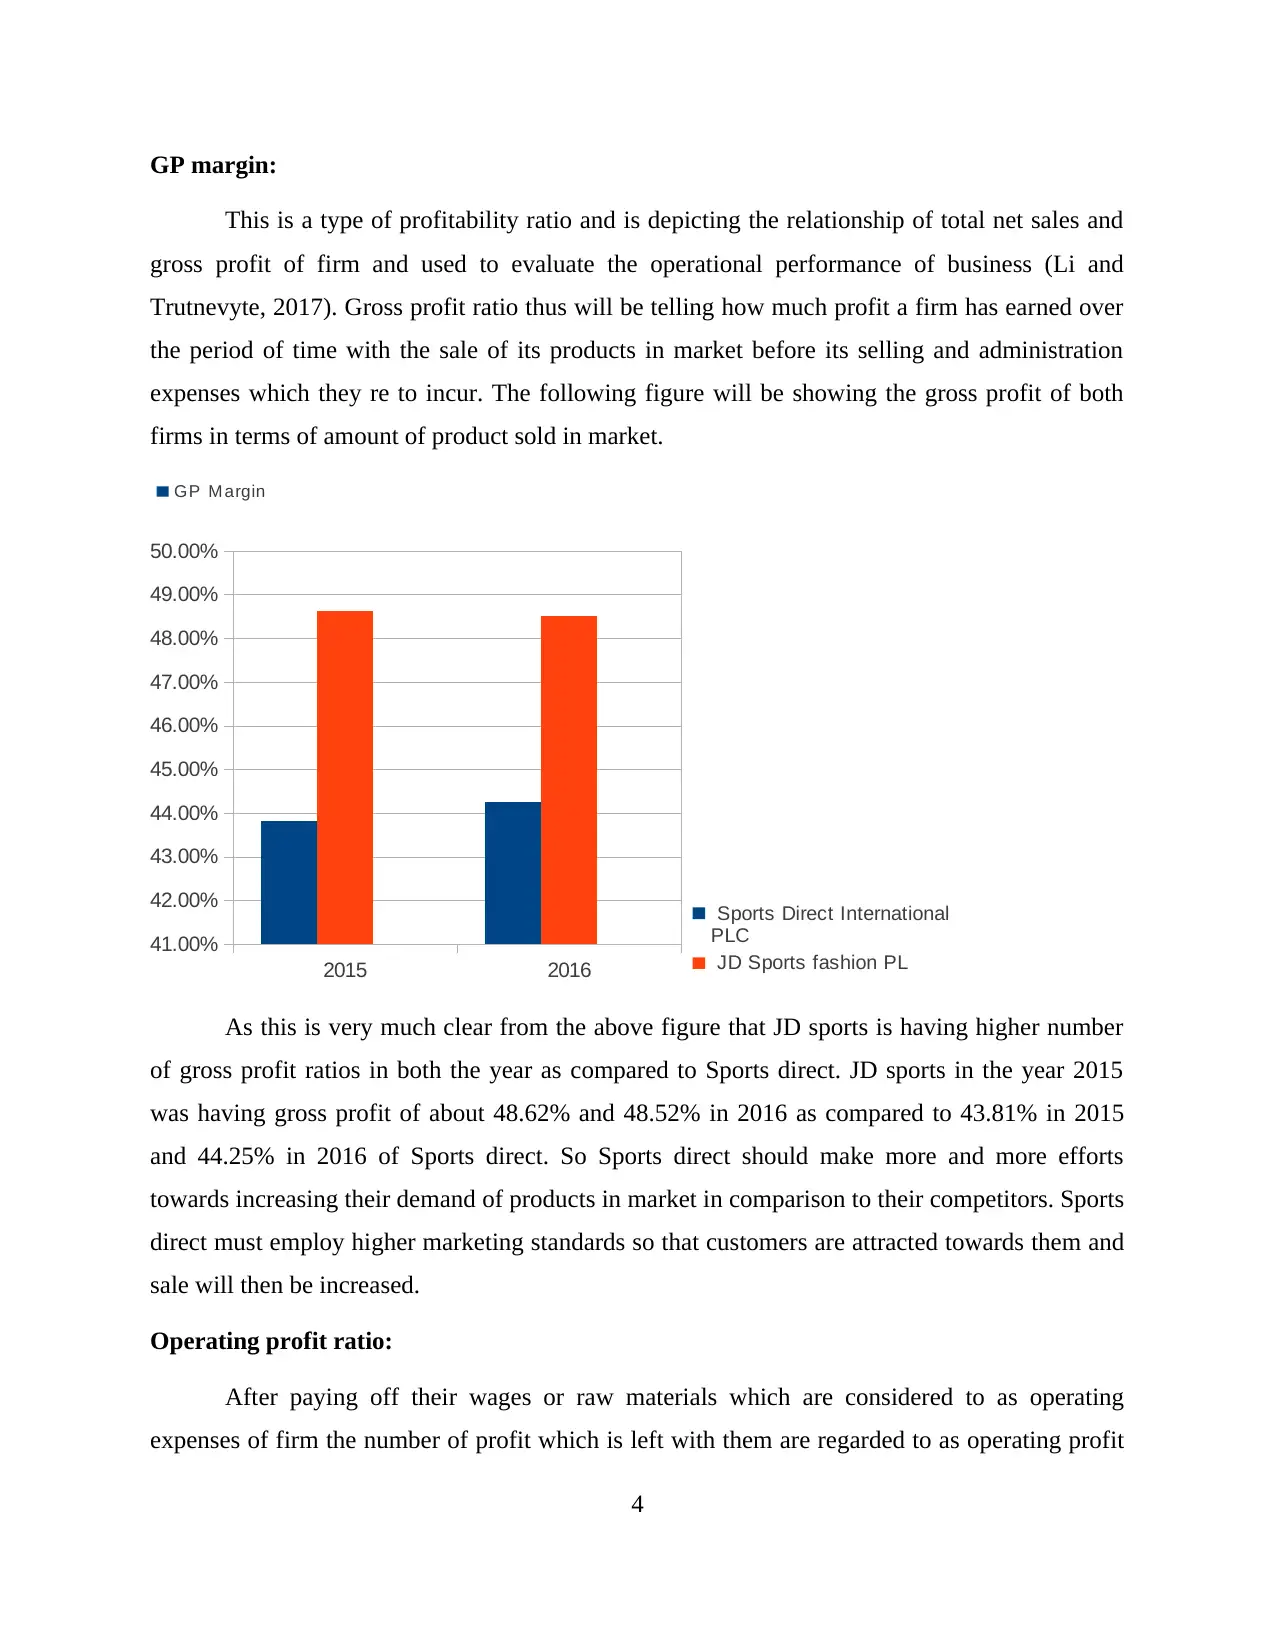
GP margin:
This is a type of profitability ratio and is depicting the relationship of total net sales and
gross profit of firm and used to evaluate the operational performance of business (Li and
Trutnevyte, 2017). Gross profit ratio thus will be telling how much profit a firm has earned over
the period of time with the sale of its products in market before its selling and administration
expenses which they re to incur. The following figure will be showing the gross profit of both
firms in terms of amount of product sold in market.
GP M argin
2015 2016
41.00%
42.00%
43.00%
44.00%
45.00%
46.00%
47.00%
48.00%
49.00%
50.00%
Sports Direct International
PLC
JD Sports fashion PL
As this is very much clear from the above figure that JD sports is having higher number
of gross profit ratios in both the year as compared to Sports direct. JD sports in the year 2015
was having gross profit of about 48.62% and 48.52% in 2016 as compared to 43.81% in 2015
and 44.25% in 2016 of Sports direct. So Sports direct should make more and more efforts
towards increasing their demand of products in market in comparison to their competitors. Sports
direct must employ higher marketing standards so that customers are attracted towards them and
sale will then be increased.
Operating profit ratio:
After paying off their wages or raw materials which are considered to as operating
expenses of firm the number of profit which is left with them are regarded to as operating profit
4
⊘ This is a preview!⊘
Do you want full access?
Subscribe today to unlock all pages.
Trusted by 1+ million students worldwide
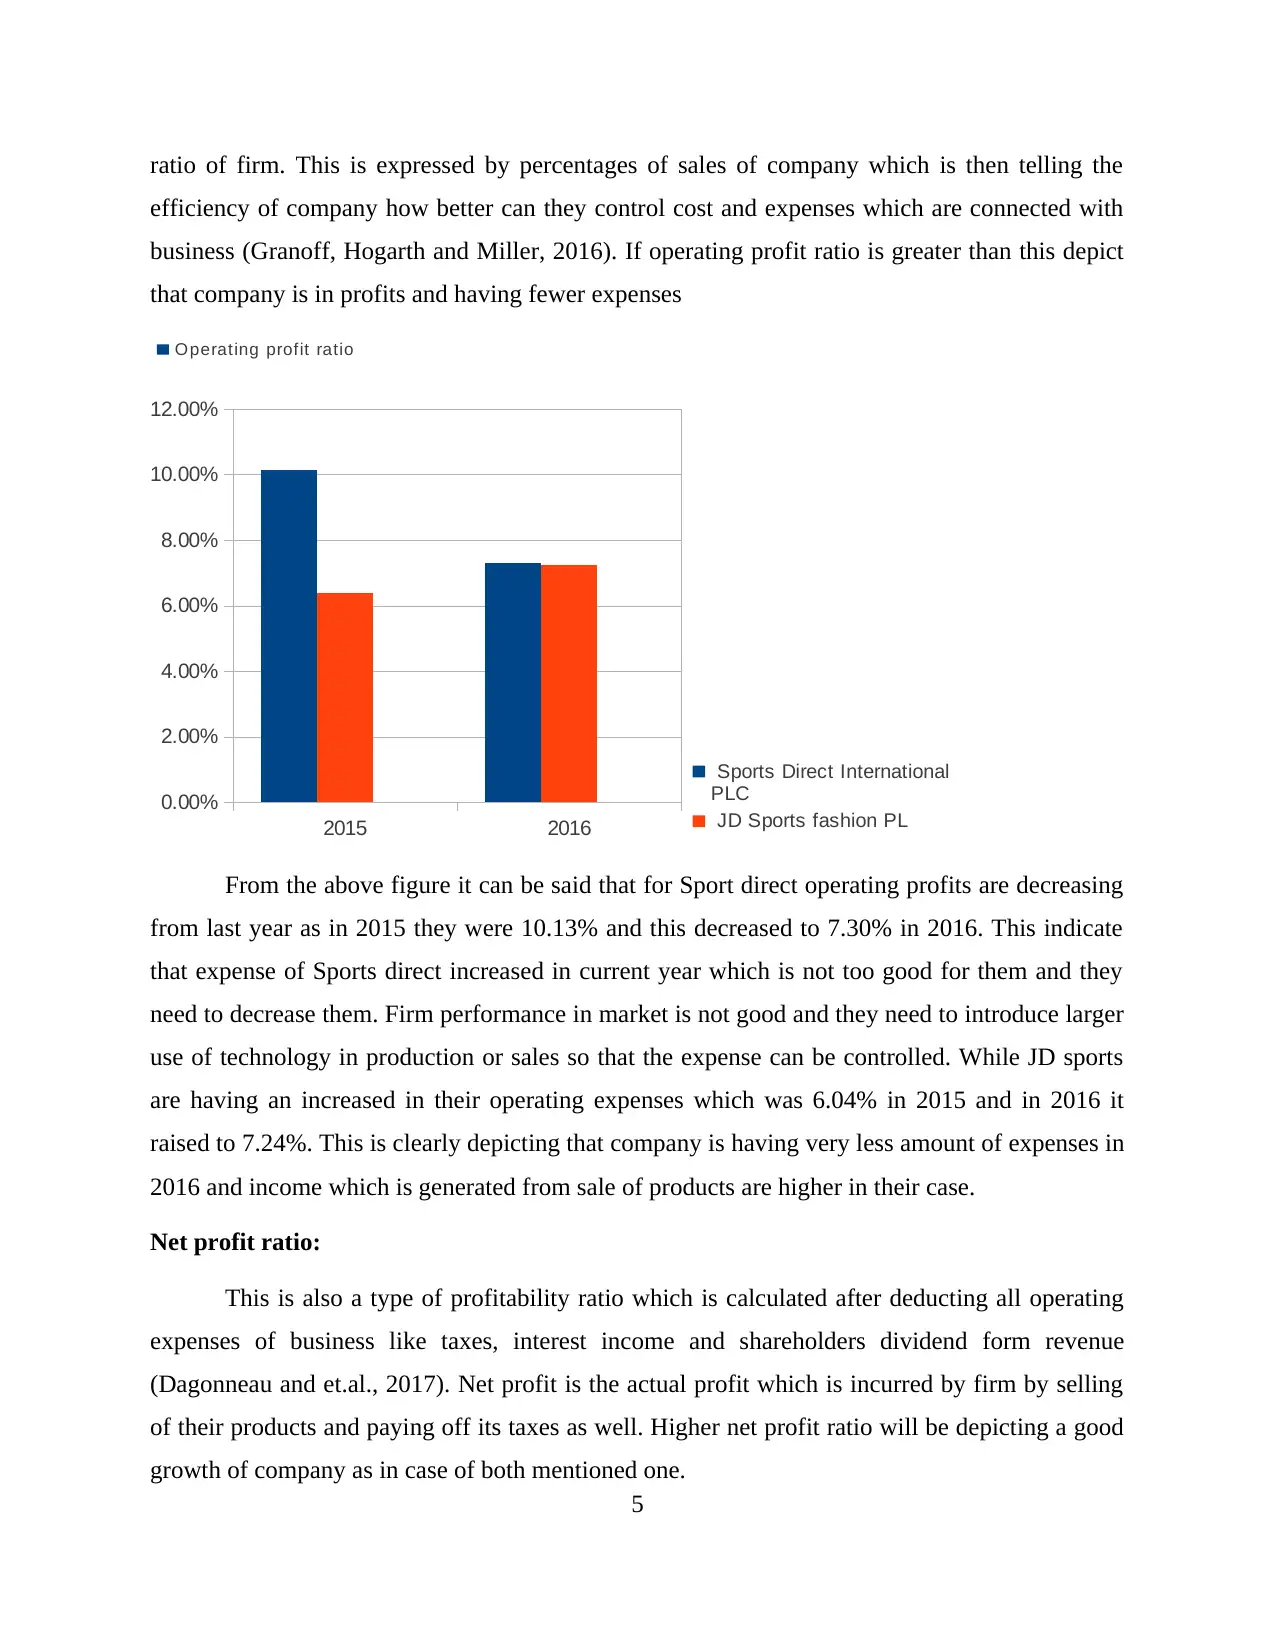
ratio of firm. This is expressed by percentages of sales of company which is then telling the
efficiency of company how better can they control cost and expenses which are connected with
business (Granoff, Hogarth and Miller, 2016). If operating profit ratio is greater than this depict
that company is in profits and having fewer expenses
O perating profit ratio
2015 2016
0.00%
2.00%
4.00%
6.00%
8.00%
10.00%
12.00%
Sports Direct International
PLC
JD Sports fashion PL
From the above figure it can be said that for Sport direct operating profits are decreasing
from last year as in 2015 they were 10.13% and this decreased to 7.30% in 2016. This indicate
that expense of Sports direct increased in current year which is not too good for them and they
need to decrease them. Firm performance in market is not good and they need to introduce larger
use of technology in production or sales so that the expense can be controlled. While JD sports
are having an increased in their operating expenses which was 6.04% in 2015 and in 2016 it
raised to 7.24%. This is clearly depicting that company is having very less amount of expenses in
2016 and income which is generated from sale of products are higher in their case.
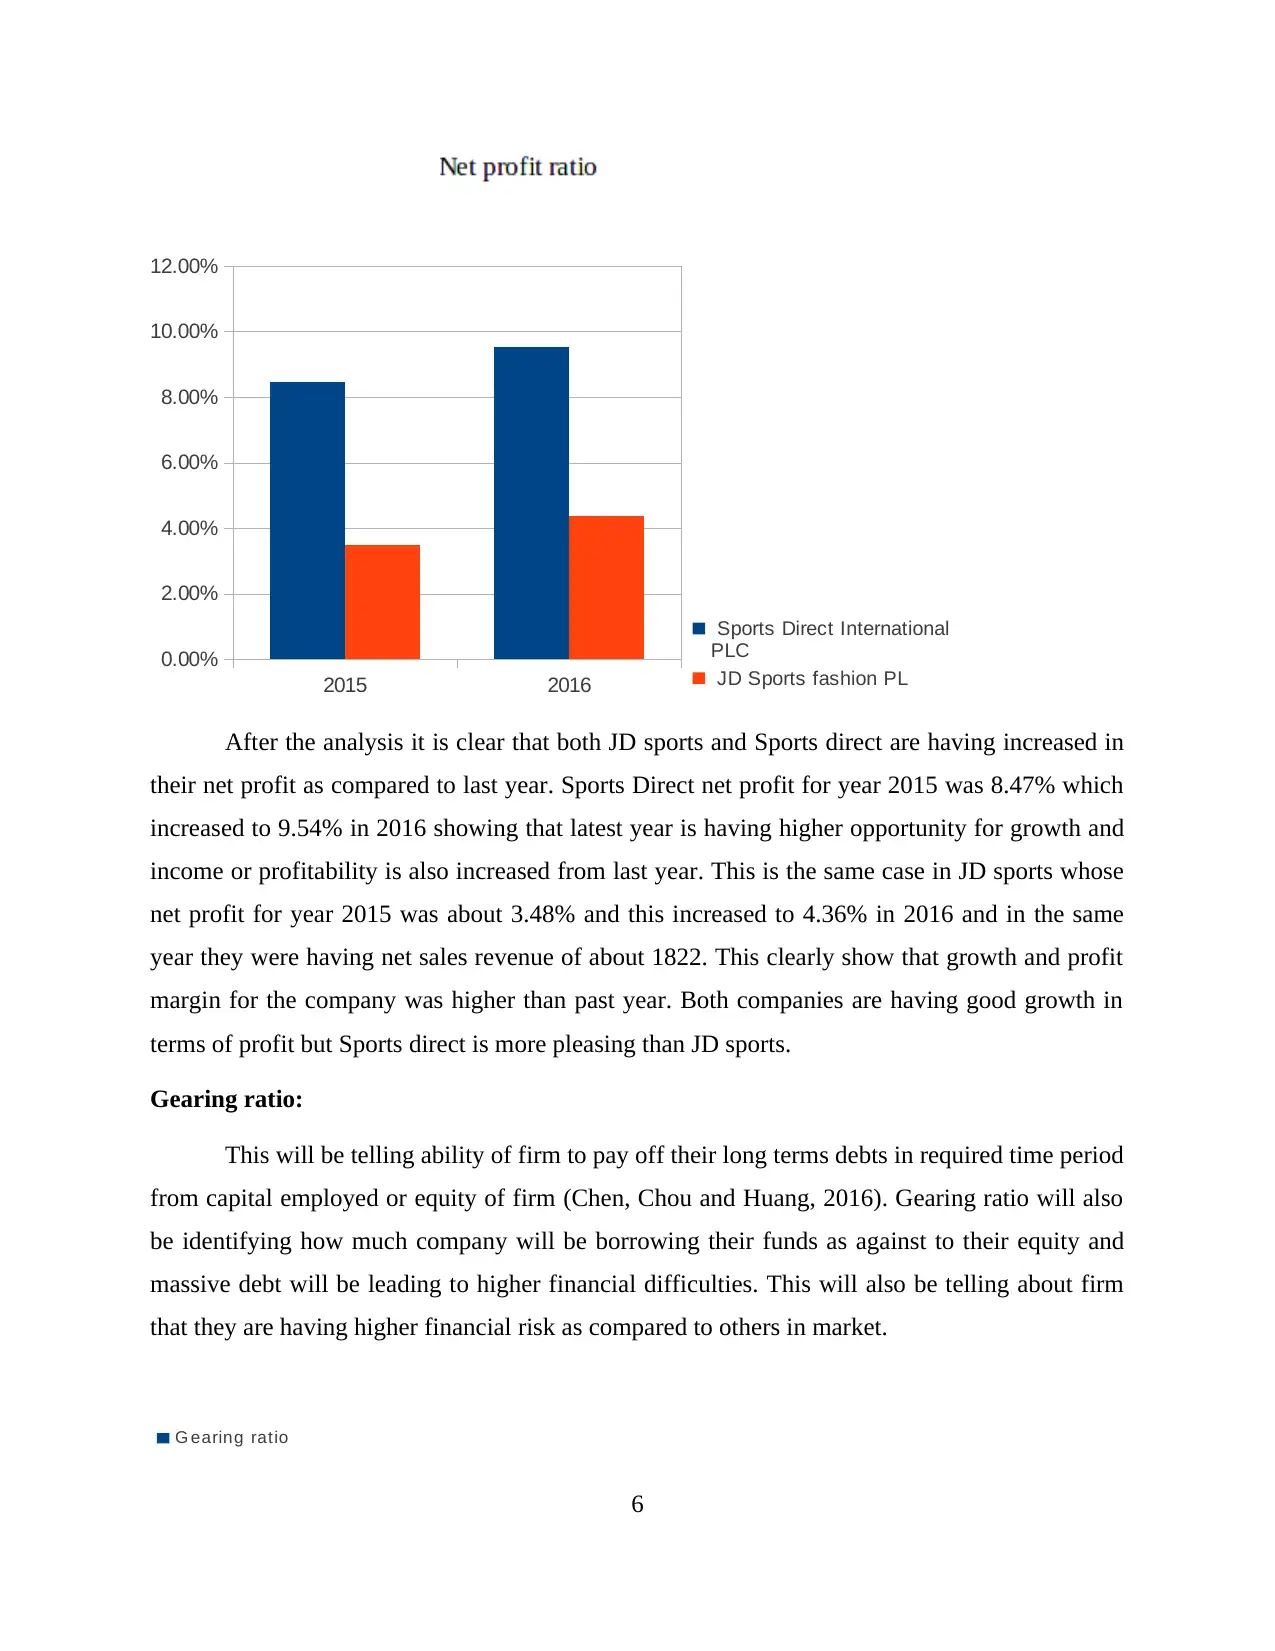
Net profit ratio:
This is also a type of profitability ratio which is calculated after deducting all operating
expenses of business like taxes, interest income and shareholders dividend form revenue
(Dagonneau and et.al., 2017). Net profit is the actual profit which is incurred by firm by selling
of their products and paying off its taxes as well. Higher net profit ratio will be depicting a good
growth of company as in case of both mentioned one.
5
efficiency of company how better can they control cost and expenses which are connected with
business (Granoff, Hogarth and Miller, 2016). If operating profit ratio is greater than this depict
that company is in profits and having fewer expenses
O perating profit ratio
2015 2016
0.00%
2.00%
4.00%
6.00%
8.00%
10.00%
12.00%
Sports Direct International
PLC
JD Sports fashion PL
From the above figure it can be said that for Sport direct operating profits are decreasing
from last year as in 2015 they were 10.13% and this decreased to 7.30% in 2016. This indicate
that expense of Sports direct increased in current year which is not too good for them and they
need to decrease them. Firm performance in market is not good and they need to introduce larger
use of technology in production or sales so that the expense can be controlled. While JD sports
are having an increased in their operating expenses which was 6.04% in 2015 and in 2016 it
raised to 7.24%. This is clearly depicting that company is having very less amount of expenses in
2016 and income which is generated from sale of products are higher in their case.
Net profit ratio:
This is also a type of profitability ratio which is calculated after deducting all operating
expenses of business like taxes, interest income and shareholders dividend form revenue
(Dagonneau and et.al., 2017). Net profit is the actual profit which is incurred by firm by selling
of their products and paying off its taxes as well. Higher net profit ratio will be depicting a good
growth of company as in case of both mentioned one.
5
Paraphrase This Document
Need a fresh take? Get an instant paraphrase of this document with our AI Paraphraser
2015 2016
0.00%
2.00%
4.00%
6.00%
8.00%
10.00%
12.00%
Sports Direct International
PLC
JD Sports fashion PL
After the analysis it is clear that both JD sports and Sports direct are having increased in
their net profit as compared to last year. Sports Direct net profit for year 2015 was 8.47% which
increased to 9.54% in 2016 showing that latest year is having higher opportunity for growth and
income or profitability is also increased from last year. This is the same case in JD sports whose
net profit for year 2015 was about 3.48% and this increased to 4.36% in 2016 and in the same
year they were having net sales revenue of about 1822. This clearly show that growth and profit
margin for the company was higher than past year. Both companies are having good growth in
terms of profit but Sports direct is more pleasing than JD sports.
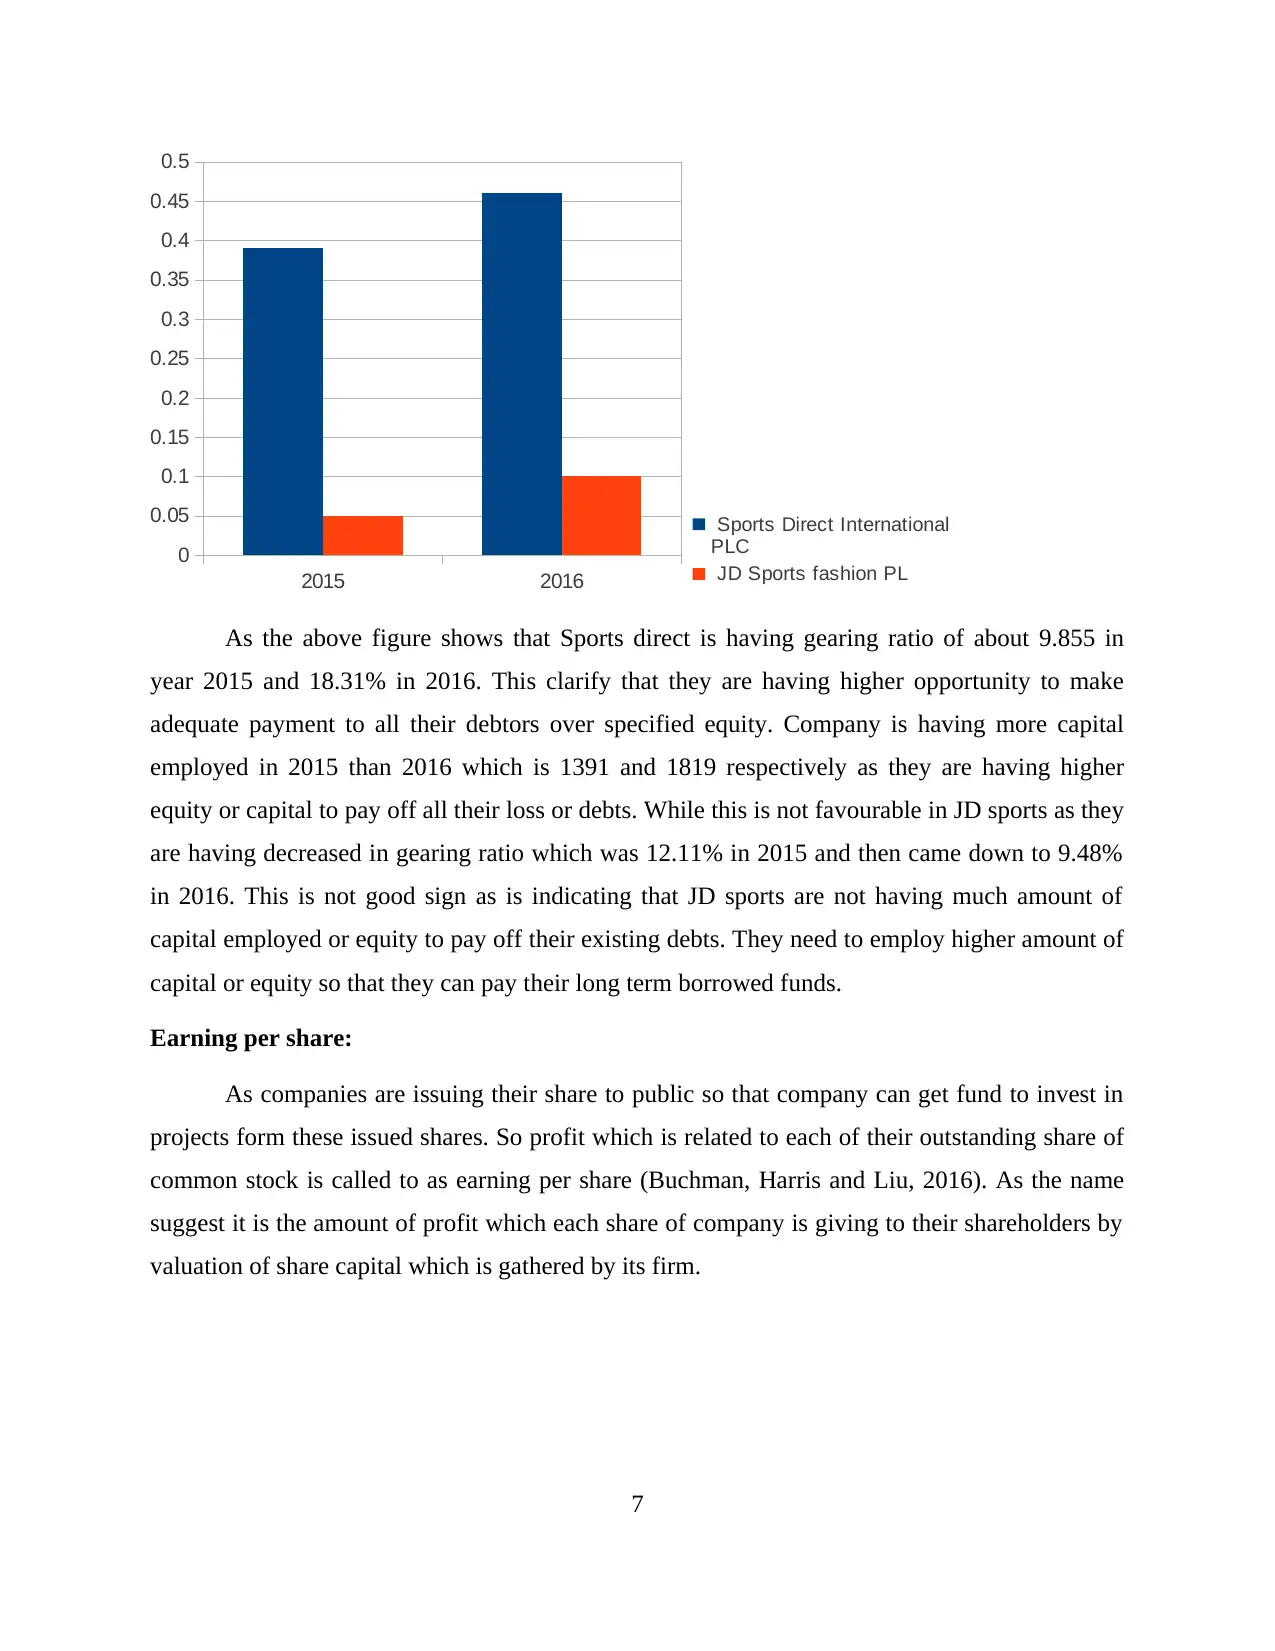
Gearing ratio:
This will be telling ability of firm to pay off their long terms debts in required time period
from capital employed or equity of firm (Chen, Chou and Huang, 2016). Gearing ratio will also
be identifying how much company will be borrowing their funds as against to their equity and
massive debt will be leading to higher financial difficulties. This will also be telling about firm
that they are having higher financial risk as compared to others in market.
G earing ratio
6
0.00%
2.00%
4.00%
6.00%
8.00%
10.00%
12.00%
Sports Direct International
PLC
JD Sports fashion PL
After the analysis it is clear that both JD sports and Sports direct are having increased in
their net profit as compared to last year. Sports Direct net profit for year 2015 was 8.47% which
increased to 9.54% in 2016 showing that latest year is having higher opportunity for growth and
income or profitability is also increased from last year. This is the same case in JD sports whose
net profit for year 2015 was about 3.48% and this increased to 4.36% in 2016 and in the same
year they were having net sales revenue of about 1822. This clearly show that growth and profit
margin for the company was higher than past year. Both companies are having good growth in
terms of profit but Sports direct is more pleasing than JD sports.
Gearing ratio:
This will be telling ability of firm to pay off their long terms debts in required time period
from capital employed or equity of firm (Chen, Chou and Huang, 2016). Gearing ratio will also
be identifying how much company will be borrowing their funds as against to their equity and
massive debt will be leading to higher financial difficulties. This will also be telling about firm
that they are having higher financial risk as compared to others in market.
G earing ratio
6
2015 2016
0
0.05
0.1
0.15
0.2
0.25
0.3
0.35
0.4
0.45
0.5
Sports Direct International
PLC
JD Sports fashion PL
As the above figure shows that Sports direct is having gearing ratio of about 9.855 in
year 2015 and 18.31% in 2016. This clarify that they are having higher opportunity to make
adequate payment to all their debtors over specified equity. Company is having more capital
employed in 2015 than 2016 which is 1391 and 1819 respectively as they are having higher
equity or capital to pay off all their loss or debts. While this is not favourable in JD sports as they
are having decreased in gearing ratio which was 12.11% in 2015 and then came down to 9.48%
in 2016. This is not good sign as is indicating that JD sports are not having much amount of
capital employed or equity to pay off their existing debts. They need to employ higher amount of
capital or equity so that they can pay their long term borrowed funds.
Earning per share:
As companies are issuing their share to public so that company can get fund to invest in
projects form these issued shares. So profit which is related to each of their outstanding share of
common stock is called to as earning per share (Buchman, Harris and Liu, 2016). As the name
suggest it is the amount of profit which each share of company is giving to their shareholders by
valuation of share capital which is gathered by its firm.
7
⊘ This is a preview!⊘
Do you want full access?
Subscribe today to unlock all pages.
Trusted by 1+ million students worldwide
2015 2016
0
0.05
0.1
0.15
0.2
0.25
0.3
0.35
0.4
0.45
0.5
E arning per s hare
Sports Direct International
PLC
JD Sports fashion PL
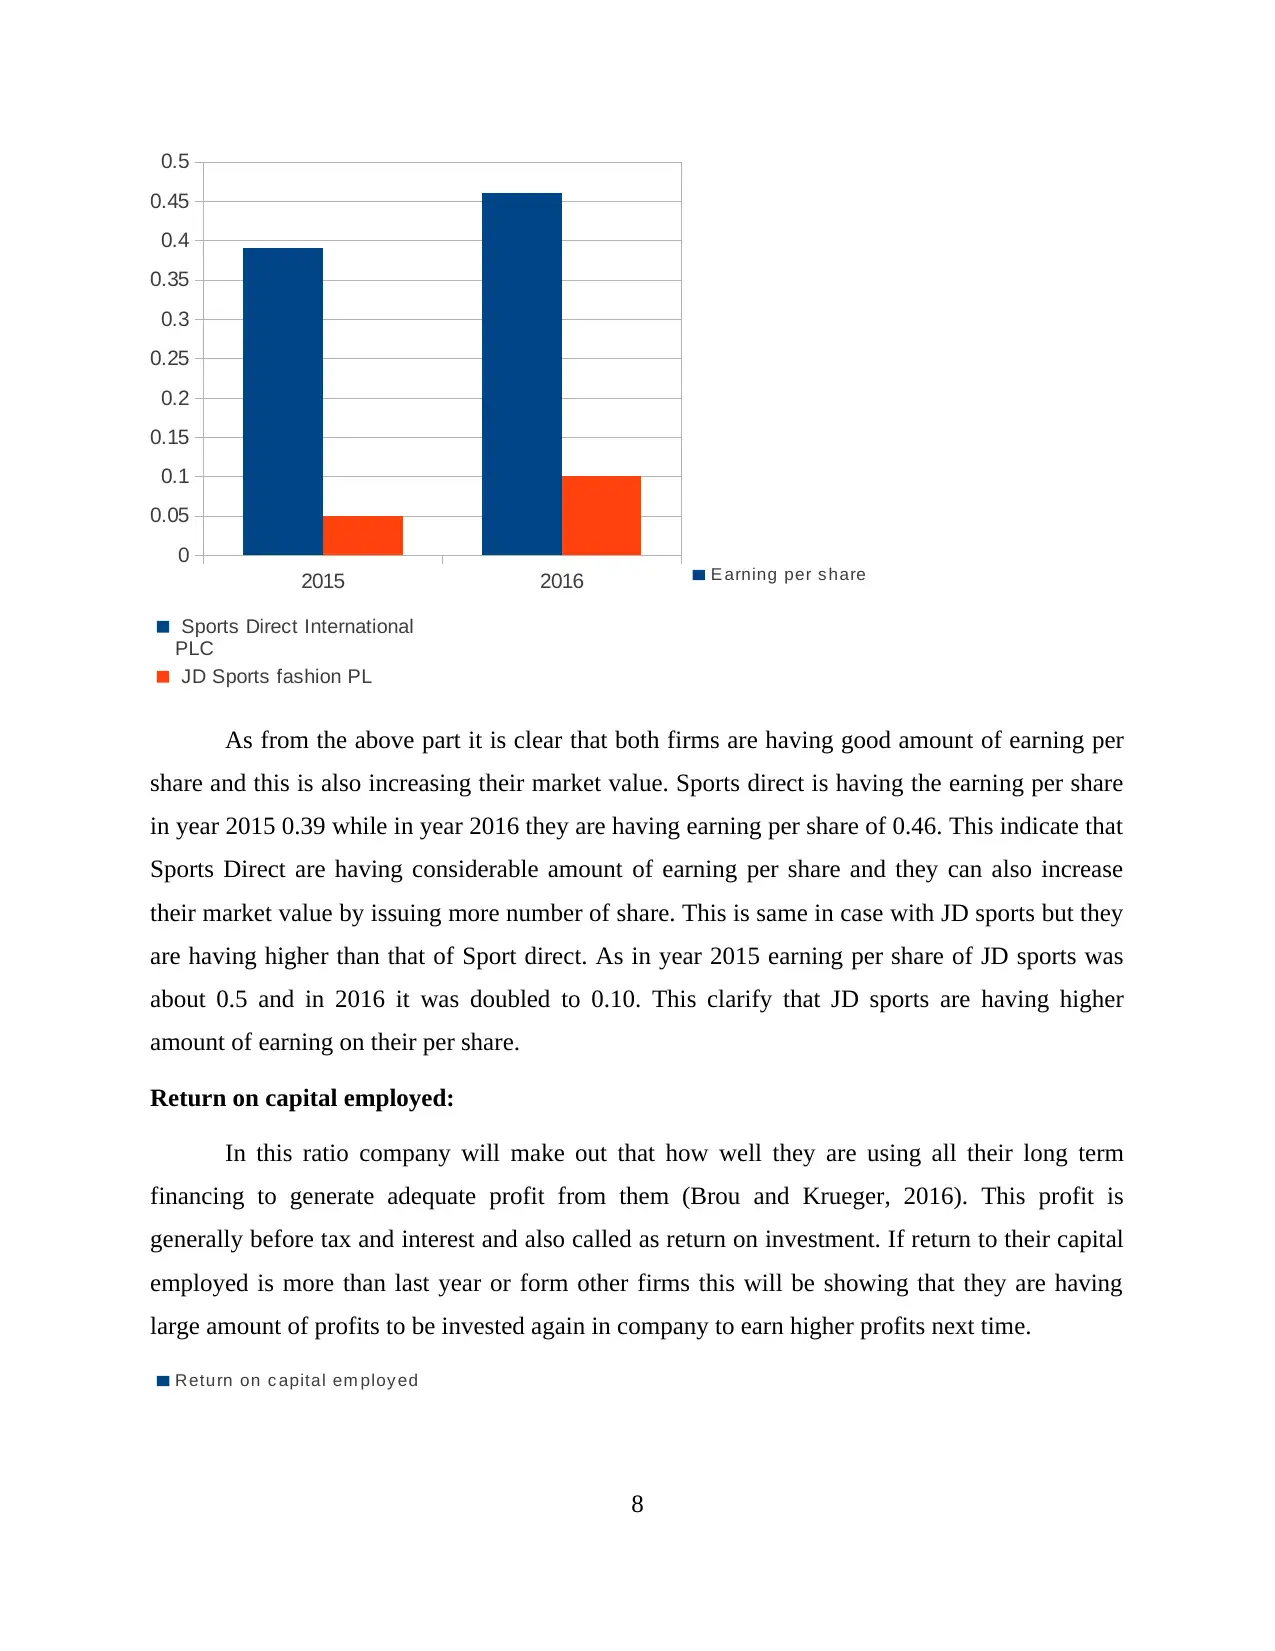
As from the above part it is clear that both firms are having good amount of earning per
share and this is also increasing their market value. Sports direct is having the earning per share
in year 2015 0.39 while in year 2016 they are having earning per share of 0.46. This indicate that
Sports Direct are having considerable amount of earning per share and they can also increase
their market value by issuing more number of share. This is same in case with JD sports but they
are having higher than that of Sport direct. As in year 2015 earning per share of JD sports was
about 0.5 and in 2016 it was doubled to 0.10. This clarify that JD sports are having higher
amount of earning on their per share.
Return on capital employed:
In this ratio company will make out that how well they are using all their long term
financing to generate adequate profit from them (Brou and Krueger, 2016). This profit is
generally before tax and interest and also called as return on investment. If return to their capital
employed is more than last year or form other firms this will be showing that they are having
large amount of profits to be invested again in company to earn higher profits next time.
Return on c apital em ploy ed
8
0
0.05
0.1
0.15
0.2
0.25
0.3
0.35
0.4
0.45
0.5
E arning per s hare
Sports Direct International
PLC
JD Sports fashion PL
As from the above part it is clear that both firms are having good amount of earning per
share and this is also increasing their market value. Sports direct is having the earning per share
in year 2015 0.39 while in year 2016 they are having earning per share of 0.46. This indicate that
Sports Direct are having considerable amount of earning per share and they can also increase
their market value by issuing more number of share. This is same in case with JD sports but they
are having higher than that of Sport direct. As in year 2015 earning per share of JD sports was
about 0.5 and in 2016 it was doubled to 0.10. This clarify that JD sports are having higher
amount of earning on their per share.
Return on capital employed:
In this ratio company will make out that how well they are using all their long term
financing to generate adequate profit from them (Brou and Krueger, 2016). This profit is
generally before tax and interest and also called as return on investment. If return to their capital
employed is more than last year or form other firms this will be showing that they are having
large amount of profits to be invested again in company to earn higher profits next time.
Return on c apital em ploy ed
8
Paraphrase This Document
Need a fresh take? Get an instant paraphrase of this document with our AI Paraphraser
2015 2016
0
0.05
0.1
0.15
0.2
0.25
0.3
0.35
0.4
0.45
Sports Direct International
PLC
JD Sports fashion PL
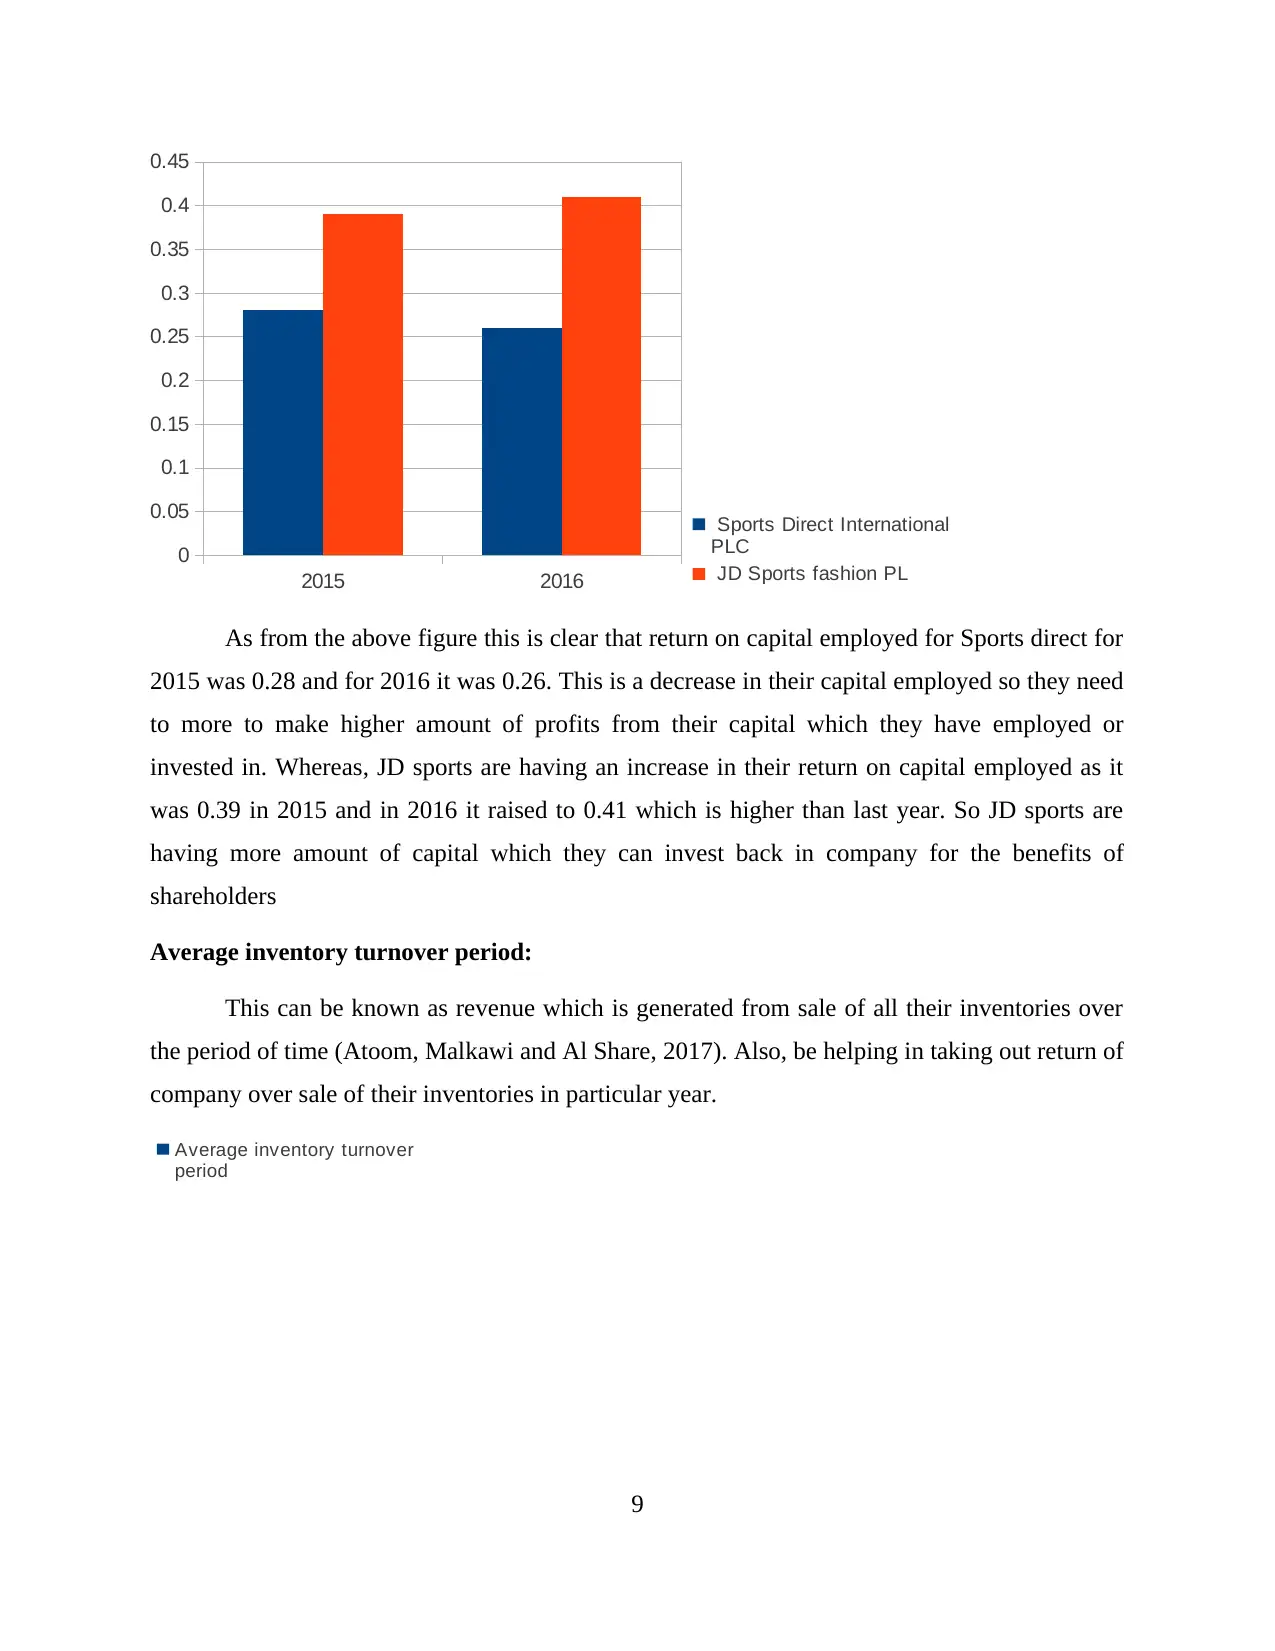
As from the above figure this is clear that return on capital employed for Sports direct for
2015 was 0.28 and for 2016 it was 0.26. This is a decrease in their capital employed so they need
to more to make higher amount of profits from their capital which they have employed or
invested in. Whereas, JD sports are having an increase in their return on capital employed as it
was 0.39 in 2015 and in 2016 it raised to 0.41 which is higher than last year. So JD sports are
having more amount of capital which they can invest back in company for the benefits of
shareholders
Average inventory turnover period:
This can be known as revenue which is generated from sale of all their inventories over
the period of time (Atoom, Malkawi and Al Share, 2017). Also, be helping in taking out return of
company over sale of their inventories in particular year.
Average inventory turnover
period
9
0
0.05
0.1
0.15
0.2
0.25
0.3
0.35
0.4
0.45
Sports Direct International
PLC
JD Sports fashion PL
As from the above figure this is clear that return on capital employed for Sports direct for
2015 was 0.28 and for 2016 it was 0.26. This is a decrease in their capital employed so they need
to more to make higher amount of profits from their capital which they have employed or
invested in. Whereas, JD sports are having an increase in their return on capital employed as it
was 0.39 in 2015 and in 2016 it raised to 0.41 which is higher than last year. So JD sports are
having more amount of capital which they can invest back in company for the benefits of
shareholders
Average inventory turnover period:
This can be known as revenue which is generated from sale of all their inventories over
the period of time (Atoom, Malkawi and Al Share, 2017). Also, be helping in taking out return of
company over sale of their inventories in particular year.
Average inventory turnover
period
9
2015 2016
0
0.5
1
1.5
2
2.5
3
Sports Direct International
PLC
JD Sports fashion PL
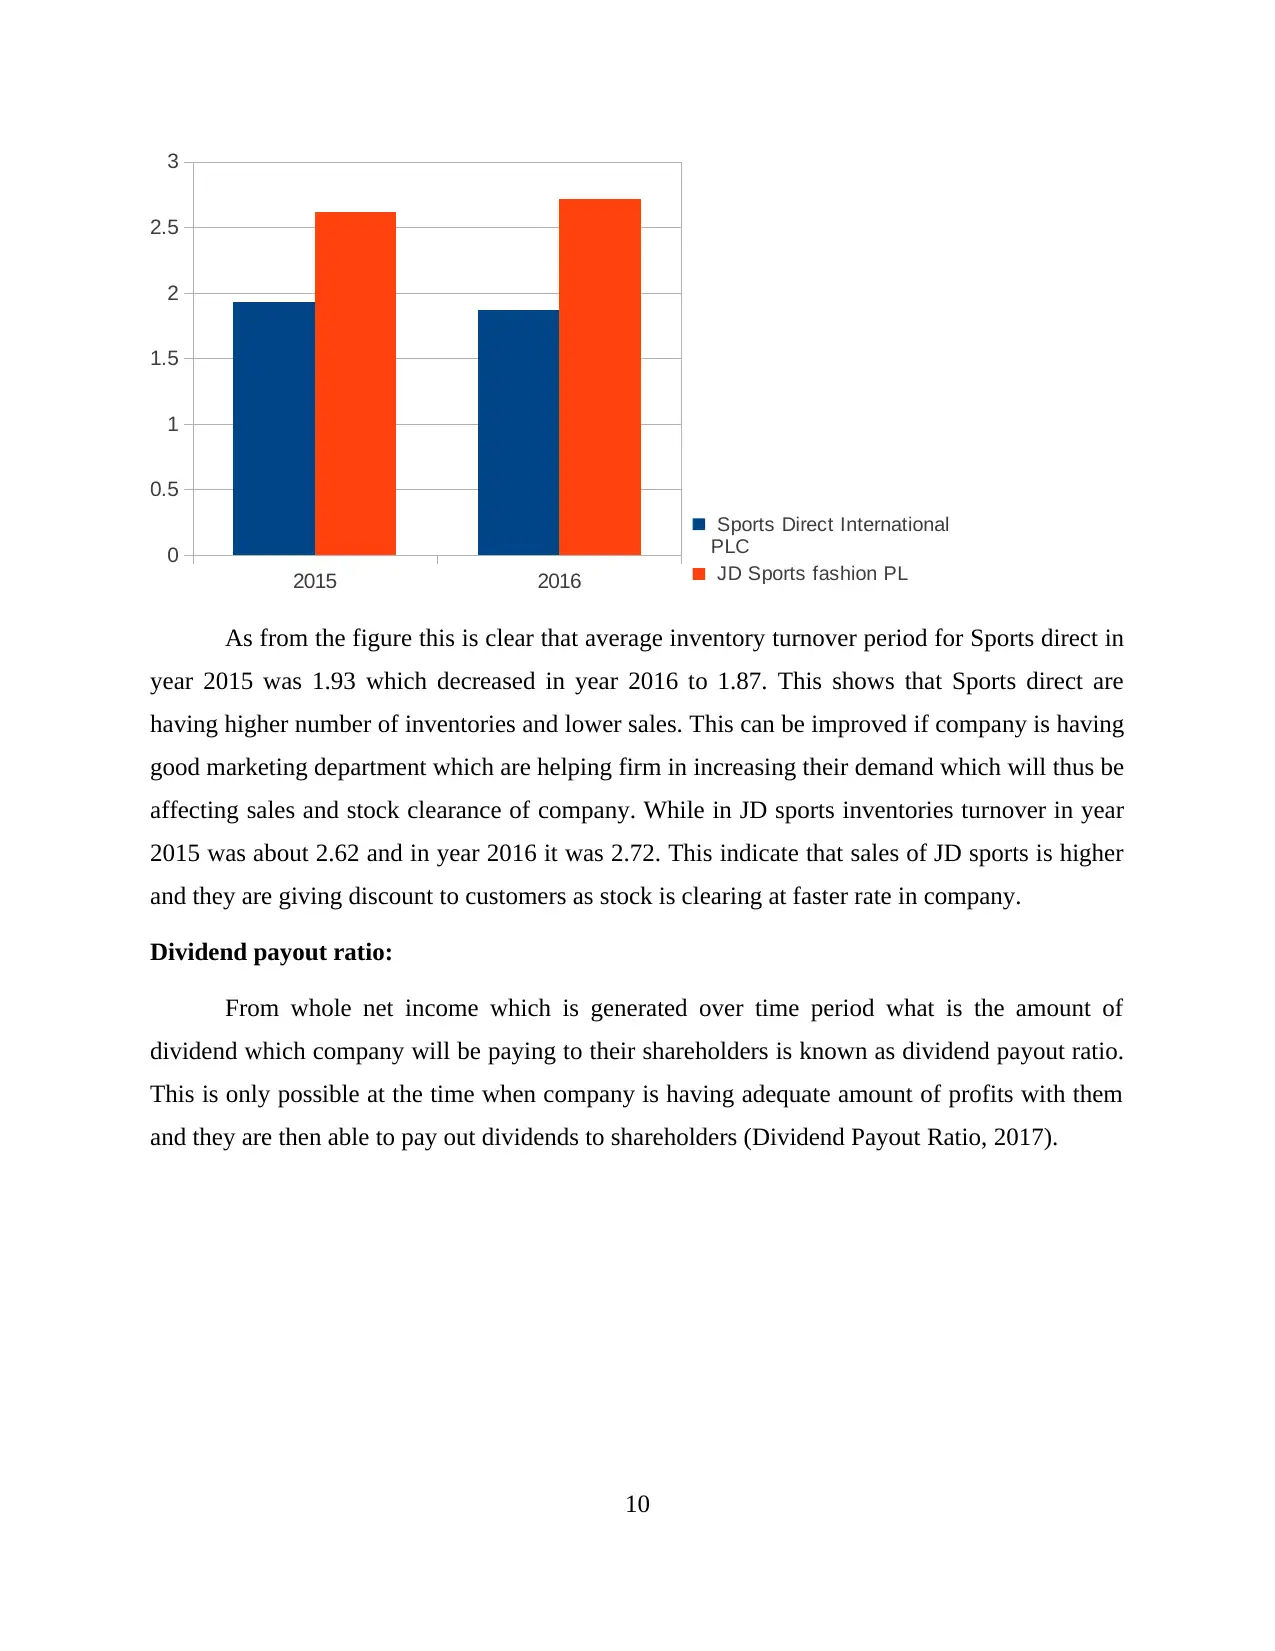
As from the figure this is clear that average inventory turnover period for Sports direct in
year 2015 was 1.93 which decreased in year 2016 to 1.87. This shows that Sports direct are
having higher number of inventories and lower sales. This can be improved if company is having
good marketing department which are helping firm in increasing their demand which will thus be
affecting sales and stock clearance of company. While in JD sports inventories turnover in year
2015 was about 2.62 and in year 2016 it was 2.72. This indicate that sales of JD sports is higher
and they are giving discount to customers as stock is clearing at faster rate in company.
Dividend payout ratio:
From whole net income which is generated over time period what is the amount of
dividend which company will be paying to their shareholders is known as dividend payout ratio.
This is only possible at the time when company is having adequate amount of profits with them
and they are then able to pay out dividends to shareholders (Dividend Payout Ratio, 2017).
10
0
0.5
1
1.5
2
2.5
3
Sports Direct International
PLC
JD Sports fashion PL
As from the figure this is clear that average inventory turnover period for Sports direct in
year 2015 was 1.93 which decreased in year 2016 to 1.87. This shows that Sports direct are
having higher number of inventories and lower sales. This can be improved if company is having
good marketing department which are helping firm in increasing their demand which will thus be
affecting sales and stock clearance of company. While in JD sports inventories turnover in year
2015 was about 2.62 and in year 2016 it was 2.72. This indicate that sales of JD sports is higher
and they are giving discount to customers as stock is clearing at faster rate in company.
Dividend payout ratio:
From whole net income which is generated over time period what is the amount of
dividend which company will be paying to their shareholders is known as dividend payout ratio.
This is only possible at the time when company is having adequate amount of profits with them
and they are then able to pay out dividends to shareholders (Dividend Payout Ratio, 2017).
10
⊘ This is a preview!⊘
Do you want full access?
Subscribe today to unlock all pages.
Trusted by 1+ million students worldwide
1 out of 20
Related Documents


Your All-in-One AI-Powered Toolkit for Academic Success.
+13062052269
info@desklib.com
Available 24*7 on WhatsApp / Email
![[object Object]](/_next/static/media/star-bottom.7253800d.svg)
Unlock your academic potential
Copyright © 2020–2026 A2Z Services. All Rights Reserved. Developed and managed by ZUCOL.