Managerial Finance Report: Analysis of Coach Inc.'s Finances
VerifiedAdded on 2020/11/12
|10
|2975
|111
Report
AI Summary
This report, focusing on managerial finance, analyzes the financial performance of Coach Inc. for the period of September 2018 to February 2019. It includes a detailed examination of the profit & loss account, balance sheet, and cash budget, alongside cash flow projections. The report highlights key financial metrics such as gross profit, net loss, and cash balances. It interprets the financial data, including the impact of debtors' policy on cash flow and provides recommendations for improving financial management, such as reducing the debtor's policy period. The report also includes working notes to support the calculations and interpretations of the financial data.

MANAGERIAL
FINANCE
FINANCE
Paraphrase This Document
Need a fresh take? Get an instant paraphrase of this document with our AI Paraphraser
Table of Contents
INTRODUCTION...........................................................................................................................1
MAIN BODY...................................................................................................................................1
Profit & Loss Account ...........................................................................................................1
Balance Sheet.........................................................................................................................2
Cash Budget............................................................................................................................3
Cash flows..............................................................................................................................5
Report for the managing director...........................................................................................6
CONCLUSION................................................................................................................................7
REFERENCES................................................................................................................................8
INTRODUCTION
Managerial finance is the branch of finance that asset of financial techniques to determine
how they affect the business externally and internally (Alhassan, 2015). Managerial finance takes
into mentation how to modify financial techniques to better the company and where changes can
be made to preclude loss. This approach is a assortment between managerial and corporate
financing. This reports covers prepare forecast profit and loss account for the two months of
September and October, a forecast balance sheet at the end 31 October. Prepare a cash budget for
the managing directors, a forecast cash flow and month end cash balances form September to
February 2019. Preparation of draft report to the managing director to analyse customers terms
of 30 to 60 days including financial and non financial factors.
MAIN BODY
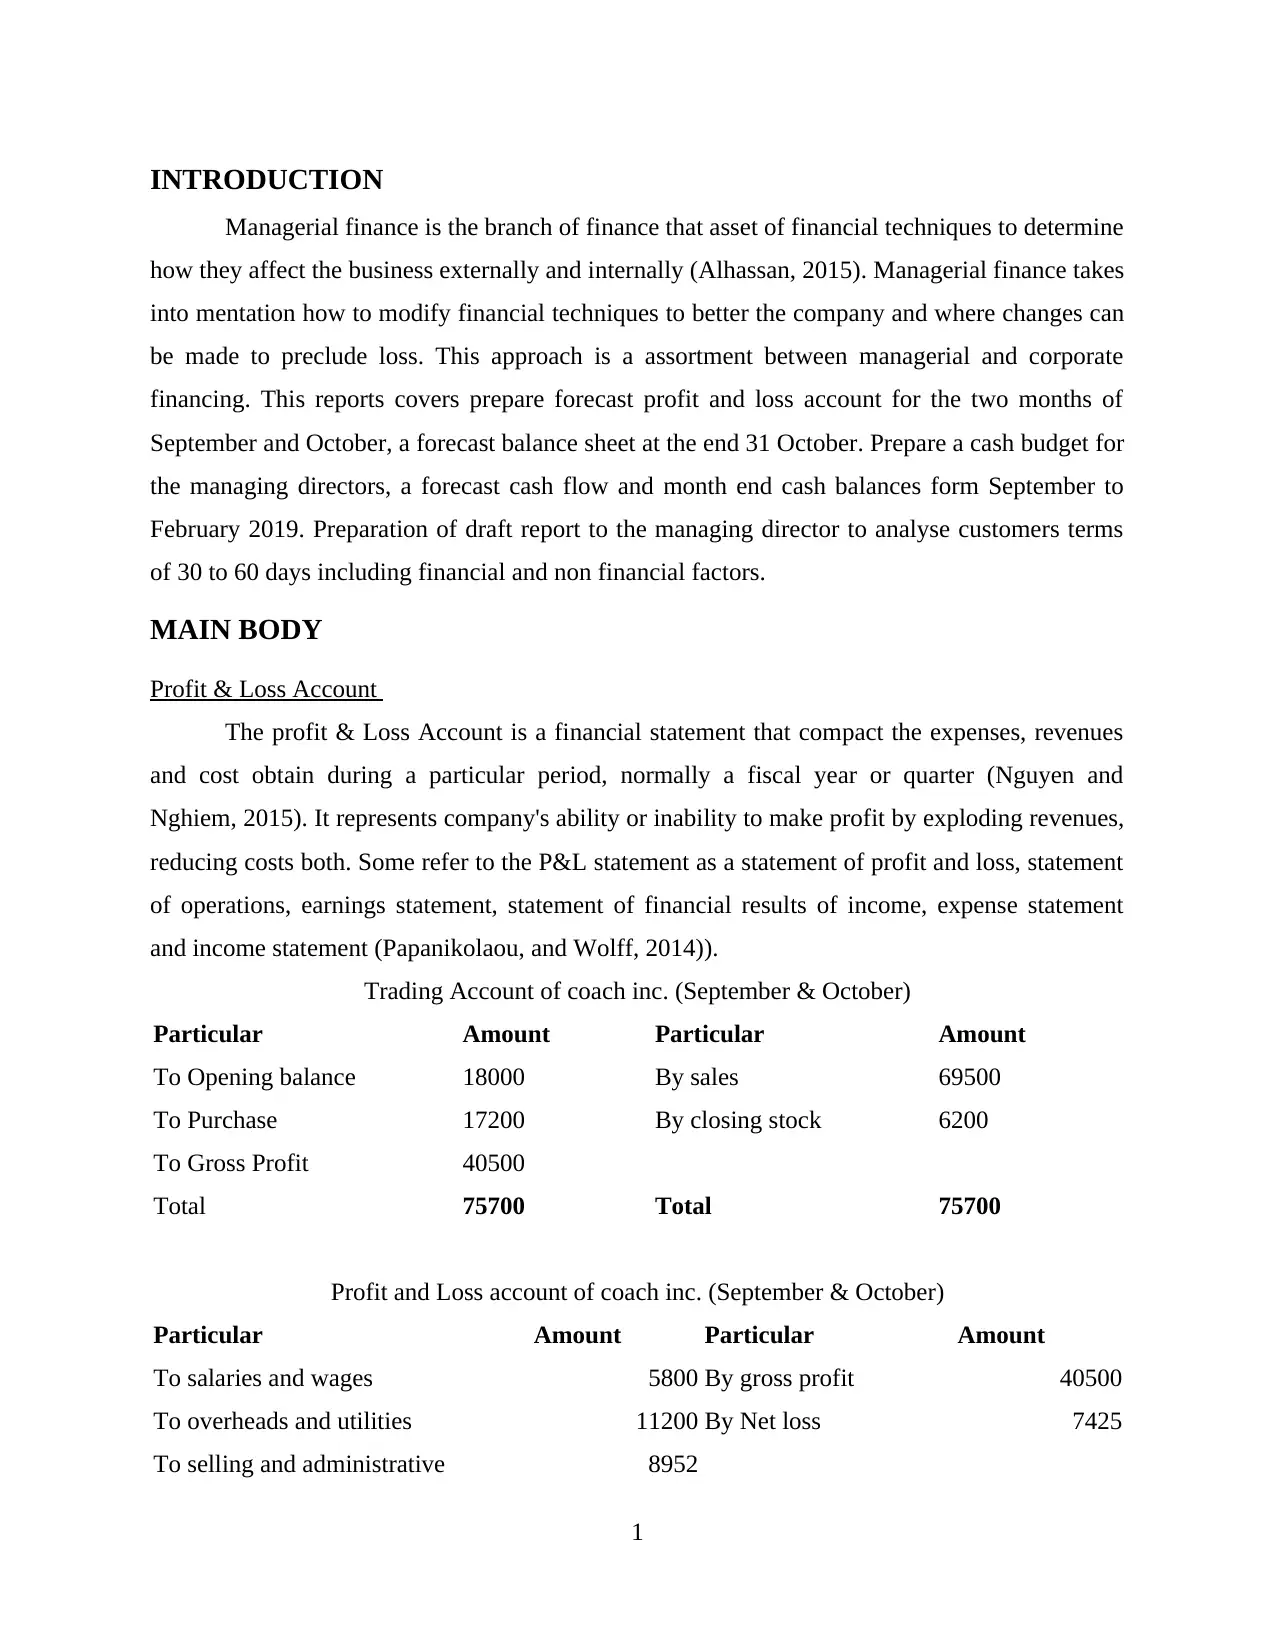
Profit & Loss Account
The profit & Loss Account is a financial statement that compact the expenses, revenues
and cost obtain during a particular period, normally a fiscal year or quarter (Nguyen and
Nghiem, 2015). It represents company's ability or inability to make profit by exploding revenues,
reducing costs both. Some refer to the P&L statement as a statement of profit and loss, statement
of operations, earnings statement, statement of financial results of income, expense statement
and income statement (Papanikolaou, and Wolff, 2014)).
Trading Account of coach inc. (September & October)
Particular Amount Particular Amount
To Opening balance 18000 By sales 69500
To Purchase 17200 By closing stock 6200
To Gross Profit 40500
Total 75700 Total 75700
Profit and Loss account of coach inc. (September & October)
Particular Amount Particular Amount
To salaries and wages 5800 By gross profit 40500
To overheads and utilities 11200 By Net loss 7425
To selling and administrative 8952
1
Managerial finance is the branch of finance that asset of financial techniques to determine
how they affect the business externally and internally (Alhassan, 2015). Managerial finance takes
into mentation how to modify financial techniques to better the company and where changes can
be made to preclude loss. This approach is a assortment between managerial and corporate
financing. This reports covers prepare forecast profit and loss account for the two months of
September and October, a forecast balance sheet at the end 31 October. Prepare a cash budget for
the managing directors, a forecast cash flow and month end cash balances form September to
February 2019. Preparation of draft report to the managing director to analyse customers terms
of 30 to 60 days including financial and non financial factors.
MAIN BODY
Profit & Loss Account
The profit & Loss Account is a financial statement that compact the expenses, revenues
and cost obtain during a particular period, normally a fiscal year or quarter (Nguyen and
Nghiem, 2015). It represents company's ability or inability to make profit by exploding revenues,
reducing costs both. Some refer to the P&L statement as a statement of profit and loss, statement
of operations, earnings statement, statement of financial results of income, expense statement
and income statement (Papanikolaou, and Wolff, 2014)).
Trading Account of coach inc. (September & October)
Particular Amount Particular Amount
To Opening balance 18000 By sales 69500
To Purchase 17200 By closing stock 6200
To Gross Profit 40500
Total 75700 Total 75700
Profit and Loss account of coach inc. (September & October)
Particular Amount Particular Amount
To salaries and wages 5800 By gross profit 40500
To overheads and utilities 11200 By Net loss 7425
To selling and administrative 8952
1
⊘ This is a preview!⊘
Do you want full access?
Subscribe today to unlock all pages.
Trusted by 1+ million students worldwide
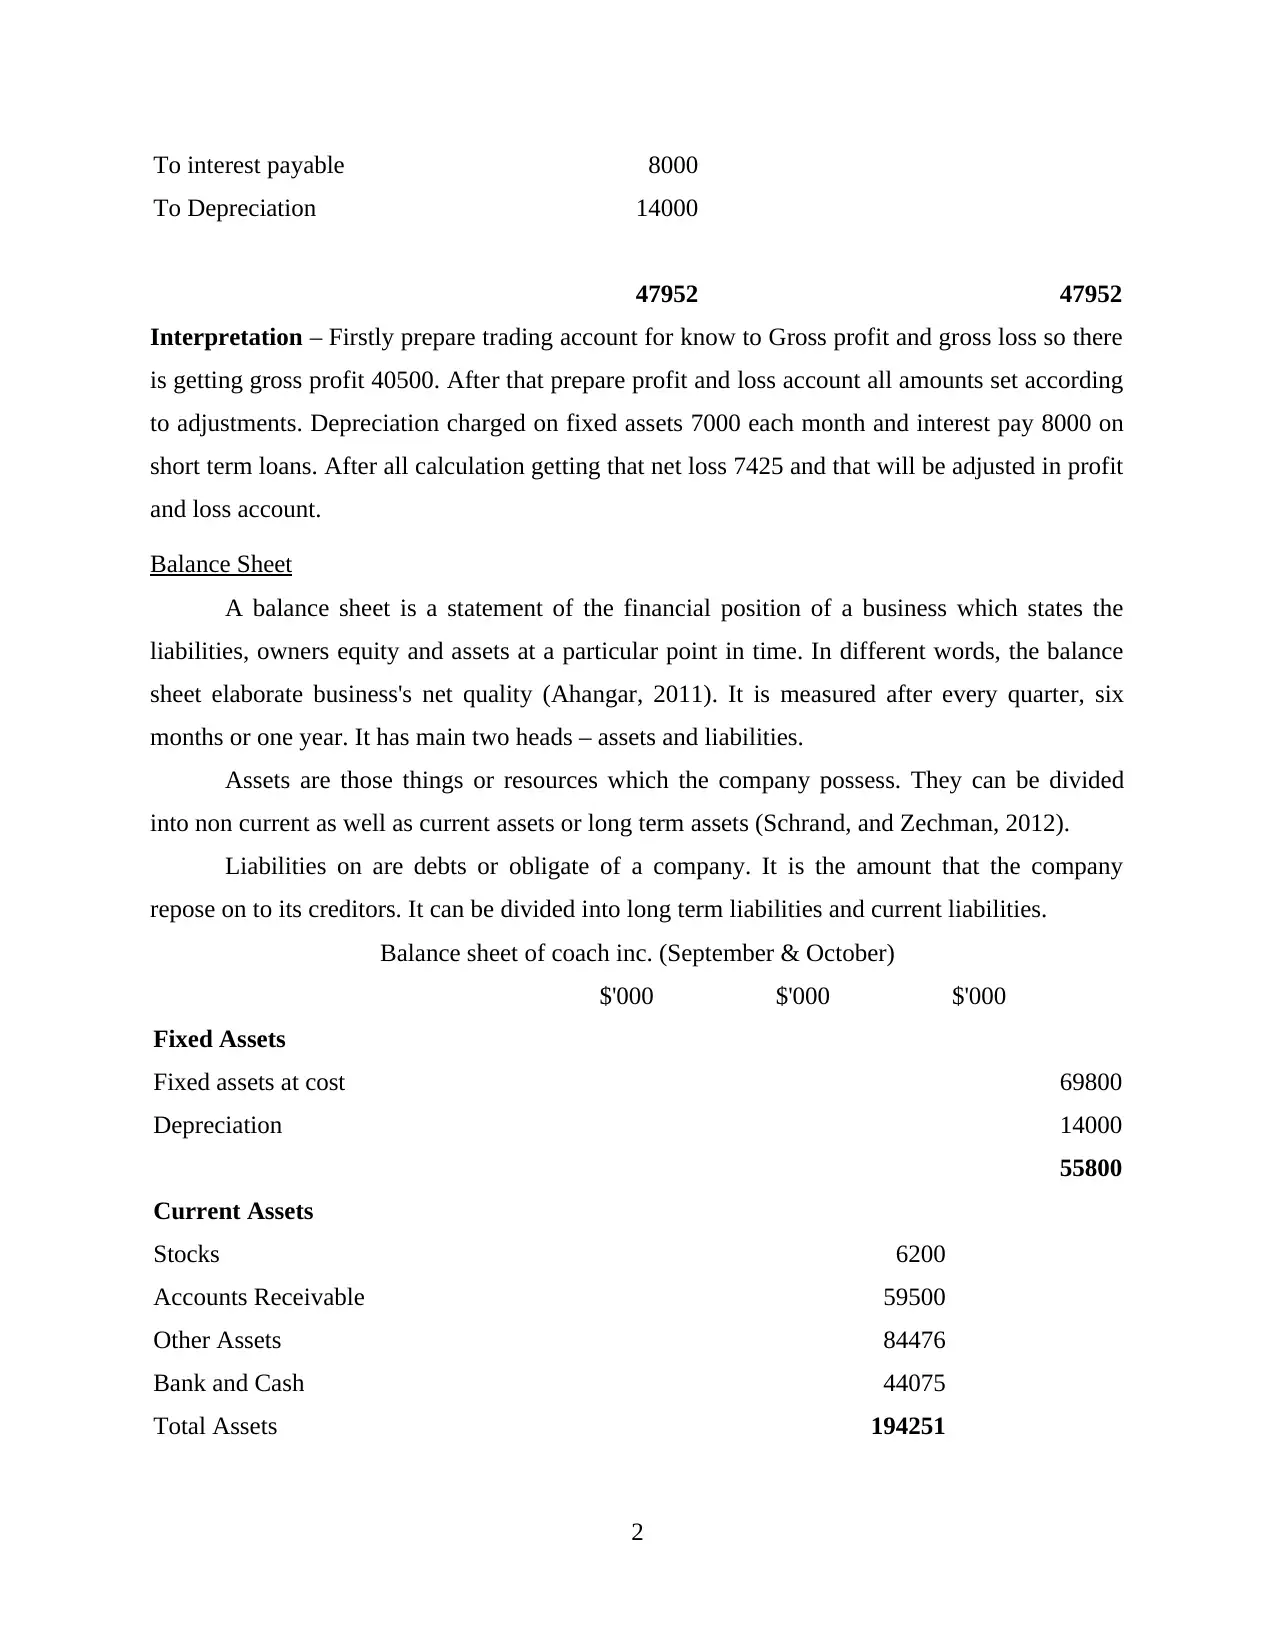
To interest payable 8000
To Depreciation 14000
47952 47952
Interpretation – Firstly prepare trading account for know to Gross profit and gross loss so there
is getting gross profit 40500. After that prepare profit and loss account all amounts set according
to adjustments. Depreciation charged on fixed assets 7000 each month and interest pay 8000 on
short term loans. After all calculation getting that net loss 7425 and that will be adjusted in profit
and loss account.
Balance Sheet
A balance sheet is a statement of the financial position of a business which states the
liabilities, owners equity and assets at a particular point in time. In different words, the balance
sheet elaborate business's net quality (Ahangar, 2011). It is measured after every quarter, six
months or one year. It has main two heads – assets and liabilities.
Assets are those things or resources which the company possess. They can be divided
into non current as well as current assets or long term assets (Schrand, and Zechman, 2012).
Liabilities on are debts or obligate of a company. It is the amount that the company
repose on to its creditors. It can be divided into long term liabilities and current liabilities.
Balance sheet of coach inc. (September & October)
$'000 $'000 $'000
Fixed Assets
Fixed assets at cost 69800
Depreciation 14000
55800
Current Assets
Stocks 6200
Accounts Receivable 59500
Other Assets 84476
Bank and Cash 44075
Total Assets 194251
2
Paraphrase This Document
Need a fresh take? Get an instant paraphrase of this document with our AI Paraphraser
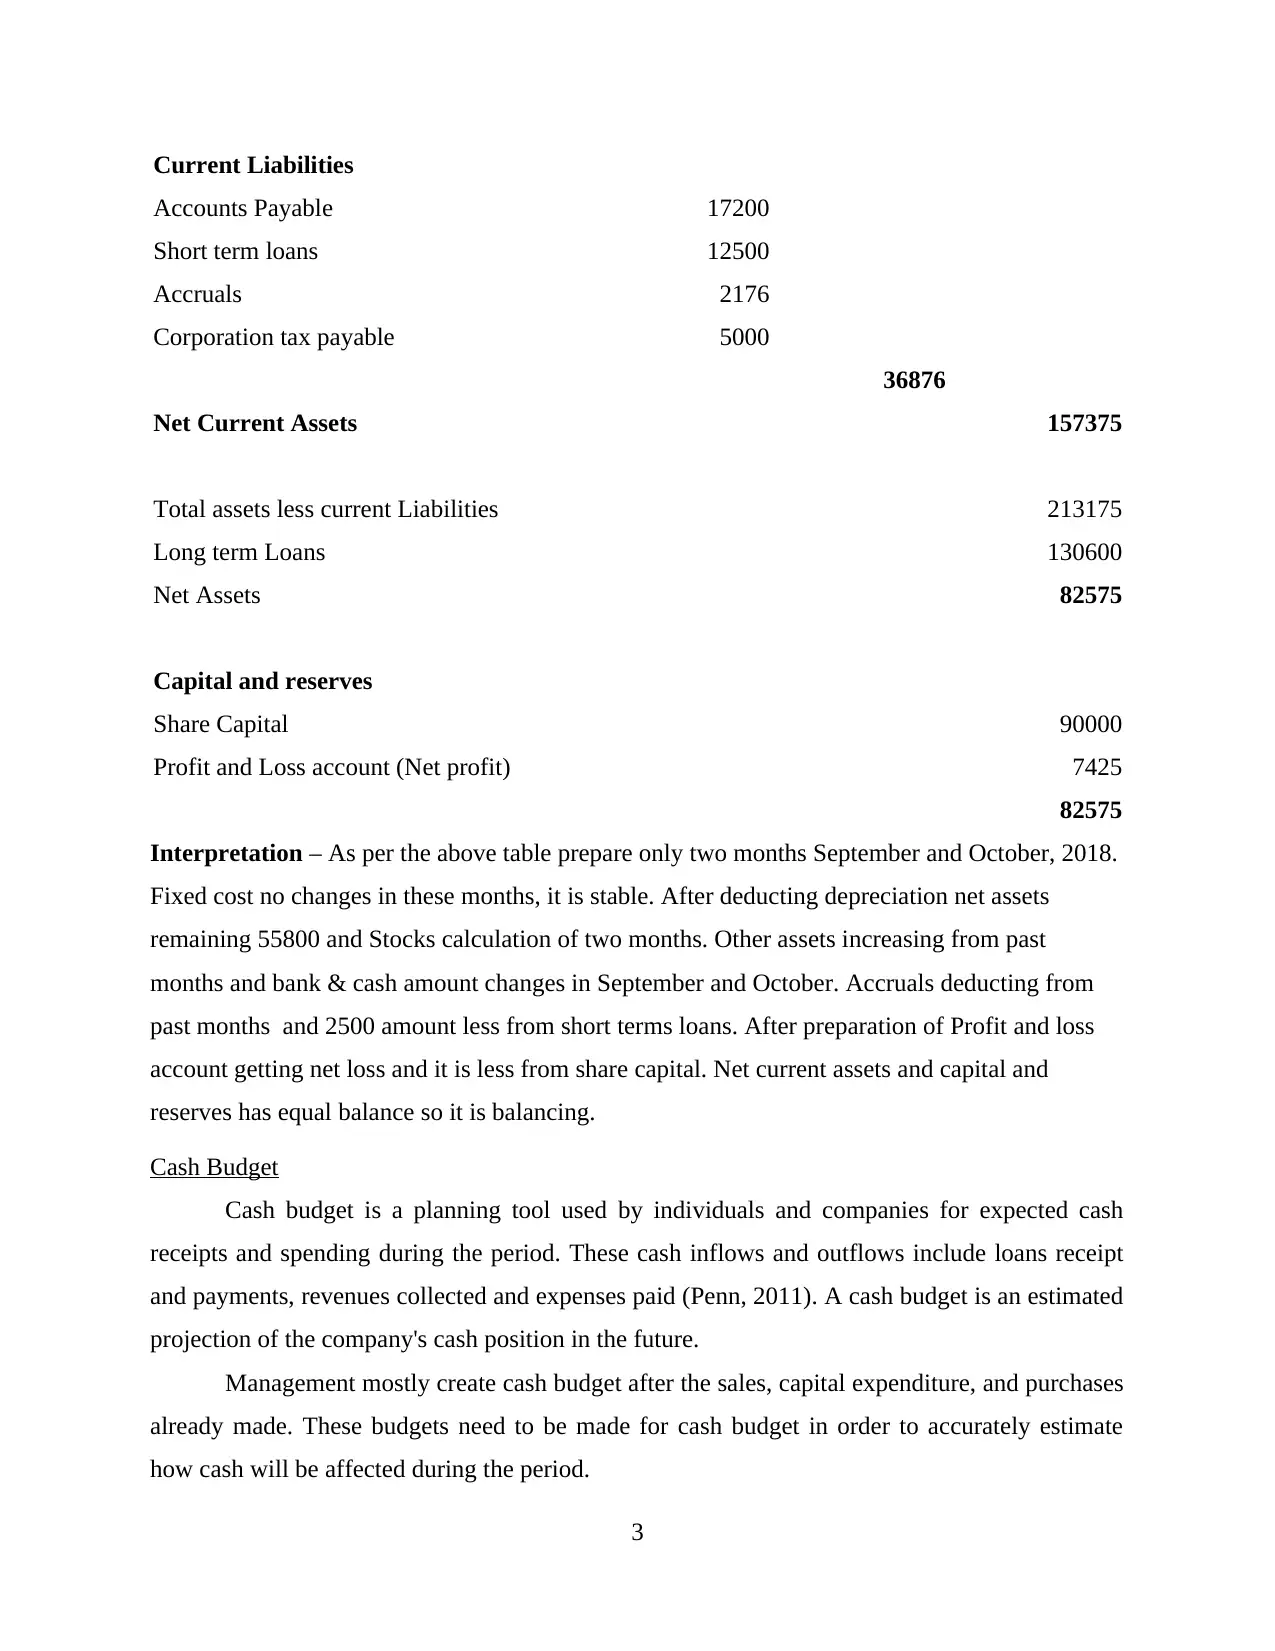
Current Liabilities
Accounts Payable 17200
Short term loans 12500
Accruals 2176
Corporation tax payable 5000
36876
Net Current Assets 157375
Total assets less current Liabilities 213175
Long term Loans 130600
Net Assets 82575
Capital and reserves
Share Capital 90000
Profit and Loss account (Net profit) 7425
82575
Interpretation – As per the above table prepare only two months September and October, 2018.
Fixed cost no changes in these months, it is stable. After deducting depreciation net assets
remaining 55800 and Stocks calculation of two months. Other assets increasing from past
months and bank & cash amount changes in September and October. Accruals deducting from
past months and 2500 amount less from short terms loans. After preparation of Profit and loss
account getting net loss and it is less from share capital. Net current assets and capital and
reserves has equal balance so it is balancing.
Cash Budget
Cash budget is a planning tool used by individuals and companies for expected cash
receipts and spending during the period. These cash inflows and outflows include loans receipt
and payments, revenues collected and expenses paid (Penn, 2011). A cash budget is an estimated
projection of the company's cash position in the future.
Management mostly create cash budget after the sales, capital expenditure, and purchases
already made. These budgets need to be made for cash budget in order to accurately estimate
how cash will be affected during the period.
3

Cash Budget of Coach inc.
Particulars (in 000) September October November December January February
Opening balance 10500 10150 44075 52925 63425 76580
(A) Cash receipts
Sales 22500 56000 30500 32500 35000 36500
Total 33000 66150 74575 85425 98425 113080
(B) Cash payments
Purchase 10000 9000 8600 8600 8600 8600
Salaries and wages 2900 2900 2900 2900 2900 2900
Overheads 5600 5600 5600 5600 5600 5600
Selling and
administration 4350 4575 4550 4900 4745 4940
Total 22850 22075 21650 22000 21845 22040
Cash at the end (A-
B) 10150 44075 52925 63425 76580 91040
Working Notes -
Sales – September = Sales of July (60 Days) = 22500
October = Sales of August (45 days) + Sales of September (30 days)
27000 + 29000 = 56000
November = Sales of October (30 days) = 30500
December = Sales of November (30 days ) = 32500
January = Sales of December (30 days ) = 35000
February = Sales of January (30 days) = 36500
Purchase – September = Purchase of July ( 45 days) = 10000
October = Purchase of August ( 45 days) = 9000
November = Purchase of September ( 45 days) = 8600
December = Purchase of October ( 45 days) = 8600
January = Purchase of November ( 45 days) = 8600
February = Purchase of December ( 45 days) = 8600
Selling and Administrative -
4
⊘ This is a preview!⊘
Do you want full access?
Subscribe today to unlock all pages.
Trusted by 1+ million students worldwide
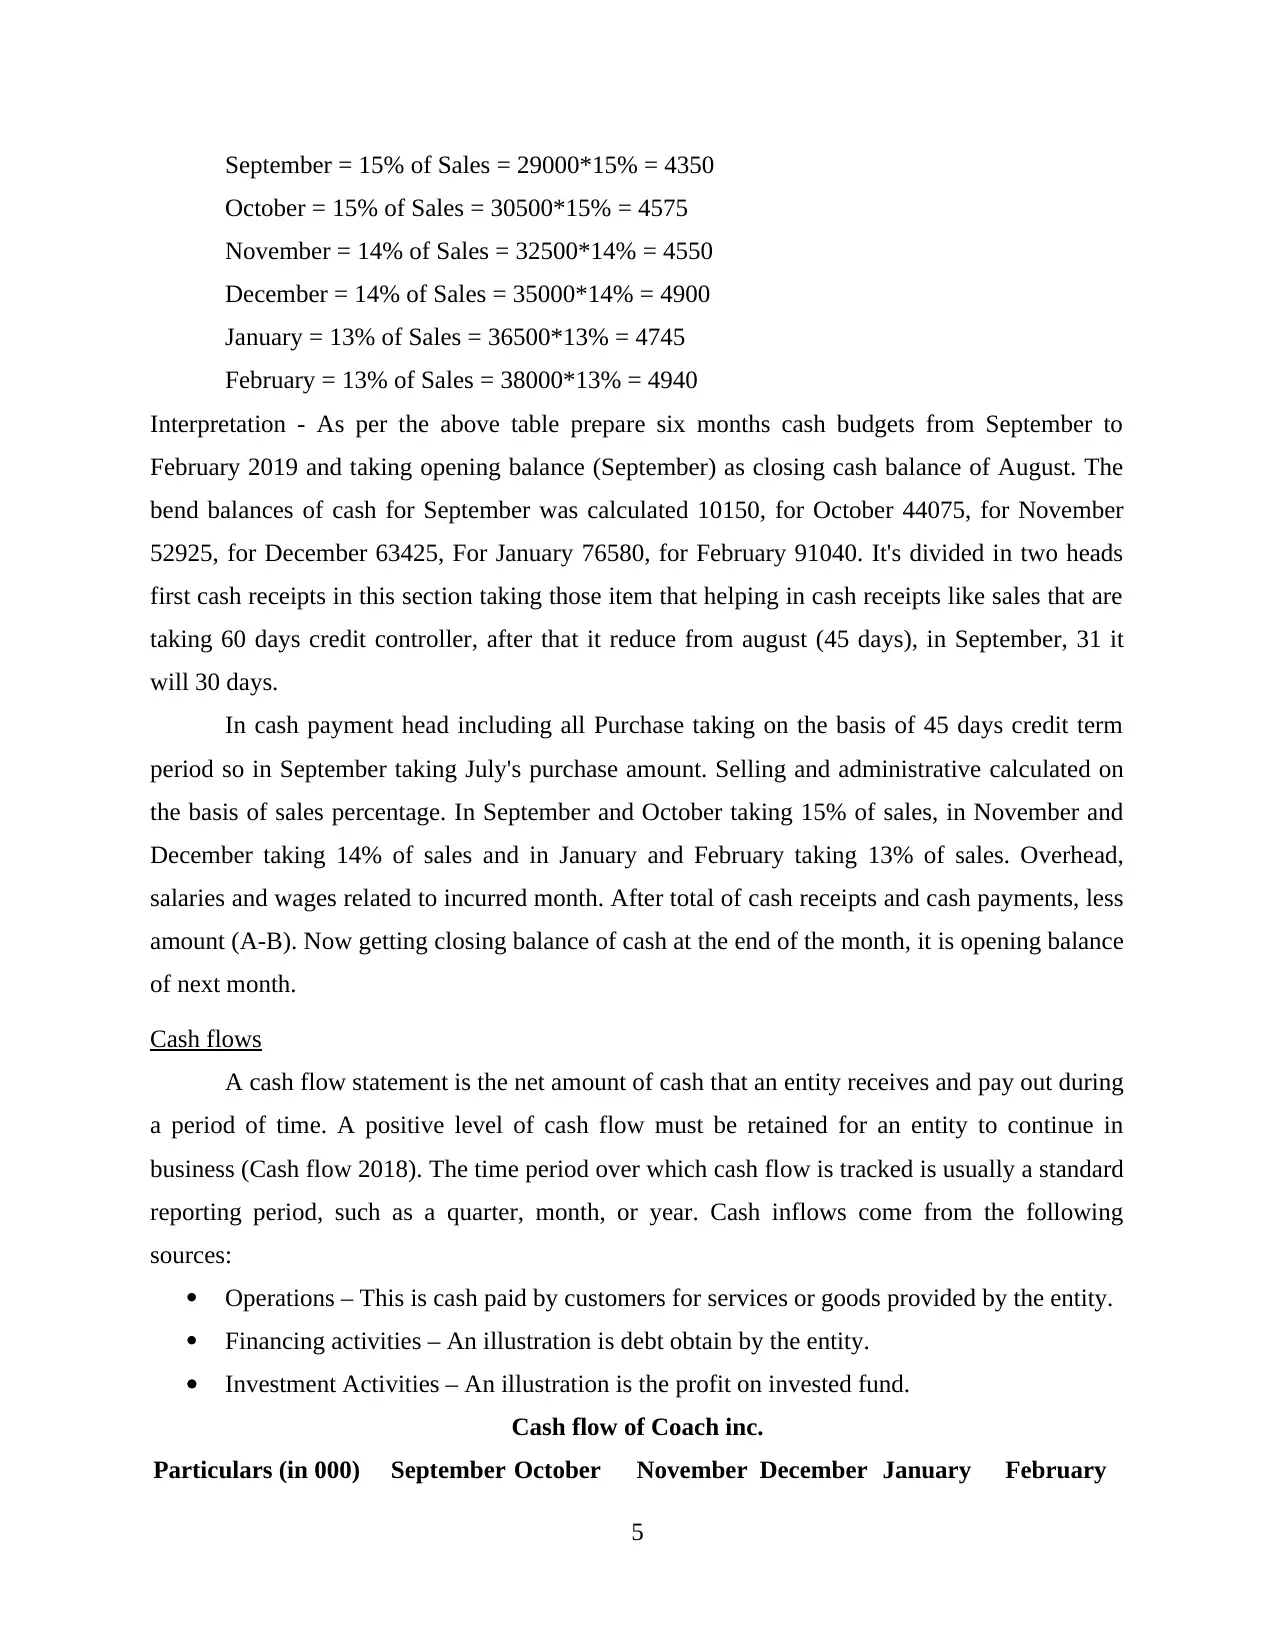
September = 15% of Sales = 29000*15% = 4350
October = 15% of Sales = 30500*15% = 4575
November = 14% of Sales = 32500*14% = 4550
December = 14% of Sales = 35000*14% = 4900
January = 13% of Sales = 36500*13% = 4745
February = 13% of Sales = 38000*13% = 4940
Interpretation - As per the above table prepare six months cash budgets from September to
February 2019 and taking opening balance (September) as closing cash balance of August. The
bend balances of cash for September was calculated 10150, for October 44075, for November
52925, for December 63425, For January 76580, for February 91040. It's divided in two heads
first cash receipts in this section taking those item that helping in cash receipts like sales that are
taking 60 days credit controller, after that it reduce from august (45 days), in September, 31 it
will 30 days.
In cash payment head including all Purchase taking on the basis of 45 days credit term
period so in September taking July's purchase amount. Selling and administrative calculated on
the basis of sales percentage. In September and October taking 15% of sales, in November and
December taking 14% of sales and in January and February taking 13% of sales. Overhead,
salaries and wages related to incurred month. After total of cash receipts and cash payments, less
amount (A-B). Now getting closing balance of cash at the end of the month, it is opening balance
of next month.
Cash flows
A cash flow statement is the net amount of cash that an entity receives and pay out during
a period of time. A positive level of cash flow must be retained for an entity to continue in
business (Cash flow 2018). The time period over which cash flow is tracked is usually a standard
reporting period, such as a quarter, month, or year. Cash inflows come from the following
sources:
Operations – This is cash paid by customers for services or goods provided by the entity.
Financing activities – An illustration is debt obtain by the entity.
Investment Activities – An illustration is the profit on invested fund.
Cash flow of Coach inc.
Particulars (in 000) September October November December January February
5
Paraphrase This Document
Need a fresh take? Get an instant paraphrase of this document with our AI Paraphraser
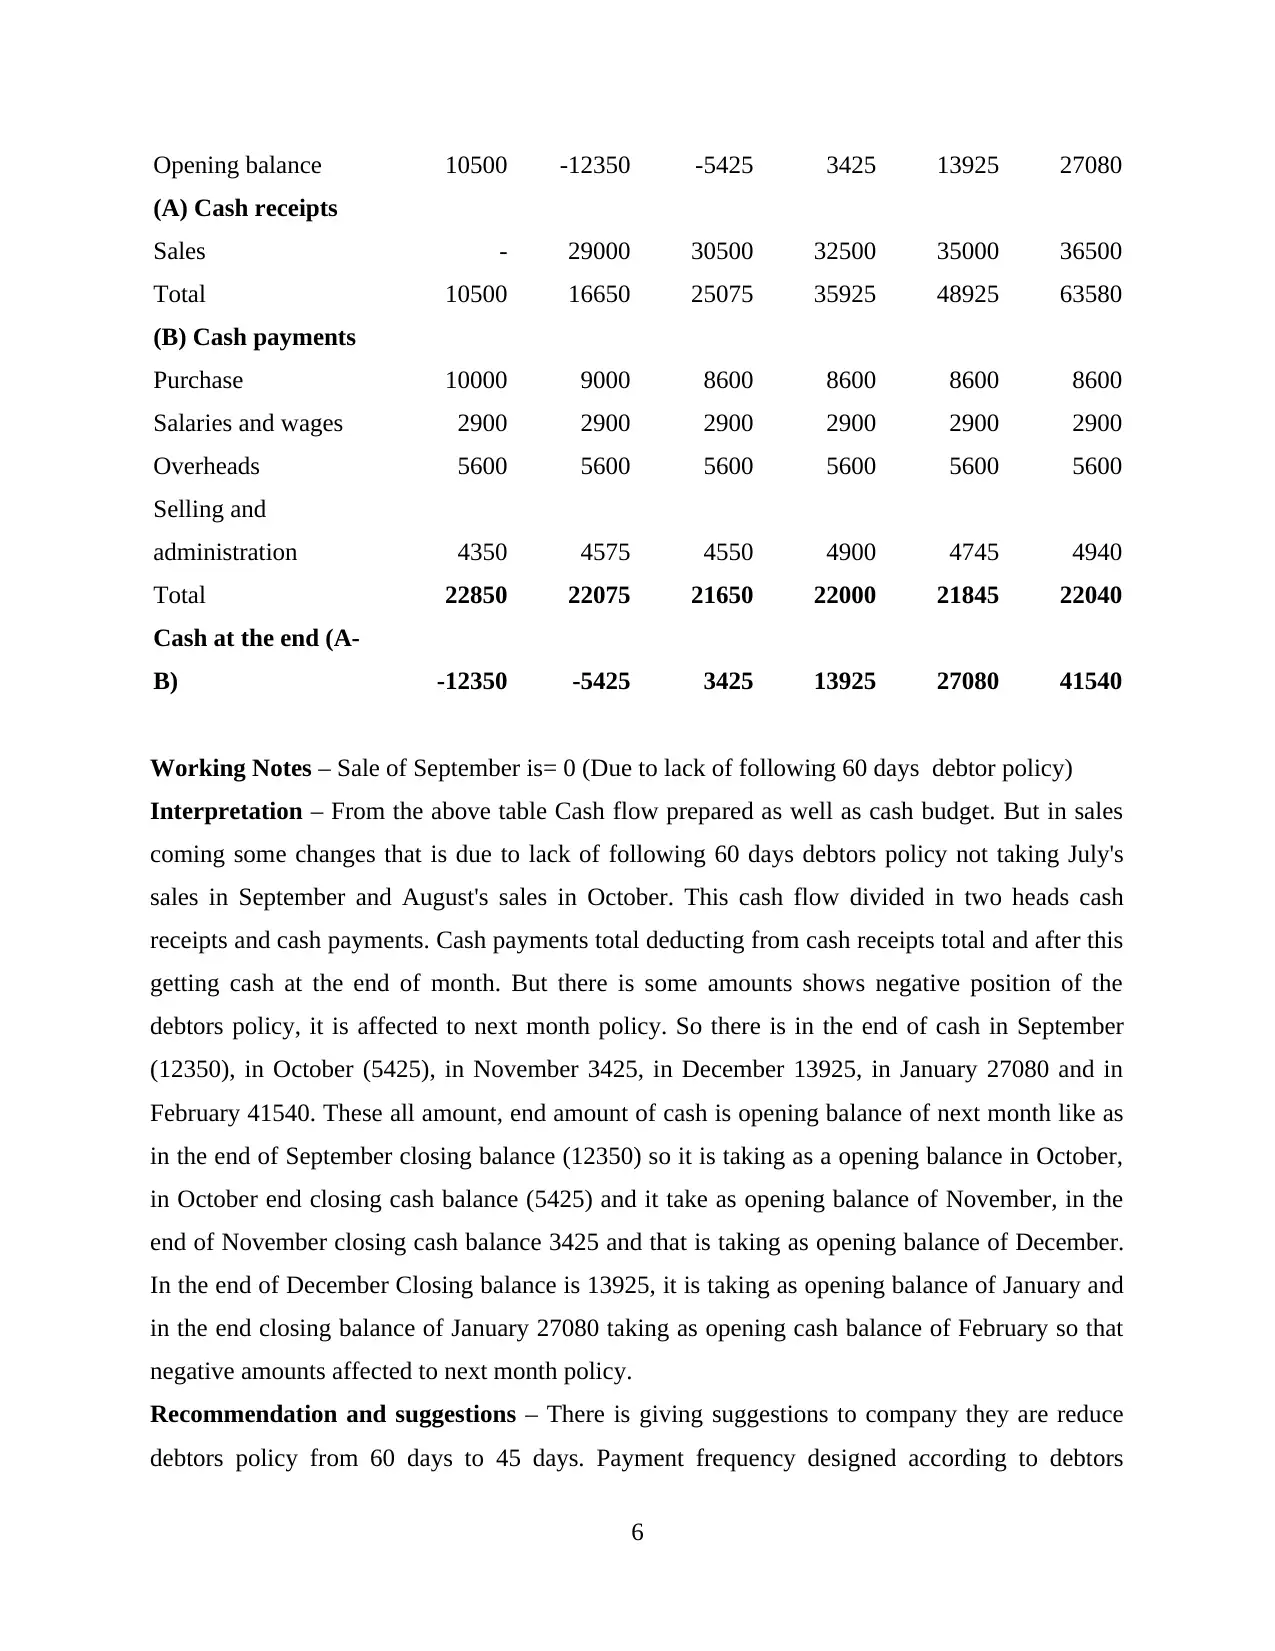
Opening balance 10500 -12350 -5425 3425 13925 27080
(A) Cash receipts
Sales - 29000 30500 32500 35000 36500
Total 10500 16650 25075 35925 48925 63580
(B) Cash payments
Purchase 10000 9000 8600 8600 8600 8600
Salaries and wages 2900 2900 2900 2900 2900 2900
Overheads 5600 5600 5600 5600 5600 5600
Selling and
administration 4350 4575 4550 4900 4745 4940
Total 22850 22075 21650 22000 21845 22040
Cash at the end (A-
B) -12350 -5425 3425 13925 27080 41540
Working Notes – Sale of September is= 0 (Due to lack of following 60 days debtor policy)
Interpretation – From the above table Cash flow prepared as well as cash budget. But in sales
coming some changes that is due to lack of following 60 days debtors policy not taking July's
sales in September and August's sales in October. This cash flow divided in two heads cash
receipts and cash payments. Cash payments total deducting from cash receipts total and after this
getting cash at the end of month. But there is some amounts shows negative position of the
debtors policy, it is affected to next month policy. So there is in the end of cash in September
(12350), in October (5425), in November 3425, in December 13925, in January 27080 and in
February 41540. These all amount, end amount of cash is opening balance of next month like as
in the end of September closing balance (12350) so it is taking as a opening balance in October,
in October end closing cash balance (5425) and it take as opening balance of November, in the
end of November closing cash balance 3425 and that is taking as opening balance of December.
In the end of December Closing balance is 13925, it is taking as opening balance of January and
in the end closing balance of January 27080 taking as opening cash balance of February so that
negative amounts affected to next month policy.
Recommendation and suggestions – There is giving suggestions to company they are reduce
debtors policy from 60 days to 45 days. Payment frequency designed according to debtors
6
because each debtor have rules and regulations for payment and they are applied on payment
system. Accuracy is major fact for the debtor because if in company not applying accuracy so it
is affected to debtors collection (Bhandari and Iyer, 2013). Credibility, Debtors credit policy
decided according to credit score, if credit score is good so giving loan easily but it's not good so
not giving easily loan to debtors, duration also set according to credit score because it's totally
depended on credit score, collection period should also reduce of debtors otherwise it is always
affected to debtors policy (Cunha, 2014).
Report for the managing director
After analysis results come out that company have to reduce debtors collection policy. In
Starting they applying 60 days collection period but they were not getting on time and not paying
suppliers on time. So in September they reduce collection period from 60 to 45 days but it also
not effected to collection period. So it reduce 30 days and stay that time period for debtors
because debtors not paying on time (Larkin, 2013). If giving more days to debtors so they taking
more time for paying and cash balance fluctuated time to time and that's not good for company.
So for stable cash balance collect amounts on time, and paying to creditors on time.
It also affected to cash flow factors like monetary or non monetary because in cash flow
calculated operating, investing and financial activities. So these activities effected by this policy
because mostly in investing activities calculated on the basis of collection period and payable
period. Non monetary factors effected due to relations between debtors and customers and
services provided by company (Attanasio, and Lechene, 2014).
CONCLUSION
It is concluded that managerial finance important for business because it's using for
financial statement. It is using for apply techniques on financial statements. In financial
statement including profit and loss account, balance sheet, also including cash budget, cash
flows. Cash budgets shows cash information in month starting and month ending, and cash flows
shows effect collection period policy. Coach inc. prepare financial statements for two months of
September and October like balance sheet for actual position of company. Cash budget for
ending and starting cash balance, cash flow for show effect collection period policy and profit &
loss account for calculation net profit and loss. So these accounts prepare by managerial finance
techniques.
7
⊘ This is a preview!⊘
Do you want full access?
Subscribe today to unlock all pages.
Trusted by 1+ million students worldwide
REFERENCES
Books and journal
Alhassan, A.L., 2015. Income diversification and bank efficiency in an emerging market.
Managerial Finance. 41(12). pp.1318-1335.
Nguyen, T.P.T. and Nghiem, S.H., 2015. The interrelationships among default risk, capital ratio
and efficiency: evidence from Indian banks. Managerial Finance. 41(5). pp.507-525.
Ahangar, R.G., 2011. The relationship between intellectual capital and financial performance: An
empirical investigation in an Iranian company. African journal of business
management. 5(1). pp.88-95.
Penn, H., 2011. Gambling on the market: The role of for-profit provision in early childhood
education and care. Journal of Early Childhood Research. 9(2). pp.150-161.
Bhandari, S.B. and Iyer, R., 2013. Predicting business failure using cash flow statement based
measures. Managerial Finance. 39(7). pp.667-676.
Larkin, Y., 2013. Brand perception, cash flow stability, and financial policy. Journal of Financial
Economics. 110(1), pp.232-253.
Attanasio, O.P. and Lechene, V., 2014. Efficient responses to targeted cash transfers. Journal of
Political Economy. 122(1). pp.178-222.
Cunha, J.M., 2014. Testing paternalism: Cash versus in-kind transfers. American Economic
Journal: Applied Economics. 6(2). pp.195-230.
Schrand, C.M. and Zechman, S.L., 2012. Executive overconfidence and the slippery slope to
financial misreporting. Journal of Accounting and Economics. 53(1-2), pp.311-329.
Papanikolaou, N.I. and Wolff, C.C., 2014. The role of on-and off-balance-sheet leverage of
banks in the late 2000s crisis. Journal of Financial Stability. 14. pp.3-22.
Online
Cash flow 2018. [Online] Avilable through;
<https://corporatefinanceinstitute.com/resources/knowledge/finance/cash-flow/>
8
1 out of 10
Related Documents


Your All-in-One AI-Powered Toolkit for Academic Success.
+13062052269
info@desklib.com
Available 24*7 on WhatsApp / Email
![[object Object]](/_next/static/media/star-bottom.7253800d.svg)
Unlock your academic potential
Copyright © 2020–2026 A2Z Services. All Rights Reserved. Developed and managed by ZUCOL.