Managerial Finance Report: Financial Analysis of Tesco and Sainsbury
VerifiedAdded on 2022/12/30
|16
|3748
|85
Report
AI Summary
This report provides a detailed financial analysis of Tesco and Sainsbury, two major players in the retail sector. The report begins with an introduction to the importance of finance in an organization and then proceeds to analyze the financial performance of Tesco and Sainsbury using ratio analysis. It covers various ratios, including current ratio, gross profit ratio, net profit ratio, quick ratio, P/E ratio, dividend payout ratio, capital gearing ratio, earning per share ratio, average inventory turnover ratio, and return on capital employed ratio. The report then compares the two companies based on these ratios, offering interpretations and recommendations for improvement. Furthermore, the report includes an examination of investment appraisal techniques, comparing project A and project B, and discusses the limitations of these techniques. The report concludes with a summary of the findings and a list of references.
Managerial
Finance
Finance
Paraphrase This Document
Need a fresh take? Get an instant paraphrase of this document with our AI Paraphraser
Table of Contents
INTRODUCTION...........................................................................................................................3
PORTFOLIO 1.................................................................................................................................3
Ratio analysis of Tesco and Sainsbury:.......................................................................................3
Comparison of Tesco and Sainsbury by interpretation:...............................................................5
Recommendations for both the companies:.................................................................................8
Limitations of ratio analysis for knowing firms financial position:............................................8
PORTFOLIO 2.................................................................................................................................9
Investment appraisal techniques for knowing which option is better project A and project B.. .9
Limitations of investment appraisal techniques:........................................................................10
CONCLUSION..............................................................................................................................11
REFERENCES..............................................................................................................................12
INTRODUCTION
Finance is the necessary function in any organisation which provides support to all
activities of the organisation. It is about to acquire and manage funds within an organisation. It is
the management of matters related to money and investments. It is the system which describes
the system of money, investments, and financial institutions. Finance is plays vital role in any
organisation for running its activities because for generating anything in company money is
necessary which is managed by finance department. Finance department helps organisation for
arranging needed funds and known for which option is beneficial for it in order to investing
money so that it can get higher returns. Financial management is about planning, organising,
analysing, controlling, managing financial resources of the organisation (Arjunan, 2019). The
company which is selected for this report is Tesco and Sainsburry. Tesco is the British
multinational company deals in retail sector. It was founded in 1919, headquarter situated in UK.
Sainsburry has largest chain of supermarkets which deals in retail sector. It was founded in 1922,
headquarter situated in London. This report covers topics such as ratio analysis of Tesco and
Sainsbury and comparison between both, limitations of ratio analysis for knowing financial
position of the company. Apart from this it also covers topics such as investment appraisal
techniques and limitations of investment appraisal techniques (Ermasova and Ebdon, 2019).
PORTFOLIO 1
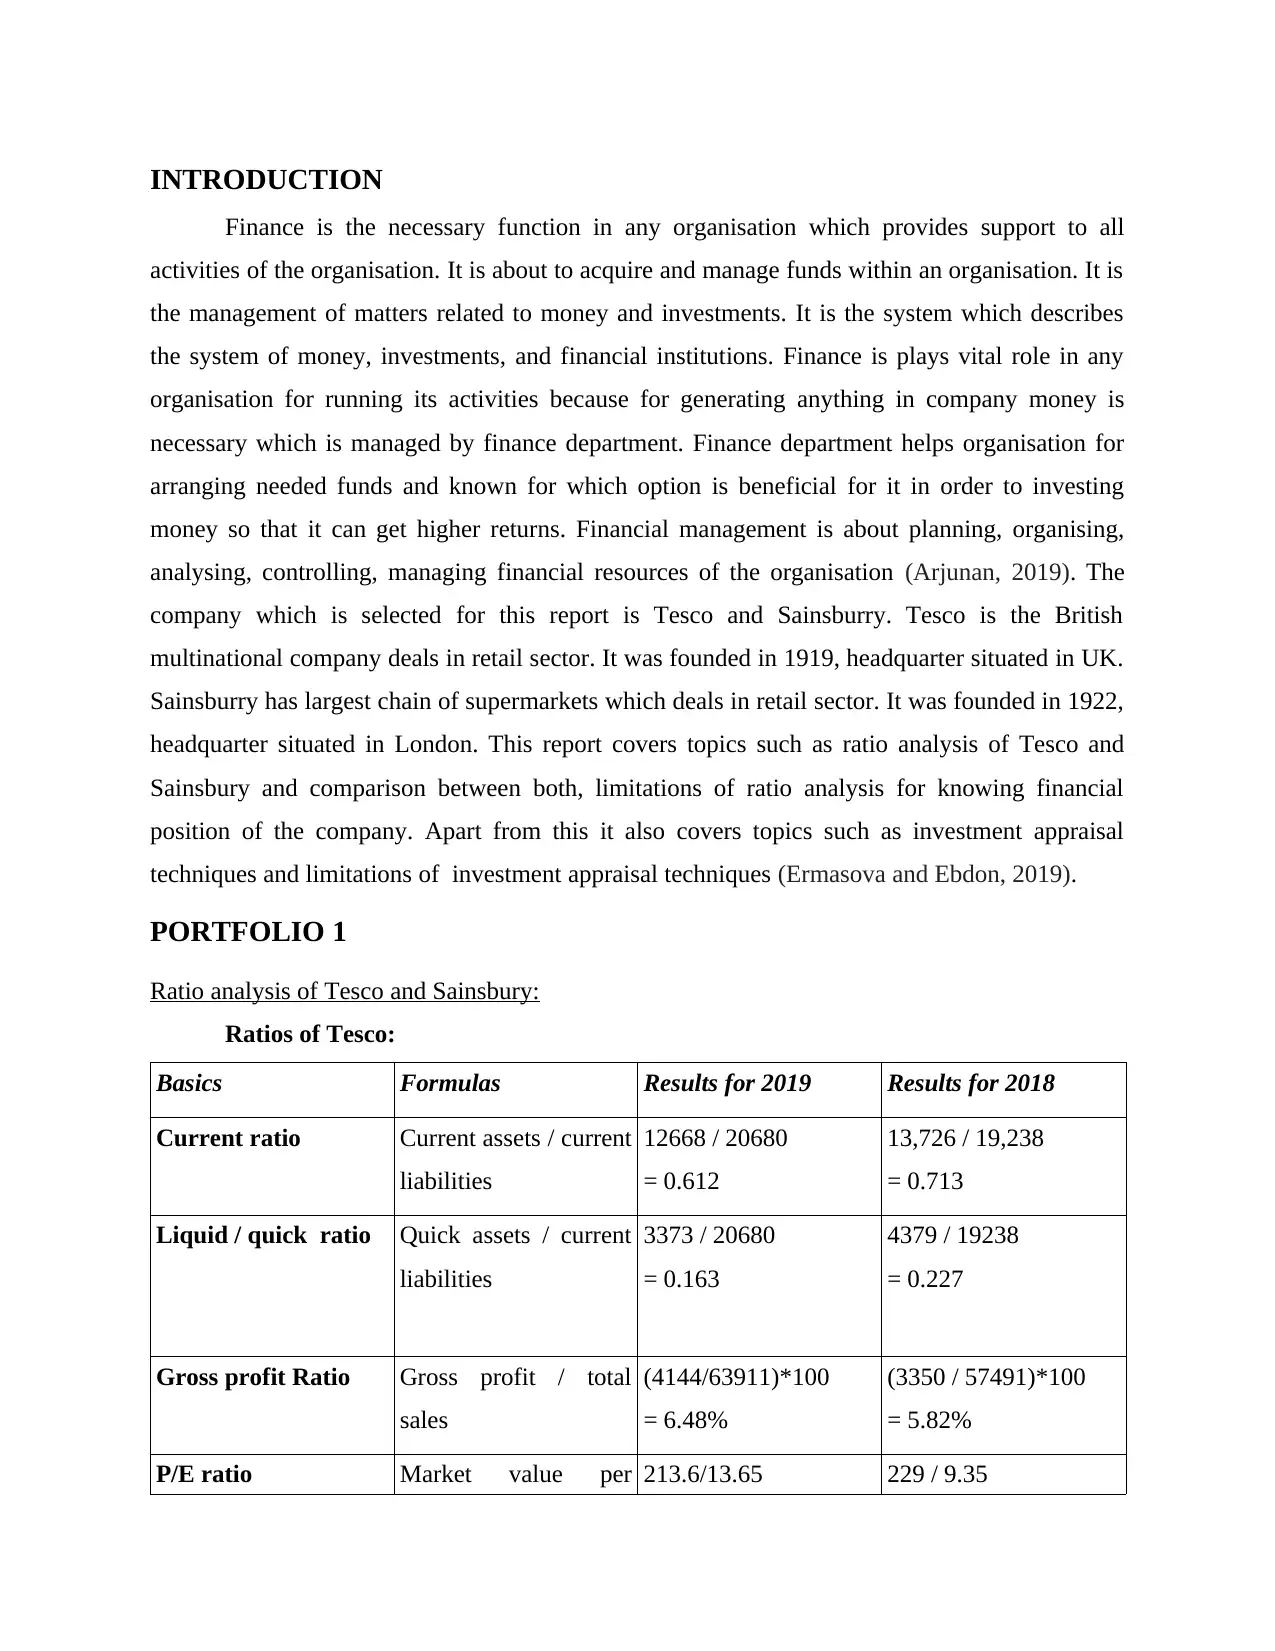
Ratio analysis of Tesco and Sainsbury:
Ratios of Tesco:
Basics Formulas Results for 2019 Results for 2018
Current ratio Current assets / current
liabilities
12668 / 20680
= 0.612
13,726 / 19,238
= 0.713
Liquid / quick ratio Quick assets / current
liabilities
3373 / 20680
= 0.163
4379 / 19238
= 0.227
Gross profit Ratio Gross profit / total
sales
(4144/63911)*100
= 6.48%
(3350 / 57491)*100
= 5.82%
P/E ratio Market value per 213.6/13.65 229 / 9.35
Finance is the necessary function in any organisation which provides support to all
activities of the organisation. It is about to acquire and manage funds within an organisation. It is
the management of matters related to money and investments. It is the system which describes
the system of money, investments, and financial institutions. Finance is plays vital role in any
organisation for running its activities because for generating anything in company money is
necessary which is managed by finance department. Finance department helps organisation for
arranging needed funds and known for which option is beneficial for it in order to investing
money so that it can get higher returns. Financial management is about planning, organising,
analysing, controlling, managing financial resources of the organisation (Arjunan, 2019). The
company which is selected for this report is Tesco and Sainsburry. Tesco is the British
multinational company deals in retail sector. It was founded in 1919, headquarter situated in UK.
Sainsburry has largest chain of supermarkets which deals in retail sector. It was founded in 1922,
headquarter situated in London. This report covers topics such as ratio analysis of Tesco and
Sainsbury and comparison between both, limitations of ratio analysis for knowing financial
position of the company. Apart from this it also covers topics such as investment appraisal
techniques and limitations of investment appraisal techniques (Ermasova and Ebdon, 2019).
PORTFOLIO 1
Ratio analysis of Tesco and Sainsbury:
Ratios of Tesco:
Basics Formulas Results for 2019 Results for 2018
Current ratio Current assets / current
liabilities
12668 / 20680
= 0.612
13,726 / 19,238
= 0.713
Liquid / quick ratio Quick assets / current
liabilities
3373 / 20680
= 0.163
4379 / 19238
= 0.227
Gross profit Ratio Gross profit / total
sales
(4144/63911)*100
= 6.48%
(3350 / 57491)*100
= 5.82%
P/E ratio Market value per 213.6/13.65 229 / 9.35
⊘ This is a preview!⊘
Do you want full access?
Subscribe today to unlock all pages.
Trusted by 1+ million students worldwide
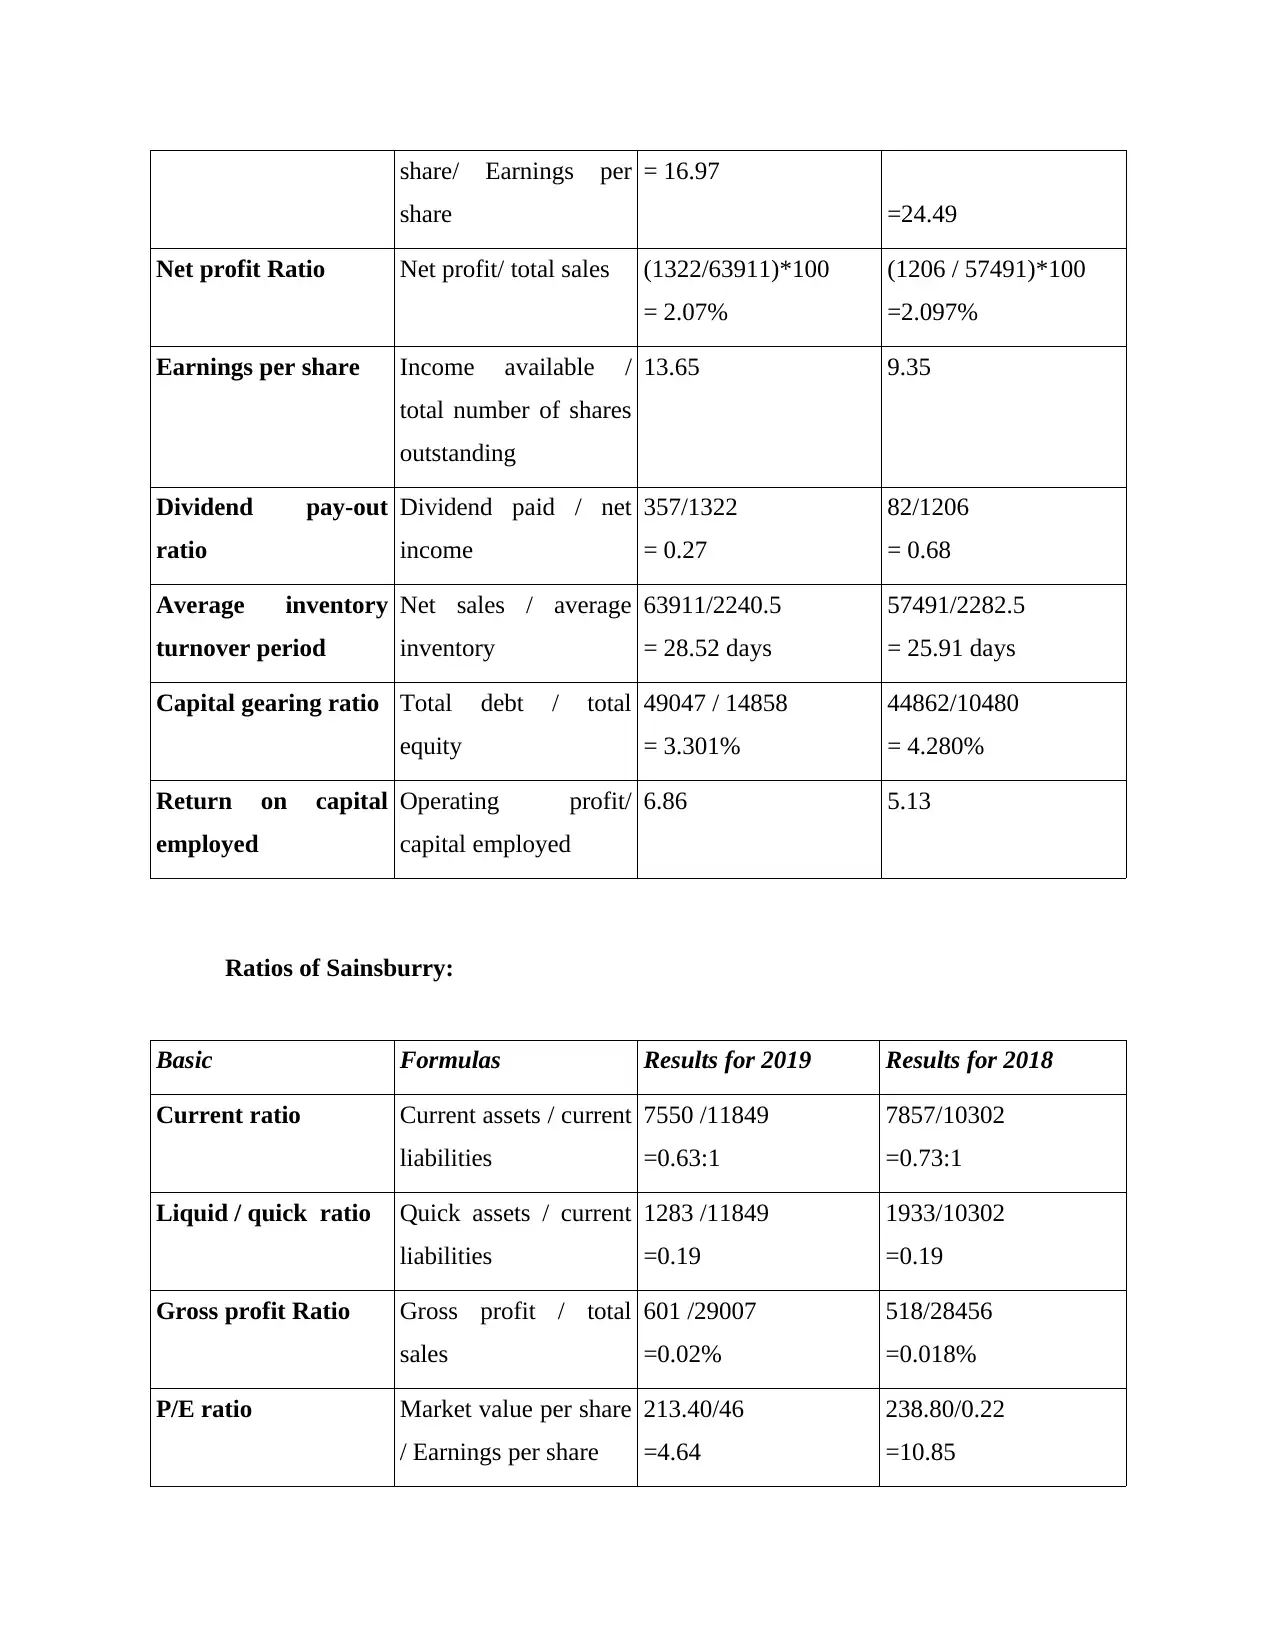
share/ Earnings per
share
= 16.97
=24.49
Net profit Ratio Net profit/ total sales (1322/63911)*100
= 2.07%
(1206 / 57491)*100
=2.097%
Earnings per share Income available /
total number of shares
outstanding
13.65 9.35
Dividend pay-out
ratio
Dividend paid / net
income
357/1322
= 0.27
82/1206
= 0.68
Average inventory
turnover period
Net sales / average
inventory
63911/2240.5
= 28.52 days
57491/2282.5
= 25.91 days
Capital gearing ratio Total debt / total
equity
49047 / 14858
= 3.301%
44862/10480
= 4.280%
Return on capital
employed
Operating profit/
capital employed
6.86 5.13
Ratios of Sainsburry:
Basic Formulas Results for 2019 Results for 2018
Current ratio Current assets / current
liabilities
7550 /11849
=0.63:1
7857/10302
=0.73:1
Liquid / quick ratio Quick assets / current
liabilities
1283 /11849
=0.19
1933/10302
=0.19
Gross profit Ratio Gross profit / total
sales
601 /29007
=0.02%
518/28456
=0.018%
P/E ratio Market value per share
/ Earnings per share
213.40/46
=4.64
238.80/0.22
=10.85
Paraphrase This Document
Need a fresh take? Get an instant paraphrase of this document with our AI Paraphraser
Net profit Ratio Net profit / total sales 186/29007
=0.006%
309/28456
=0.11%
Earnings per share Income available /
total number of shares
outstanding
46 22
Dividend pay-out
ratio
Dividend paid / net
income
247/186
=1.33
235/309
=0.76
Capital gearing ratio Total debt / total
equity
97.75 34.44
Average inventory
turnover period
Net sales / average
inventory
29007/1869.5
=15.51 days
28456/1792.5
=15.87 days
Return on capital
employed
Operating profit/
capital employed
3.84 4.65
Comparison of Tesco and Sainsbury by interpretation:
Interpretation of Ratios of Tesco and Sainsburry:
Ratio analysis is the Process of analysing financial position of the company which
includes liquidity, solvency and profitability ratios (Gafli and Daryanto, 2019). It helps Tesco
and Sainsburry to compare its actual performance from its actual performance. The comparison
of both companies are mentioned below:
Current ratio: Current ratio is related to difference of current assets and current
liabilities. It is also called as working capital ratio because it involves current liabilities
and current assets. Current ratio helps business for knowing liquidity of the company. It
tells company's efficiency in order to pay its short term debts. It is about how company
utilise its resources so that it can pay its short term debts. The good ratio is 2:1, higher the
ratio shows higher capacity of company. In comparison to Tesco and Sainsburry it shows
Sainsburry has higher liquidity than Tesco because in Both year it has higher ratios. This
shows Sainsburry has using its resources properly so that it can manage its daily activities
and pay short term liabilities.
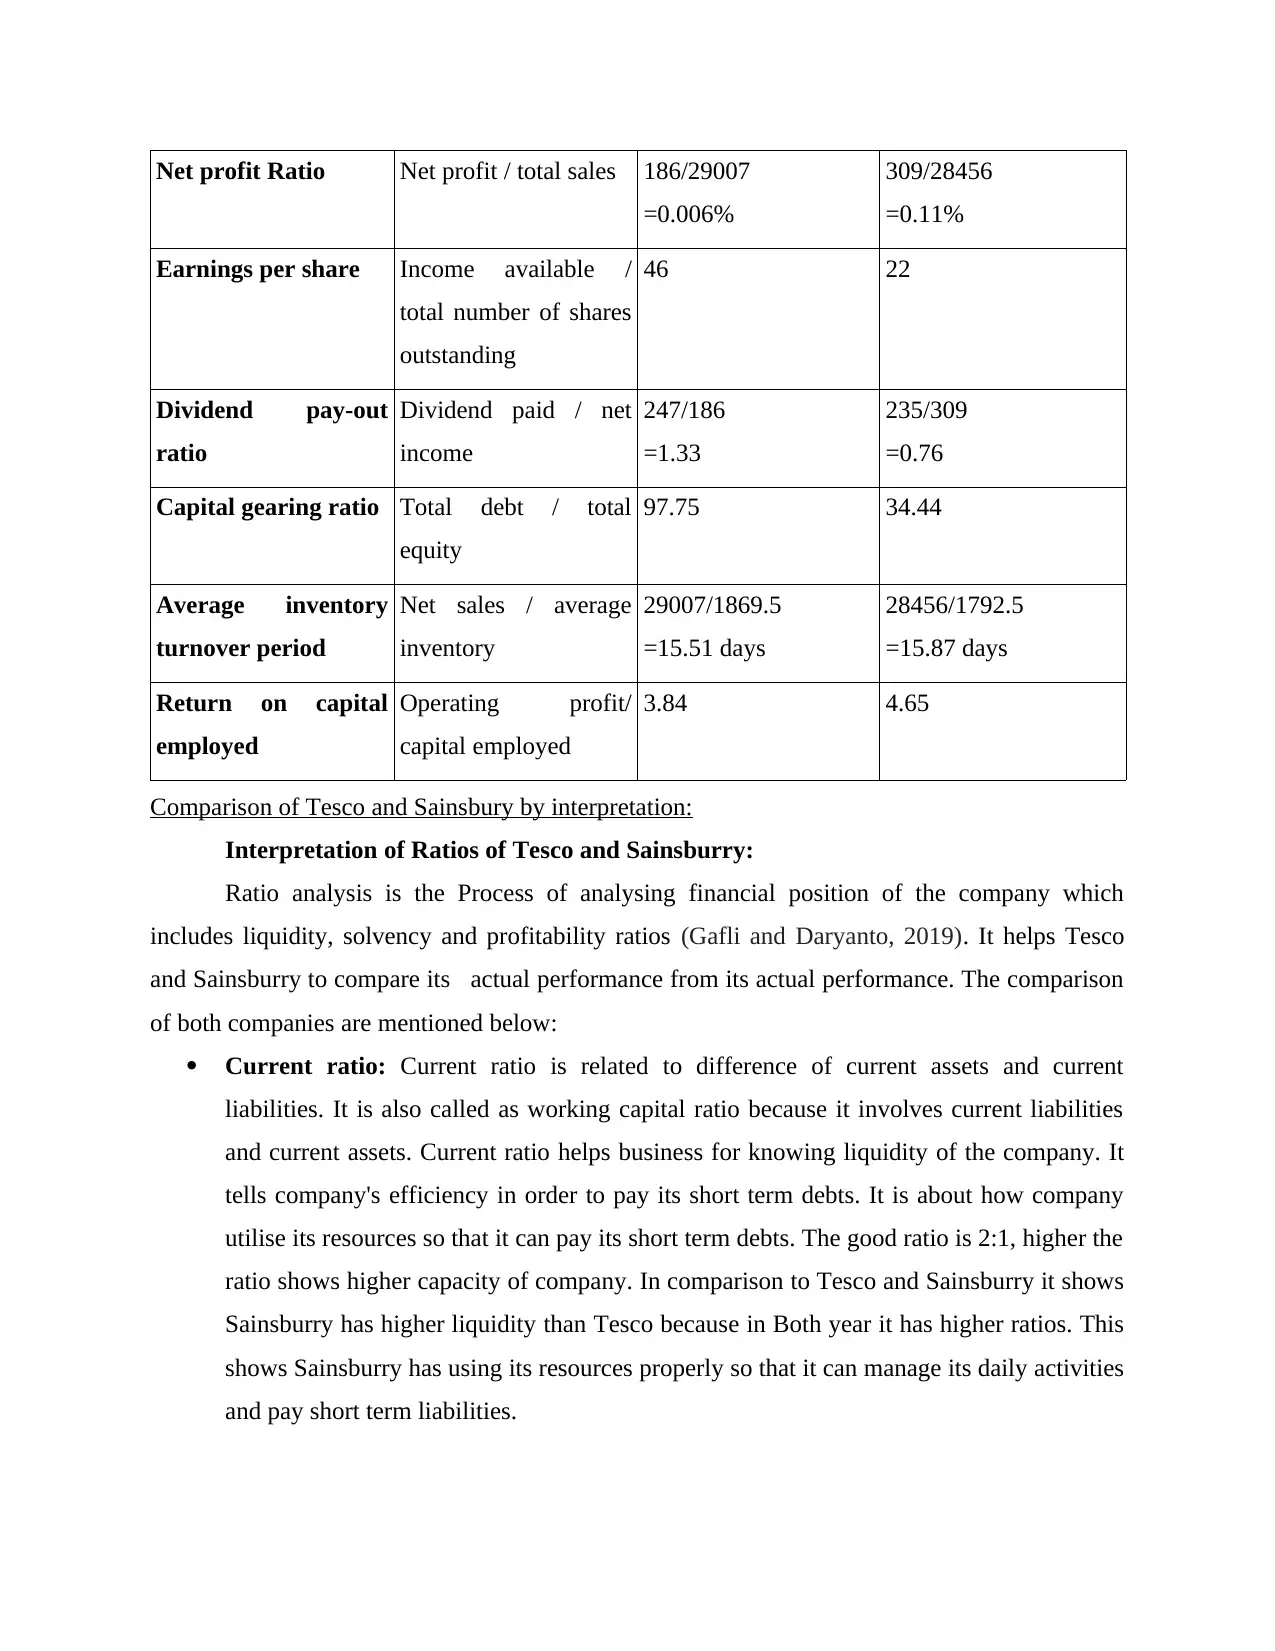
Gross profit ratio: Gross profit ratio shows relation between gross profit and net sales of
the company. As it is calculated by dividing gross profits from net sales. Gross profits
includes cost of goods sold and sales it is calculate as subtraction of cost of goods sold
from net sales. The higher the ratio shows higher profitability which leads to increase in
net profits (Hedianto and Daryanto, 2019). The ideal gross profit for the retail business
should be 25% . in context to Tesco, it shows 5.82% in year 2018 and that was increase
by 6.48% for the year 2019. in context to Sainsburry it shows 0.018 % for 2018 which
was increased by 0.02% for the year. As per the above calculation Tesco has higher and
efficient performance in order to control its costs than Sainsburry.
⊘ This is a preview!⊘
Do you want full access?
Subscribe today to unlock all pages.
Trusted by 1+ million students worldwide
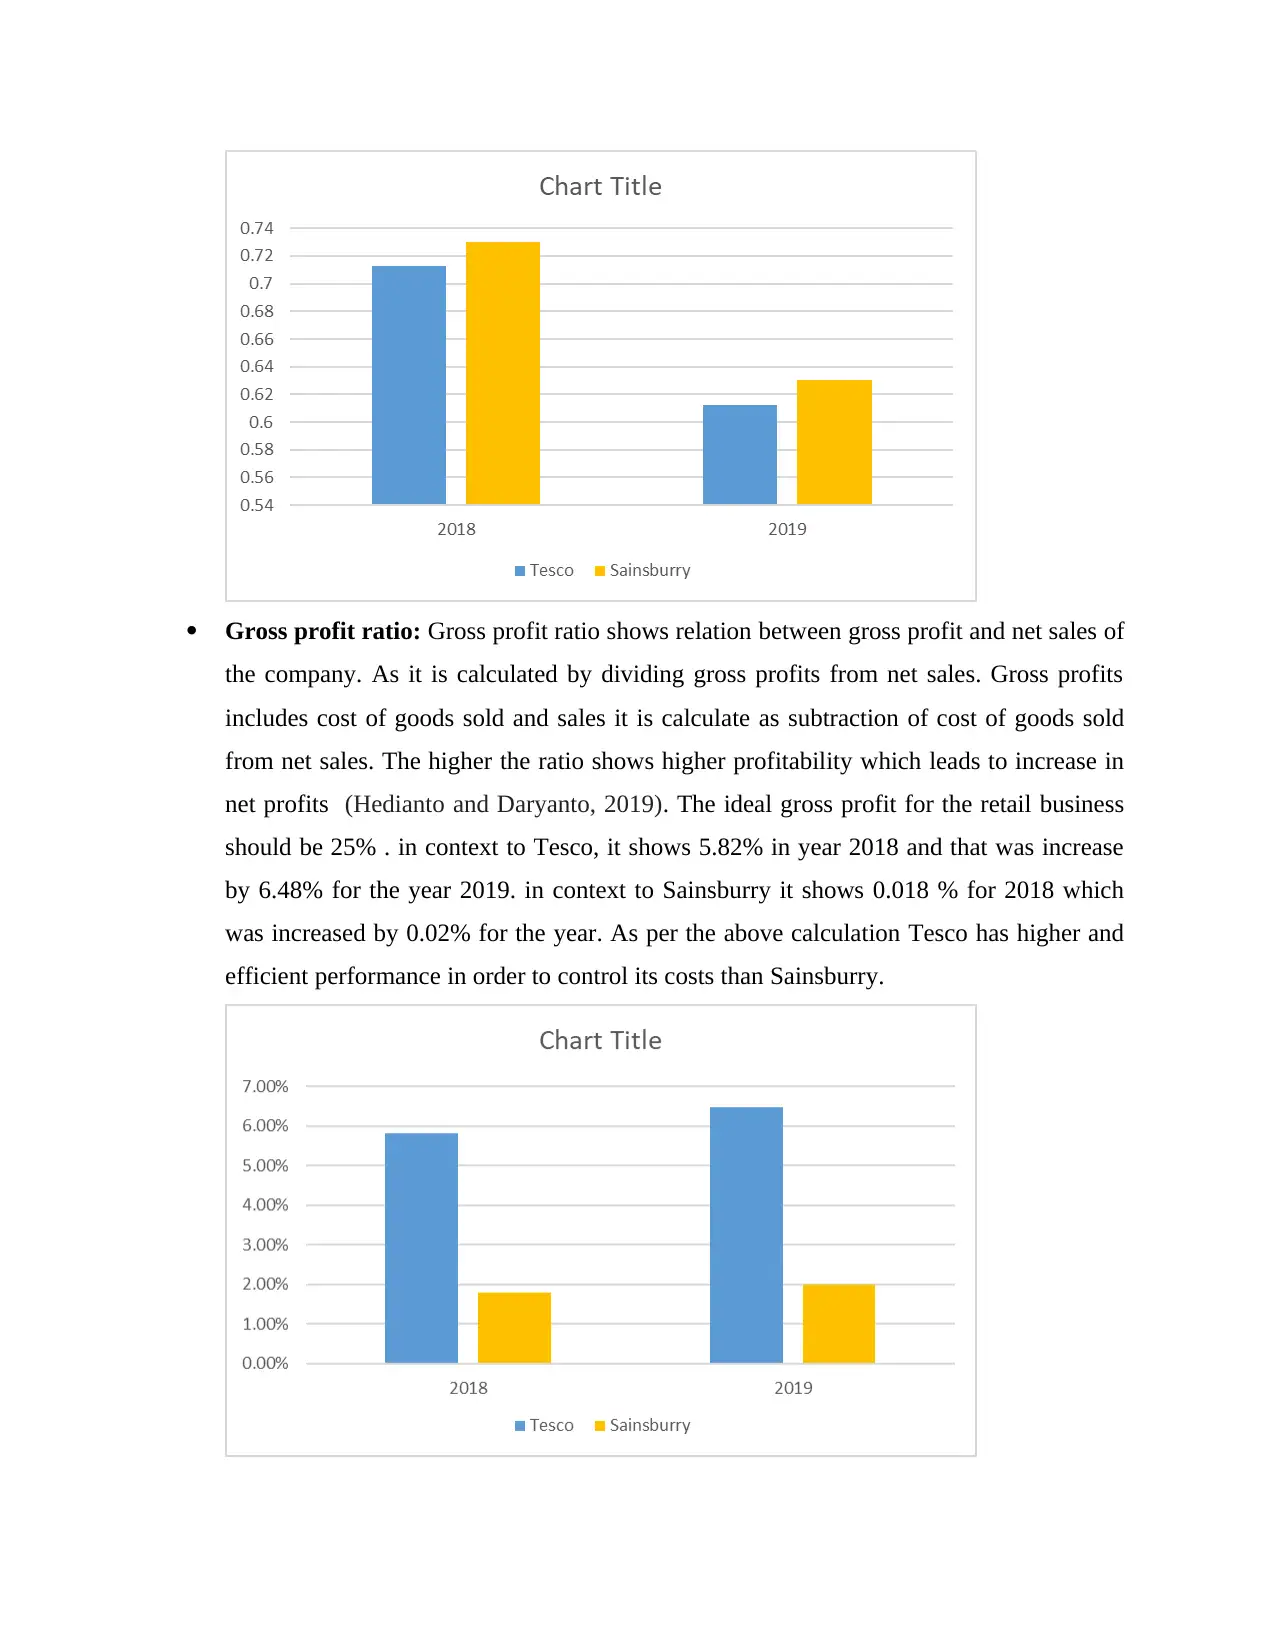
Net profit ratio: Net profit ratio refers to relation between net profits and net sales of the
company. It is also known as profit after tax, depreciation and interest. The good ratio
known for the retail company is 10%. higher the net profit shows higher income of the
company which is earn by after subtracting all expenses. It shows the efficiency of
company for utilising its resources because it shows net income earns by company. In
context to Tesco and Sainsburry, the net profit earned by the Tesco is higher than
Sainsburry which shows higher income and efficiency to manage its expenses.
Quick ratio: It is also known as liquid ratio which is calculated by liquid assets. It shows
relation between liquid assets and current liabilities. Liquid assets refers to current assets
by subtracting stock and prepaid expenses. Quick ratio shows cash and back balance of
the company which is liquid as per the requirement it can use. Higher the liquidity shows
firms efficiency for collecting payment from customers and pay to short term debts. As
per the Tesco and Sainsburry the Quick ratio for the Tesco in year 2018 shows 0.22%
which was decreased by 0.16% in year 2019. In context to Sainsburry it shows 0.19 for
the both year 2018 and 2019. as per the above data it shows better performance of
Sainsburry because it maintain its liquidity efficiently in both year but in 2019 Tesco was
decreased its efficiency (Lingesiya, 2017).
Paraphrase This Document
Need a fresh take? Get an instant paraphrase of this document with our AI Paraphraser
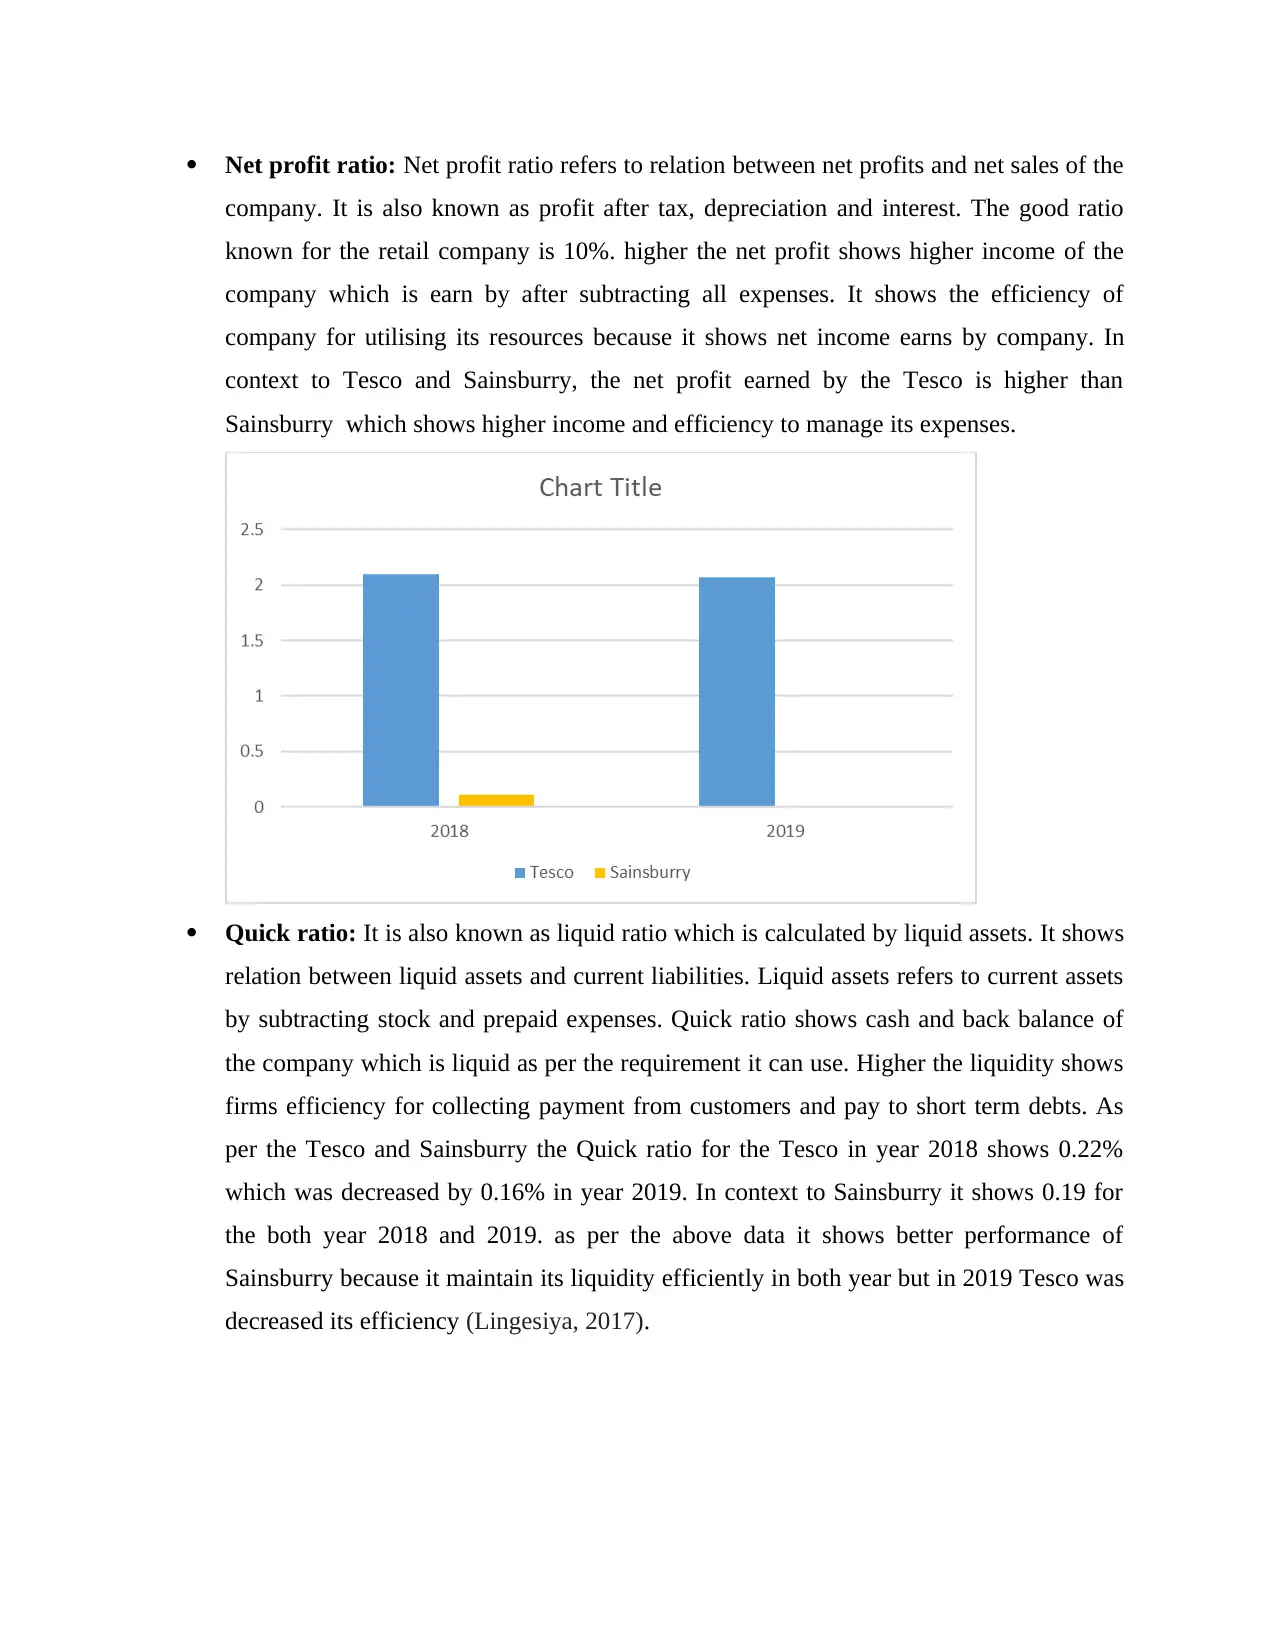
P/E ratio: Price earning ratio shows value of the shares of the company which market is
willing to pay. The higher the price of the shares refers to higher earnings for the
company. In context to Tesco and Sainsburry, it shows Tesco has less share price than
Sainsburry which shows its less value in the market. As per the above calculation for the
Tesco it shows 24.49 for the year 2018 and 16.97 for the year 2019. for the Sainsburry it
shows 10.85 in year 2018 and 4.64 in year 2019 (Mendes-Da-Silva and Saito, 2019).
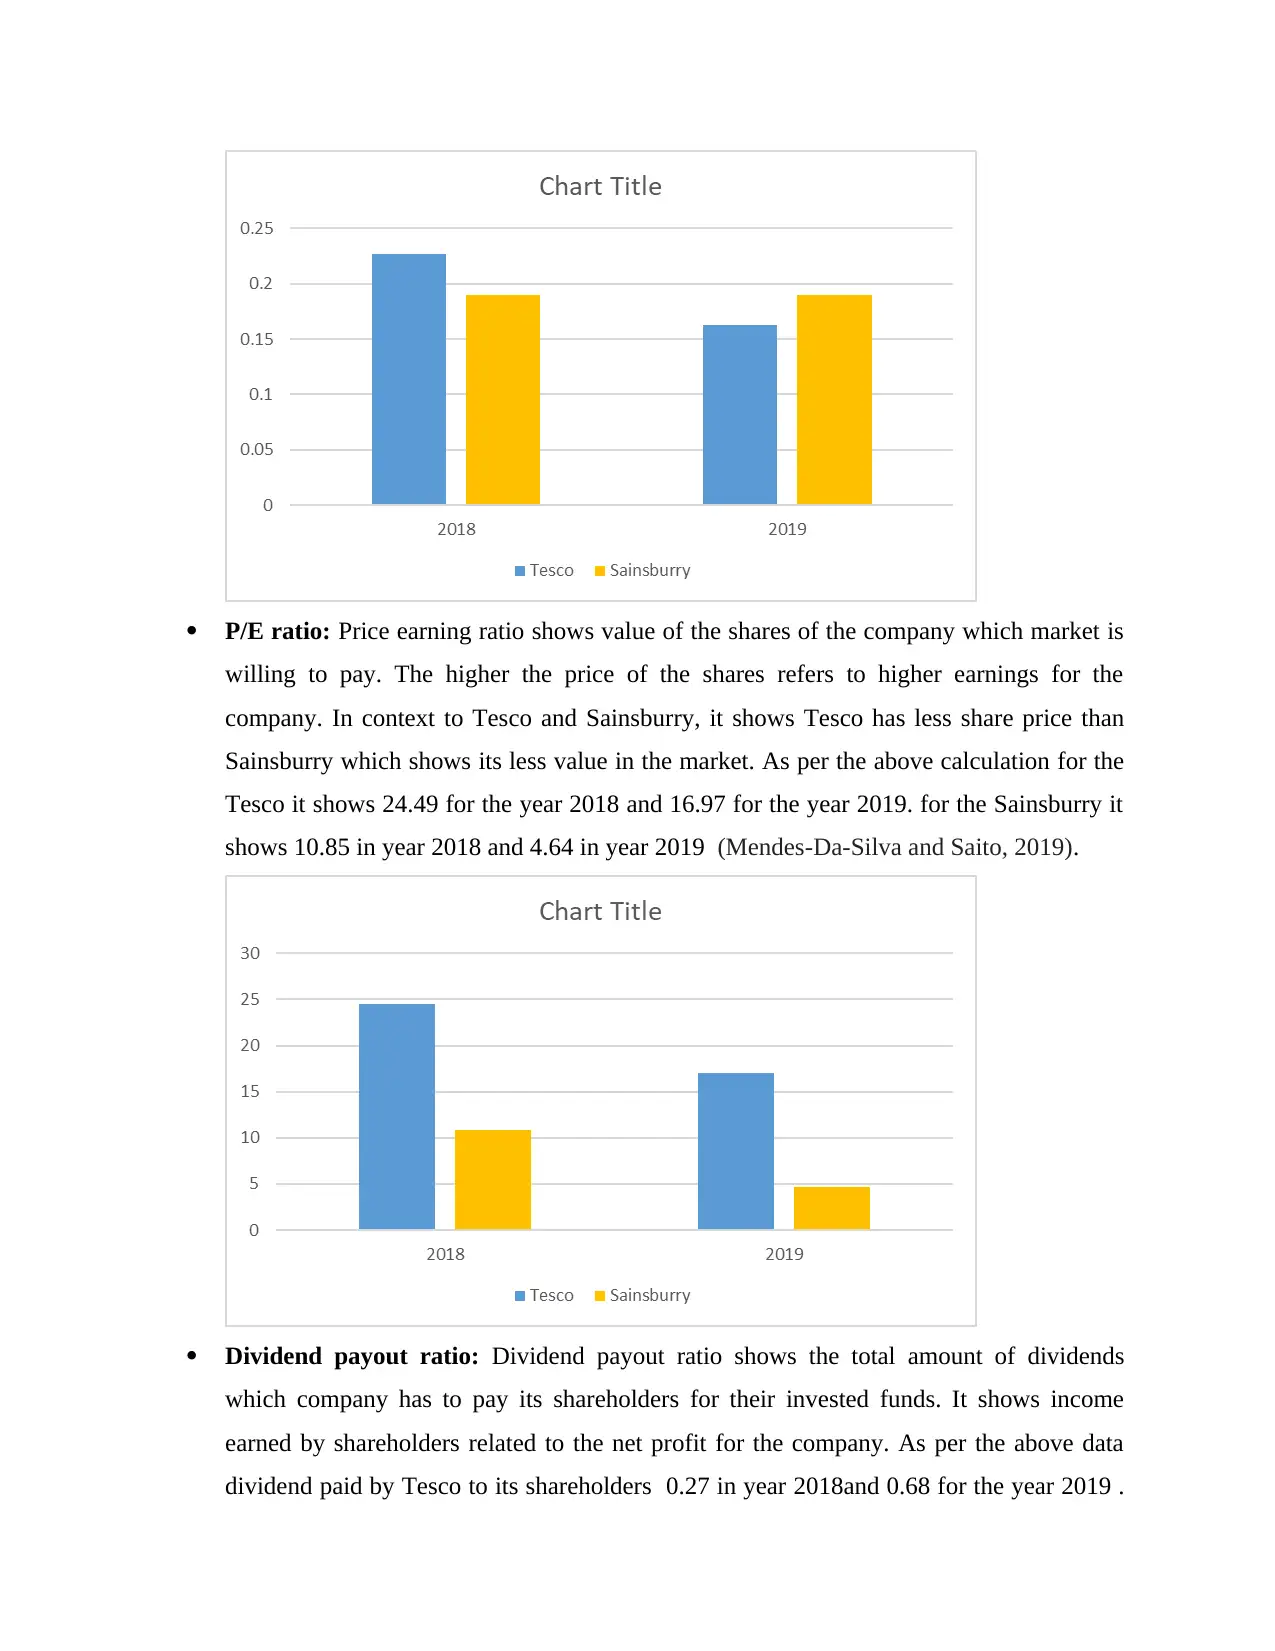
Dividend payout ratio: Dividend payout ratio shows the total amount of dividends
which company has to pay its shareholders for their invested funds. It shows income
earned by shareholders related to the net profit for the company. As per the above data
dividend paid by Tesco to its shareholders 0.27 in year 2018and 0.68 for the year 2019 .
willing to pay. The higher the price of the shares refers to higher earnings for the
company. In context to Tesco and Sainsburry, it shows Tesco has less share price than
Sainsburry which shows its less value in the market. As per the above calculation for the
Tesco it shows 24.49 for the year 2018 and 16.97 for the year 2019. for the Sainsburry it
shows 10.85 in year 2018 and 4.64 in year 2019 (Mendes-Da-Silva and Saito, 2019).
Dividend payout ratio: Dividend payout ratio shows the total amount of dividends
which company has to pay its shareholders for their invested funds. It shows income
earned by shareholders related to the net profit for the company. As per the above data
dividend paid by Tesco to its shareholders 0.27 in year 2018and 0.68 for the year 2019 .
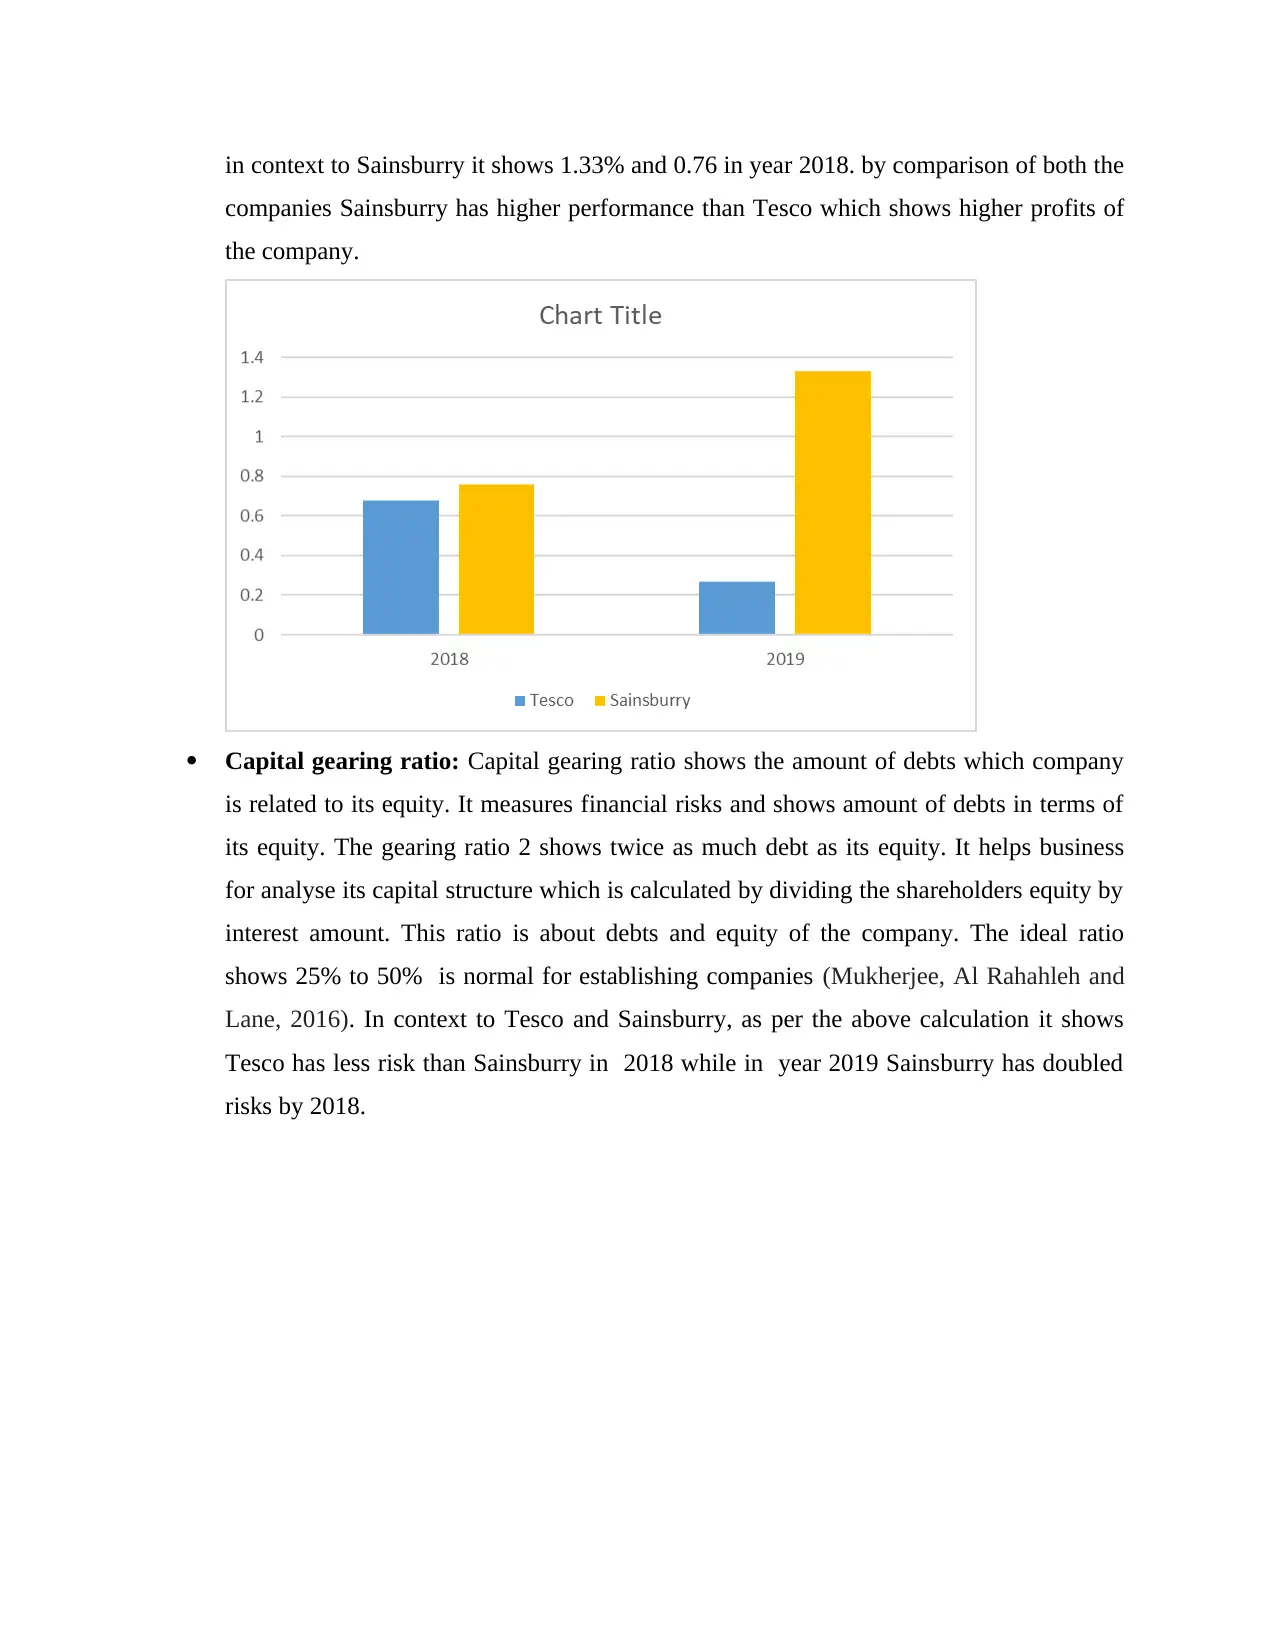
in context to Sainsburry it shows 1.33% and 0.76 in year 2018. by comparison of both the
companies Sainsburry has higher performance than Tesco which shows higher profits of
the company.
Capital gearing ratio: Capital gearing ratio shows the amount of debts which company
is related to its equity. It measures financial risks and shows amount of debts in terms of
its equity. The gearing ratio 2 shows twice as much debt as its equity. It helps business
for analyse its capital structure which is calculated by dividing the shareholders equity by
interest amount. This ratio is about debts and equity of the company. The ideal ratio
shows 25% to 50% is normal for establishing companies (Mukherjee, Al Rahahleh and
Lane, 2016). In context to Tesco and Sainsburry, as per the above calculation it shows
Tesco has less risk than Sainsburry in 2018 while in year 2019 Sainsburry has doubled
risks by 2018.
⊘ This is a preview!⊘
Do you want full access?
Subscribe today to unlock all pages.
Trusted by 1+ million students worldwide
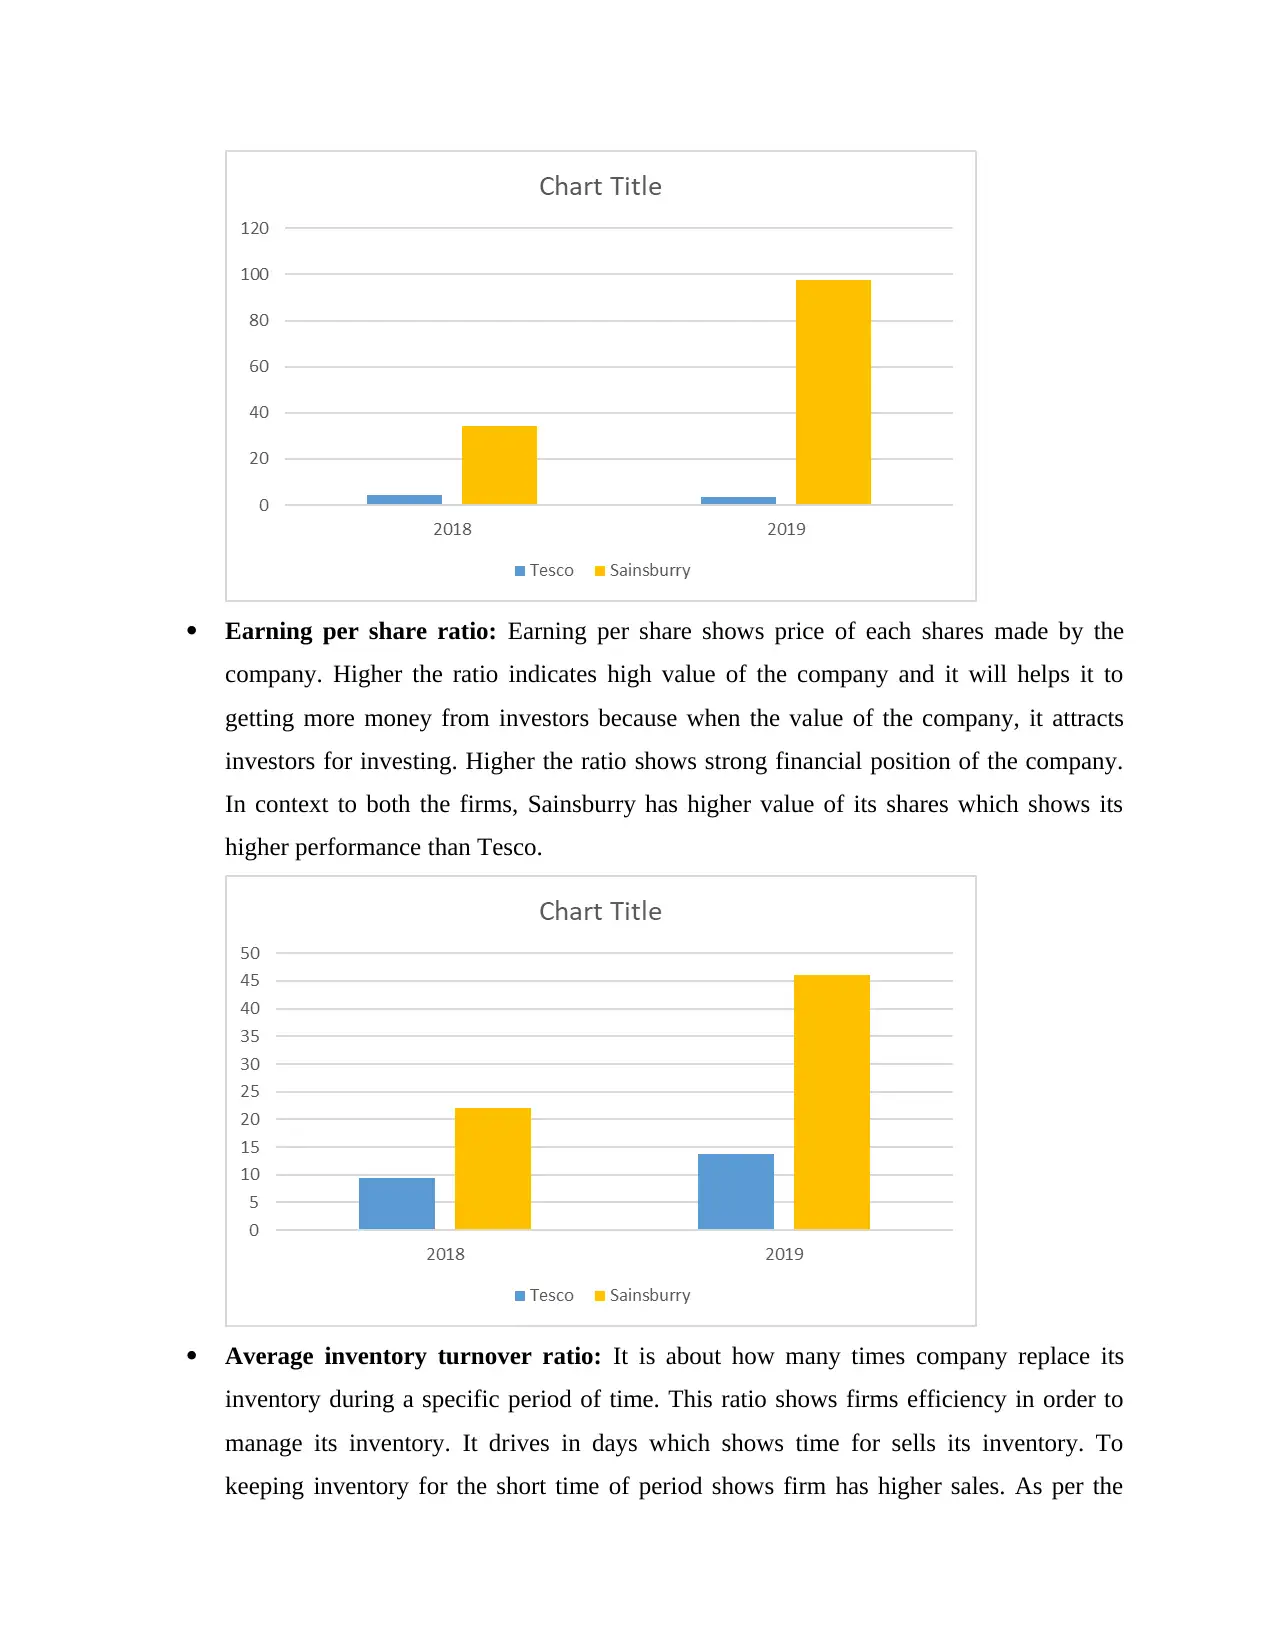
Earning per share ratio: Earning per share shows price of each shares made by the
company. Higher the ratio indicates high value of the company and it will helps it to
getting more money from investors because when the value of the company, it attracts
investors for investing. Higher the ratio shows strong financial position of the company.
In context to both the firms, Sainsburry has higher value of its shares which shows its
higher performance than Tesco.
Average inventory turnover ratio: It is about how many times company replace its
inventory during a specific period of time. This ratio shows firms efficiency in order to
manage its inventory. It drives in days which shows time for sells its inventory. To
keeping inventory for the short time of period shows firm has higher sales. As per the
Paraphrase This Document
Need a fresh take? Get an instant paraphrase of this document with our AI Paraphraser
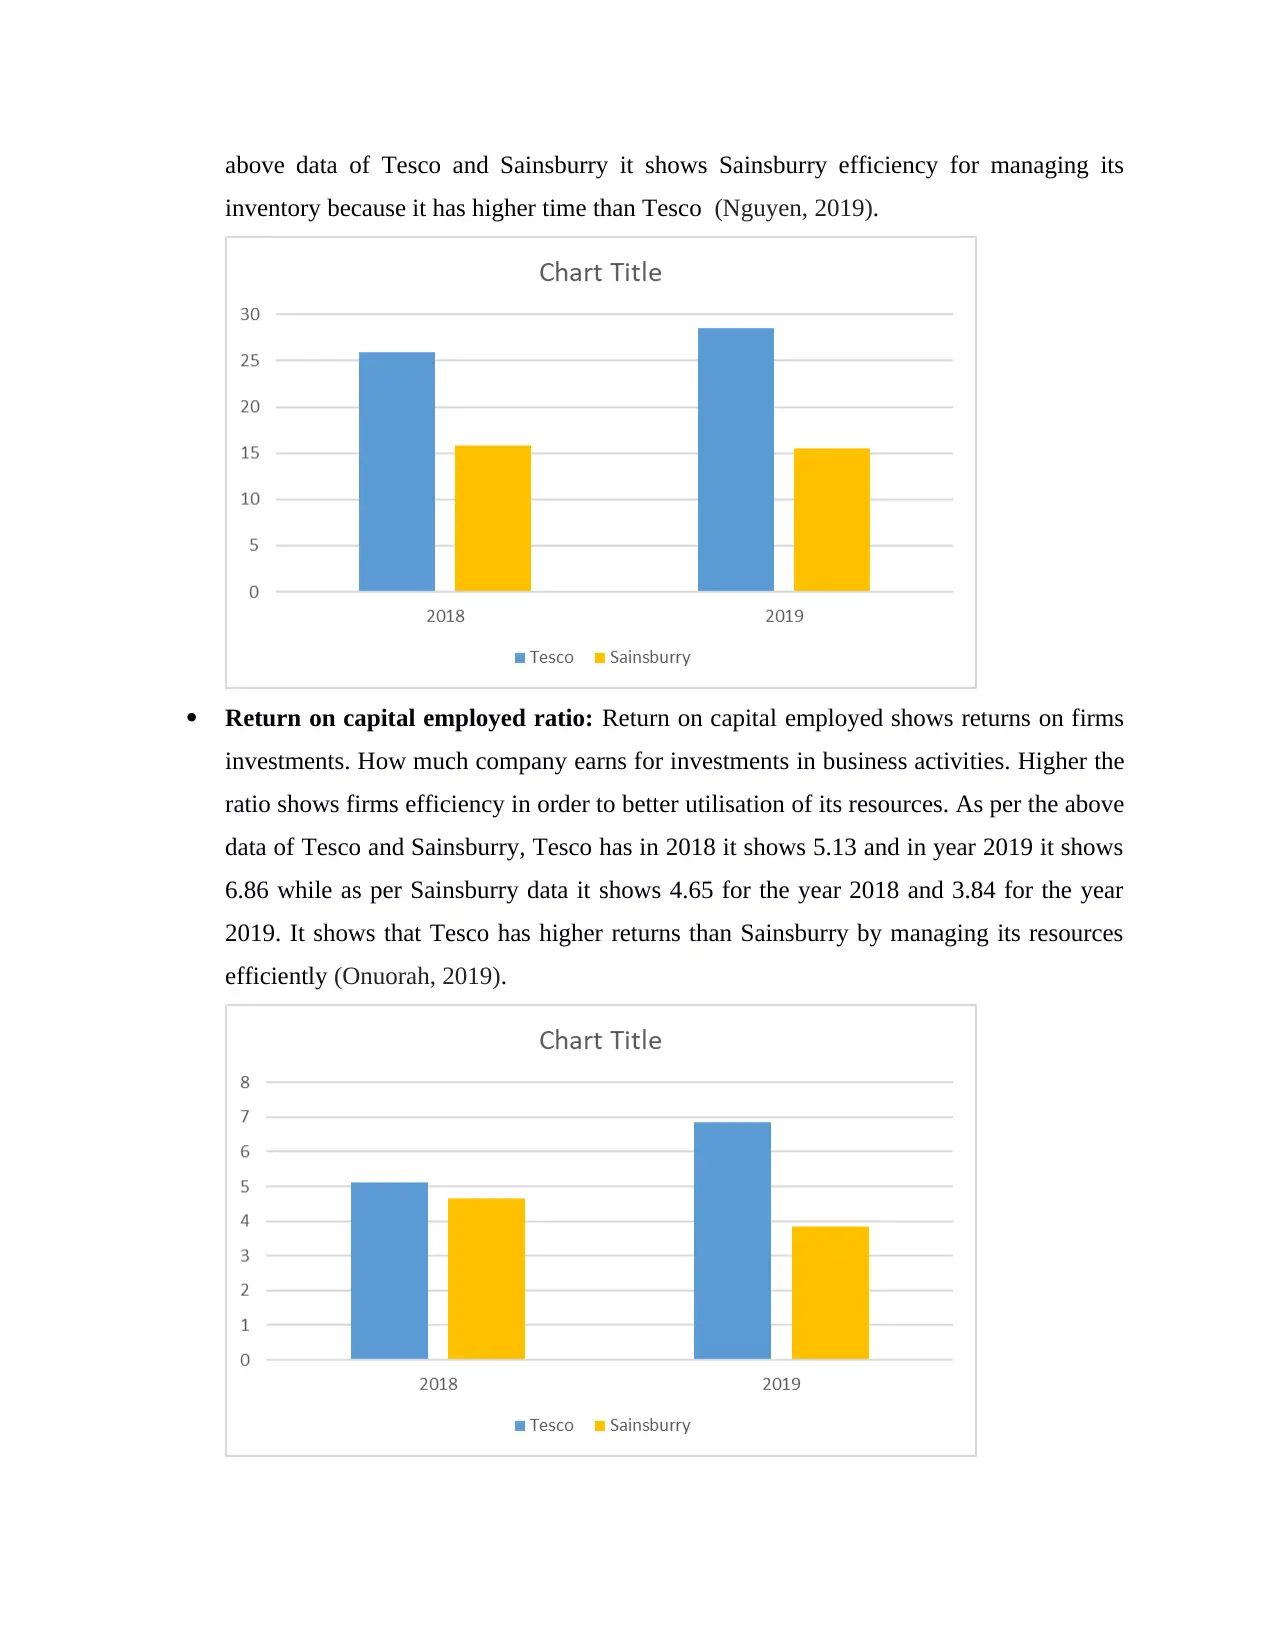
above data of Tesco and Sainsburry it shows Sainsburry efficiency for managing its
inventory because it has higher time than Tesco (Nguyen, 2019).
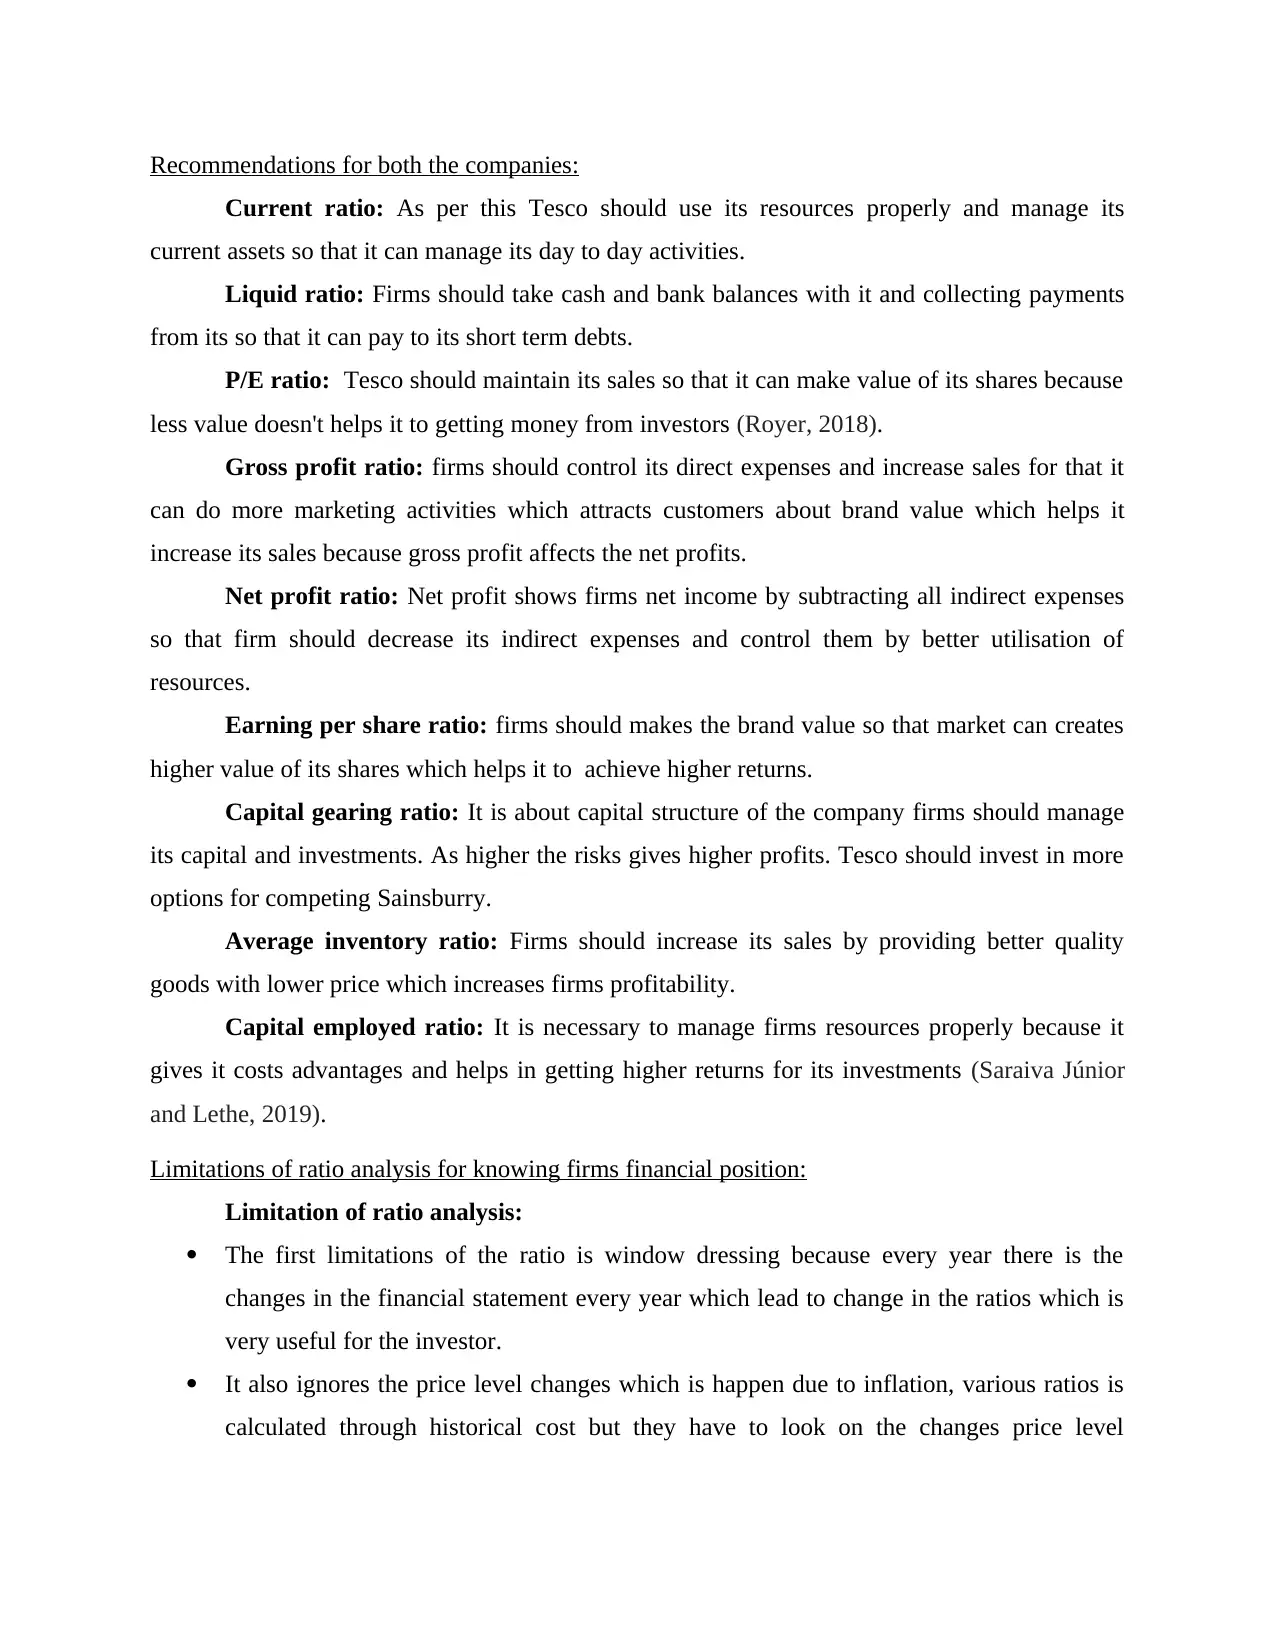
Return on capital employed ratio: Return on capital employed shows returns on firms
investments. How much company earns for investments in business activities. Higher the
ratio shows firms efficiency in order to better utilisation of its resources. As per the above
data of Tesco and Sainsburry, Tesco has in 2018 it shows 5.13 and in year 2019 it shows
6.86 while as per Sainsburry data it shows 4.65 for the year 2018 and 3.84 for the year
2019. It shows that Tesco has higher returns than Sainsburry by managing its resources
efficiently (Onuorah, 2019).
inventory because it has higher time than Tesco (Nguyen, 2019).
Return on capital employed ratio: Return on capital employed shows returns on firms
investments. How much company earns for investments in business activities. Higher the
ratio shows firms efficiency in order to better utilisation of its resources. As per the above
data of Tesco and Sainsburry, Tesco has in 2018 it shows 5.13 and in year 2019 it shows
6.86 while as per Sainsburry data it shows 4.65 for the year 2018 and 3.84 for the year
2019. It shows that Tesco has higher returns than Sainsburry by managing its resources
efficiently (Onuorah, 2019).
Recommendations for both the companies:
Current ratio: As per this Tesco should use its resources properly and manage its
current assets so that it can manage its day to day activities.
Liquid ratio: Firms should take cash and bank balances with it and collecting payments
from its so that it can pay to its short term debts.
P/E ratio: Tesco should maintain its sales so that it can make value of its shares because
less value doesn't helps it to getting money from investors (Royer, 2018).
Gross profit ratio: firms should control its direct expenses and increase sales for that it
can do more marketing activities which attracts customers about brand value which helps it
increase its sales because gross profit affects the net profits.
Net profit ratio: Net profit shows firms net income by subtracting all indirect expenses
so that firm should decrease its indirect expenses and control them by better utilisation of
resources.
Earning per share ratio: firms should makes the brand value so that market can creates
higher value of its shares which helps it to achieve higher returns.
Capital gearing ratio: It is about capital structure of the company firms should manage
its capital and investments. As higher the risks gives higher profits. Tesco should invest in more
options for competing Sainsburry.
Average inventory ratio: Firms should increase its sales by providing better quality
goods with lower price which increases firms profitability.
Capital employed ratio: It is necessary to manage firms resources properly because it
gives it costs advantages and helps in getting higher returns for its investments (Saraiva Júnior
and Lethe, 2019).
Limitations of ratio analysis for knowing firms financial position:
Limitation of ratio analysis:
The first limitations of the ratio is window dressing because every year there is the
changes in the financial statement every year which lead to change in the ratios which is
very useful for the investor.
It also ignores the price level changes which is happen due to inflation, various ratios is
calculated through historical cost but they have to look on the changes price level
⊘ This is a preview!⊘
Do you want full access?
Subscribe today to unlock all pages.
Trusted by 1+ million students worldwide
1 out of 16
Related Documents


Your All-in-One AI-Powered Toolkit for Academic Success.
+13062052269
info@desklib.com
Available 24*7 on WhatsApp / Email
![[object Object]](/_next/static/media/star-bottom.7253800d.svg)
Unlock your academic potential
Copyright © 2020–2026 A2Z Services. All Rights Reserved. Developed and managed by ZUCOL.