Managerial Finance Report: Ratio Analysis and Capital Budgeting
VerifiedAdded on 2022/12/30
|25
|3875
|83
Report
AI Summary
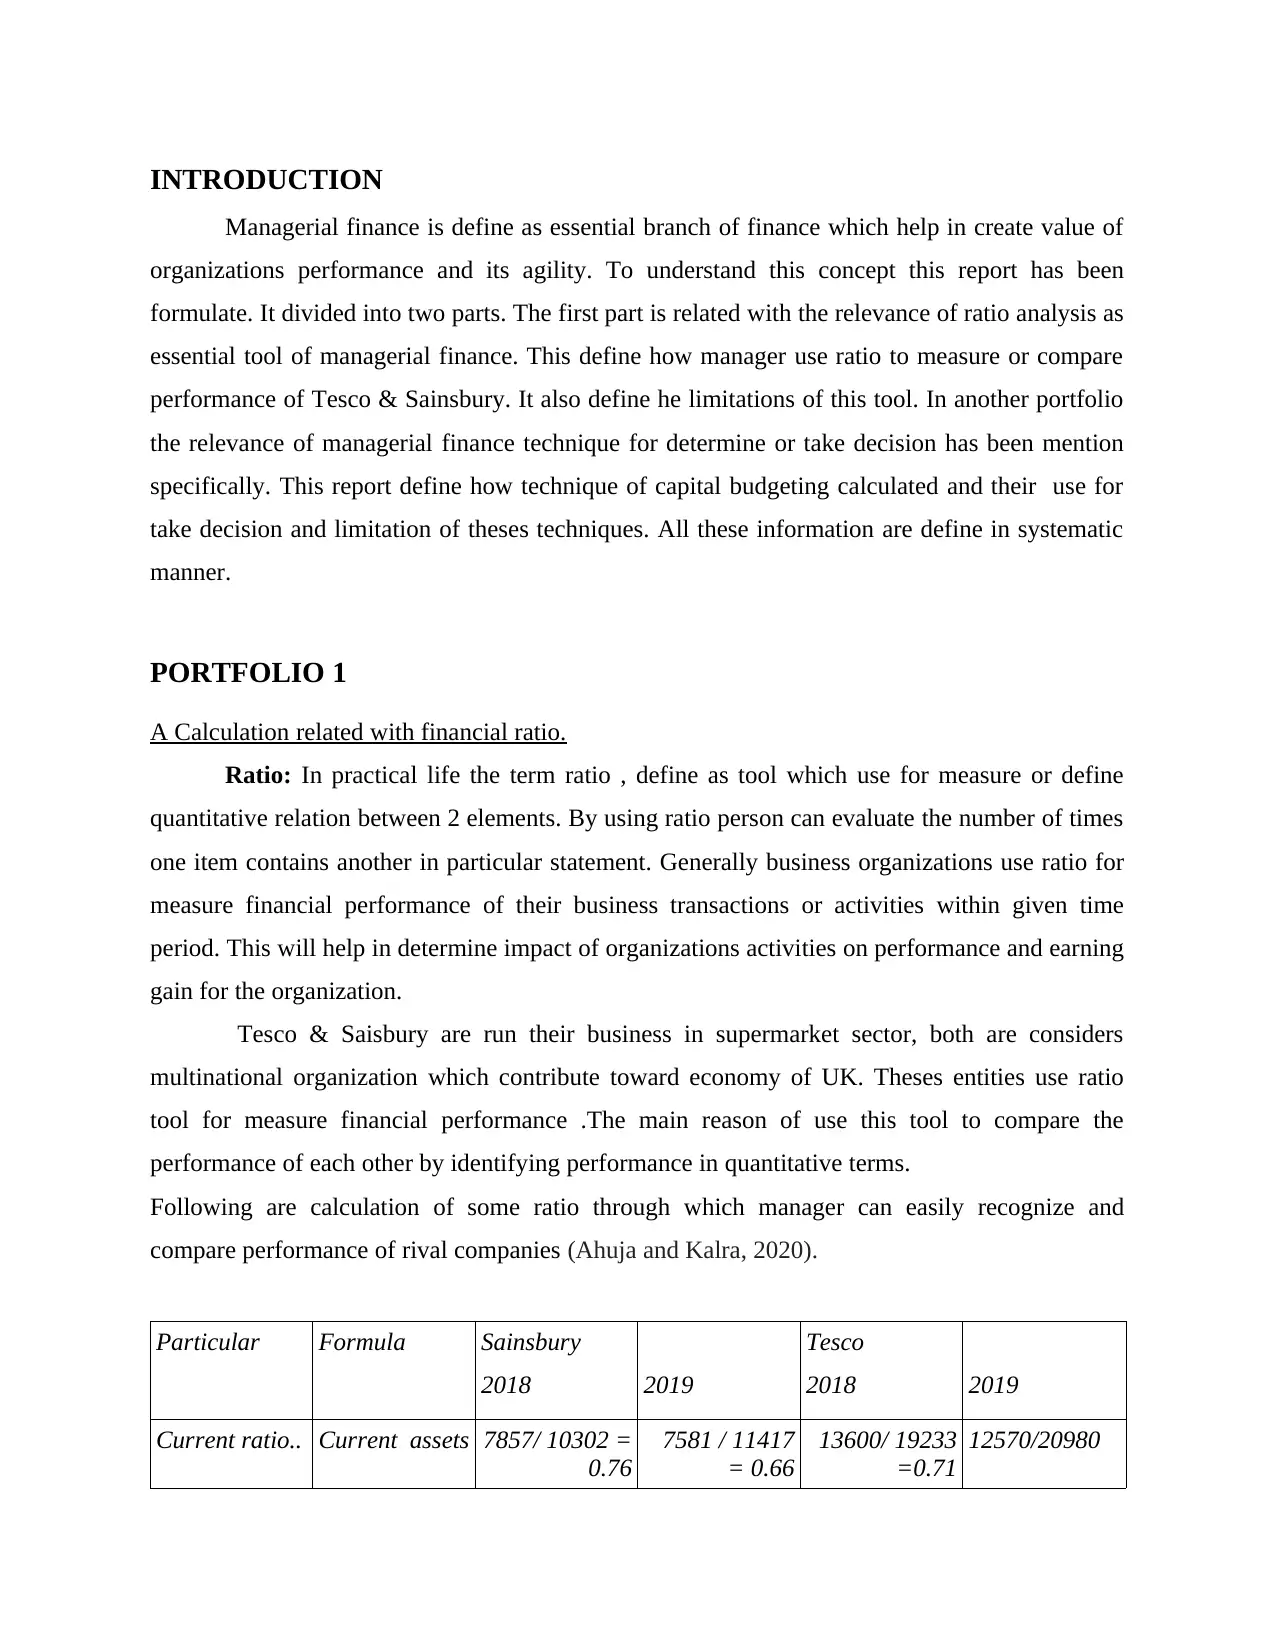
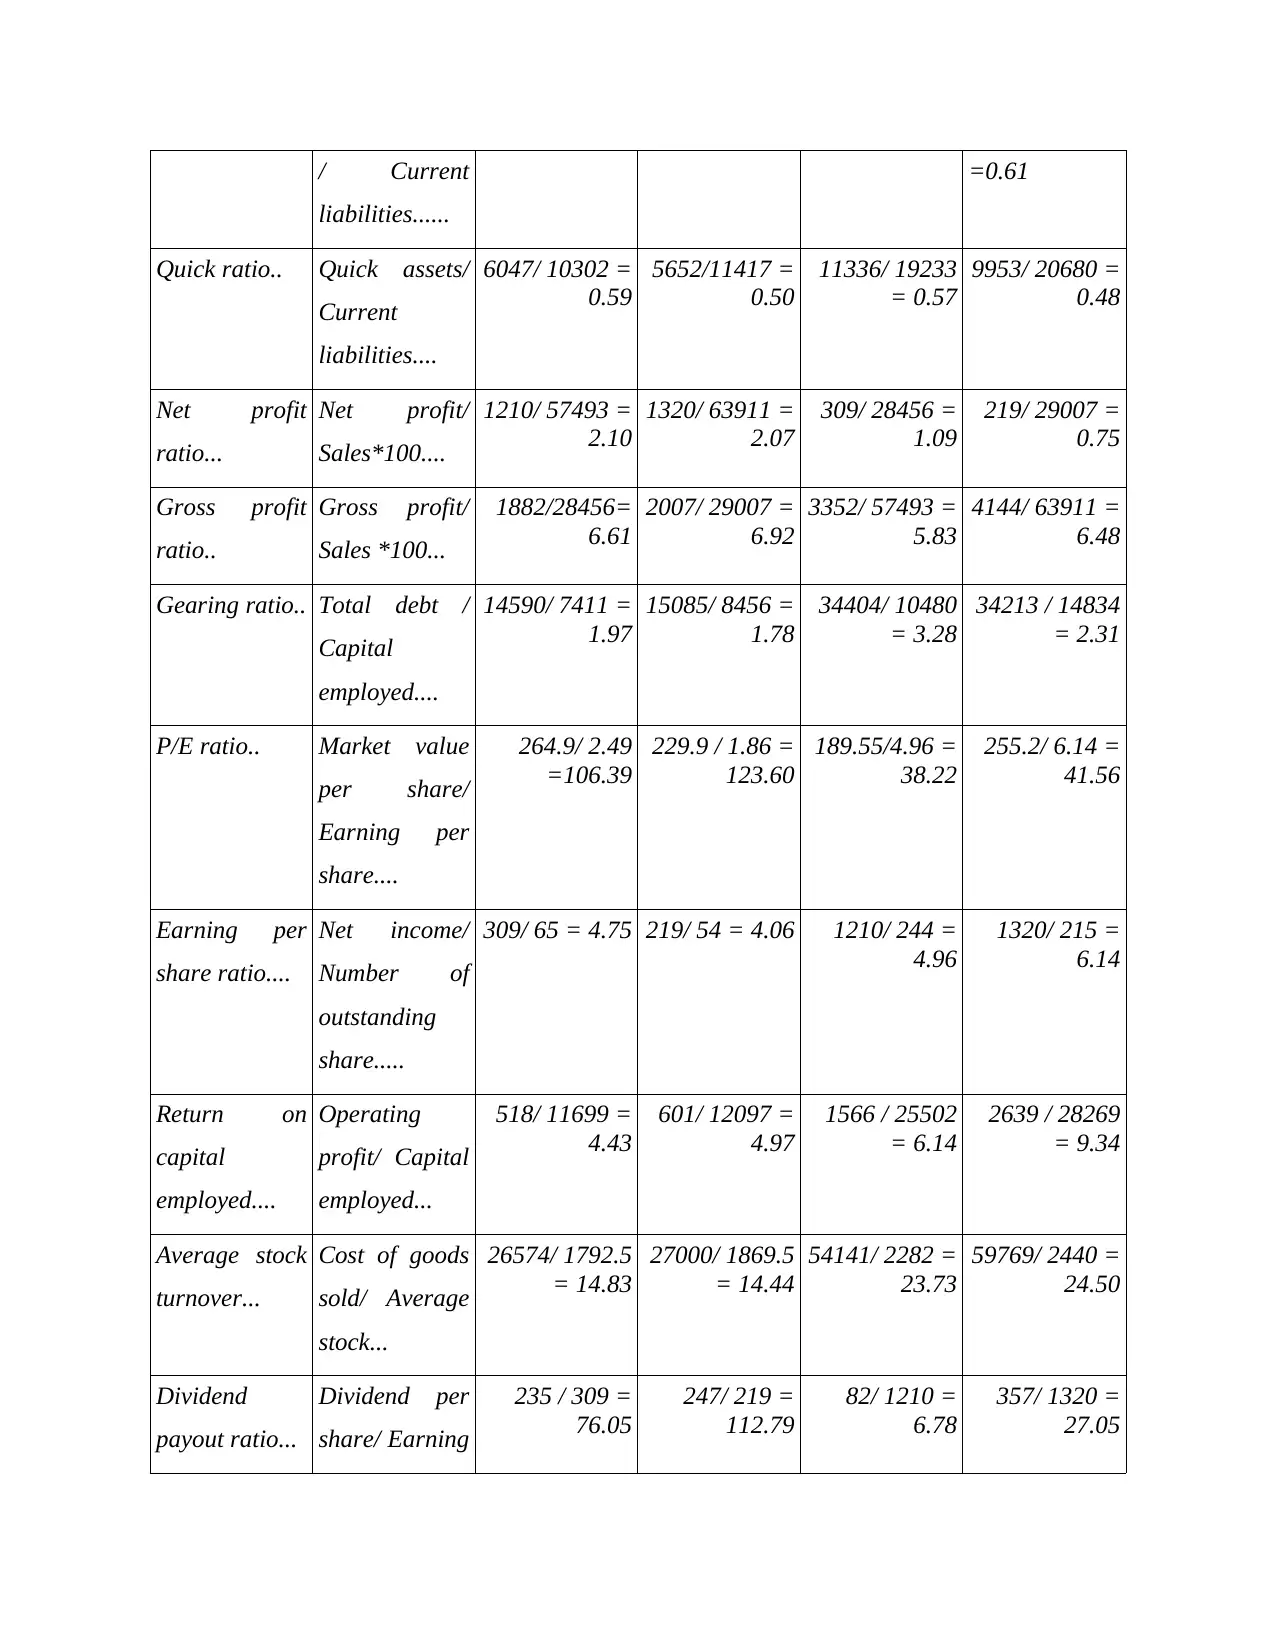
This report delves into the core concepts of managerial finance, presenting a comprehensive analysis of financial ratios and investment appraisal techniques. The report is divided into two portfolios, the first of which focuses on the application of ratio analysis to assess the financial performance of Tesco and Sainsbury, including calculations of current ratio, quick ratio, and profitability ratios. The second portfolio explores the use of various investment appraisal techniques for making investment decisions, including capital budgeting. The report also discusses the limitations of these techniques. The analysis includes detailed calculations, graphical representations, and interpretations of the financial data to provide a clear understanding of the financial positions of the companies and the effectiveness of the financial tools used. The report concludes with a synthesis of the key findings and implications for managerial decision-making, providing valuable insights for students of finance.

MANAGERIAL
FINANCE
FINANCE
Paraphrase This Document
Need a fresh take? Get an instant paraphrase of this document with our AI Paraphraser

Table of Contents
INTRODUCTION...........................................................................................................................3
PORTFOLIO 1.................................................................................................................................3
A Calculation related with financial ratio...................................................................................3
B. Explanation of assessment of financial performance of Tesco & Sainsbury.........................5
C Explanation of main cause of poor performance of organization...........................................8
D. Limitation of financial ratio technique for measures performance of organization...............8
PORTFOLIO 2.................................................................................................................................9
A. Use of various types of investment appraisal technique for investment decision..................9
B. Limitation of capital budgeting techniques..........................................................................11
CONCLUSION..............................................................................................................................12
REFERENCES..............................................................................................................................12
.......................................................................................................................................................12

INTRODUCTION
Managerial finance is define as essential branch of finance which help in create value of
organizations performance and its agility. To understand this concept this report has been
formulate. It divided into two parts. The first part is related with the relevance of ratio analysis as
essential tool of managerial finance. This define how manager use ratio to measure or compare
performance of Tesco & Sainsbury. It also define he limitations of this tool. In another portfolio
the relevance of managerial finance technique for determine or take decision has been mention
specifically. This report define how technique of capital budgeting calculated and their use for
take decision and limitation of theses techniques. All these information are define in systematic
manner.
PORTFOLIO 1
A Calculation related with financial ratio.
Ratio: In practical life the term ratio , define as tool which use for measure or define
quantitative relation between 2 elements. By using ratio person can evaluate the number of times
one item contains another in particular statement. Generally business organizations use ratio for
measure financial performance of their business transactions or activities within given time
period. This will help in determine impact of organizations activities on performance and earning
gain for the organization.
Tesco & Saisbury are run their business in supermarket sector, both are considers
multinational organization which contribute toward economy of UK. Theses entities use ratio
tool for measure financial performance .The main reason of use this tool to compare the
performance of each other by identifying performance in quantitative terms.
Following are calculation of some ratio through which manager can easily recognize and
compare performance of rival companies (Ahuja and Kalra, 2020).
Particular Formula Sainsbury
2018 2019
Tesco
2018 2019
Current ratio.. Current assets 7857/ 10302 =
0.76
7581 / 11417
= 0.66
13600/ 19233
=0.71
12570/20980
⊘ This is a preview!⊘
Do you want full access?
Subscribe today to unlock all pages.

Trusted by 1+ million students worldwide

/ Current
liabilities......
=0.61
Quick ratio.. Quick assets/
Current
liabilities....
6047/ 10302 =
0.59
5652/11417 =
0.50
11336/ 19233
= 0.57
9953/ 20680 =
0.48
Net profit
ratio...
Net profit/
Sales*100....
1210/ 57493 =
2.10
1320/ 63911 =
2.07
309/ 28456 =
1.09
219/ 29007 =
0.75
Gross profit
ratio..
Gross profit/
Sales *100...
1882/28456=
6.61
2007/ 29007 =
6.92
3352/ 57493 =
5.83
4144/ 63911 =
6.48
Gearing ratio.. Total debt /
Capital
employed....
14590/ 7411 =
1.97
15085/ 8456 =
1.78
34404/ 10480
= 3.28
34213 / 14834
= 2.31
P/E ratio.. Market value
per share/
Earning per
share....
264.9/ 2.49
=106.39
229.9 / 1.86 =
123.60
189.55/4.96 =
38.22
255.2/ 6.14 =
41.56
Earning per
share ratio....
Net income/
Number of
outstanding
share.....
309/ 65 = 4.75 219/ 54 = 4.06 1210/ 244 =
4.96
1320/ 215 =
6.14
Return on
capital
employed....
Operating
profit/ Capital
employed...
518/ 11699 =
4.43
601/ 12097 =
4.97
1566 / 25502
= 6.14
2639 / 28269
= 9.34
Average stock
turnover...
Cost of goods
sold/ Average
stock...
26574/ 1792.5
= 14.83
27000/ 1869.5
= 14.44
54141/ 2282 =
23.73
59769/ 2440 =
24.50
Dividend
payout ratio...
Dividend per
share/ Earning
235 / 309 =
76.05
247/ 219 =
112.79
82/ 1210 =
6.78
357/ 1320 =
27.05
Paraphrase This Document
Need a fresh take? Get an instant paraphrase of this document with our AI Paraphraser

per share...
Capital employed = Total assets- Total current liabilities
Tesco
2018 2019
44735 – 19233 = 25502 48949 – 20680 = 28269
Sainsbury
2018 2019
22001 – 10302 = 11699 23514 – 11417 = 12097
B. Explanation of assessment of financial performance of Tesco & Sainsbury
Current ratio: This ratio is treated a liquidity ratio as by computing level of this ratio
manager can find out ability of their business organization to pay short term debt liability
which is generally arise or have time period less then of one year.
Ideal current ratio should be treated as 2:1 which means that business entity must have excess of
current assets so they can fulfilled liability and maintain their level of financial liquidity.
Manager use chart or graphical representation through which they can easily interpret the
measurement of ratio. This will help in attract customer an useful for easily understand financial
position of organization (Bhaumik, 2016).
On the basis of recognizing value of chart it has been observe that current ratio value of
Sainsbury is much better then as compare with value of Tesco. Which means that Tesco need to
focus on managing their current asset for better management of their working capital assets.

Quick ratio: The main purpose of using to calculate quick ratio is to determine the
ability of having liquid asset in the form of cash as compare to their current liabilities. By
calculating quick ratio manager find out relation between organizations quick asset with
their liabilities. Higher ratio showcase strong financial position of organization and vice
versa. This graph represent that value of quick ratio in 2018 was same but as compare
with 2019 the value of Sainsbury is higher then quick ratio of Tesco. This represent that
management department of Sainsbury effective manager and control their cash asst thus
a compare to their rival company they are in strong liquid position.
Tesco Sainsburry
Current
0%
10%
20%
30%
40%
50%
60%
70%
80%
90%
100%
Tesco
Sainsbury
01 0.59 0.590.48 0.5
Quick Ratio
2018 2019
⊘ This is a preview!⊘
Do you want full access?
Subscribe today to unlock all pages.

Trusted by 1+ million students worldwide

Net profit ratio: This ratio is used to calculate the value of net profit and its relation with
sales. The main purpose of this ratio is to determine ability of organization to generate
profit or revenue by selling their products. To understand the potion of net profit ratio
manager need to use graphs through which the can easily determine value ((Bu, 2020).
Tesco Sainsburry
Liquid
0
500
1000
1500
2000
2500
3000
3500
4000
4500
Paraphrase This Document
Need a fresh take? Get an instant paraphrase of this document with our AI Paraphraser

According to this graphical representation it clearly interpreted that Tesco 's ability to generate
Tesco
Sainsbury
0123
2.1
1.09
2.07
0.75
Net profit margin
2018 2019
Tesco Sainsburry
Net profit ratio
0
500
1000
1500
2000
2500
3000
3500
4000
4500
Tesco
Sainsbury
0123
2.1
1.09
2.07
0.75
Net profit margin
2018 2019
Tesco Sainsburry
Net profit ratio
0
500
1000
1500
2000
2500
3000
3500
4000
4500

net product is much higher then as compare with Sainabury. As in case of 201 value of net profit
ratio was 2.1 and in 2019 it was determine at 2.07 on the other side Sainsbur only generate 1.09
in 2018 and its profit value decliner 0.75.Which means that Tesco able to attain more profit as
compare to Sainsubry.
Gross profit margin: This ratio is consider to determine level of profitably before adjustment of
any kind of tax or other expenses. Manager calculate this ratio to determine
the actual or real capacity of organization to generate profit for sales (Ehrlich and Potter,
2020)
Tesco
Sainsbury
5.25.45.65.866.26.46.66.877.2
5.83
6.61
6.48
6.92
Gross profit margin
2018 2019
⊘ This is a preview!⊘
Do you want full access?
Subscribe today to unlock all pages.

Trusted by 1+ million students worldwide

In case of net profit Tesco is much better condition however in case of gross profit ratio, the
value of Sainsbury is higher . This means that the revenue rate of Sainsbury is better then Tesco
but due to their selling expenses it is not able to generate more profit as compare to their rival
industries.
Gearing ratio:The main purpose of determining this ratio is to identify value of financial
leverage by calculating or measuring value of equity and business liabilities. The main
purpose of determining this ratio to evaluate that business corporation must have
sufficient external source which will help in measuring or providing tax benefits. To
evaluate gearing ratio of Tesco and Sainsbury chart has been formulated.
Tesco Sainsburry
Gross profit ratio
0
500
1000
1500
2000
2500
3000
3500
4000
4500
Paraphrase This Document
Need a fresh take? Get an instant paraphrase of this document with our AI Paraphraser

Tesco
Sainsbury
024 3.28
1.972.31 1.78
Gearing ratio
2018 2019
Tesco Sainsburry
capital gearing
0
500
1000
1500
2000
2500
3000
3500
4000
4500
Column E
Column D
Sainsbury
024 3.28
1.972.31 1.78
Gearing ratio
2018 2019
Tesco Sainsburry
capital gearing
0
500
1000
1500
2000
2500
3000
3500
4000
4500
Column E
Column D

On the basis of recognizing the chart it clearly define that Tesco's gearing ratio is much higher
which means that this organization use or formulate strategies which help in managing their
extent funds in effective way as compare with Sainsbury.
Price earnings ratio: This ratio is calculated by only listed organization. The main
purpose of calculating this ratio is to determine whether organization is under or
overvalued as per the norms of accounting standard. They on the basis of calculating
price earning ratio organization able to found the rate of revenue investor gain upon each
share. Higher ratio of price earning showcase high exception of investors regarding with
earnings (Jaisinghani, Kaur and Inamdar, 2019).
On the basis of calculating value from chart it define hat Sainsbury market price and value of
earnings much better then Tesco.
Earnings per share: This ratio is also part of profitability ratio. It is calculated by
recognize profit with number of shares organization have. On the basis of that manager
measure the rate of profit of organization. For measure the comparison between theses
two companies chart has been formulated (Kwon, 2018).
Tesco
Sainsbury
050100150
38.22
106.39
41.56
123.6
Price earnings ratio
2018 2019
⊘ This is a preview!⊘
Do you want full access?
Subscribe today to unlock all pages.

Trusted by 1+ million students worldwide
1 out of 25
Related Documents

Your All-in-One AI-Powered Toolkit for Academic Success.
+13062052269
info@desklib.com
Available 24*7 on WhatsApp / Email
Unlock your academic potential
Copyright © 2020–2025 A2Z Services. All Rights Reserved. Developed and managed by ZUCOL.