SBM203: Managerial Finance Report Comparing Two Companies' Performance
VerifiedAdded on 2022/12/01
|21
|4000
|469
Report
AI Summary
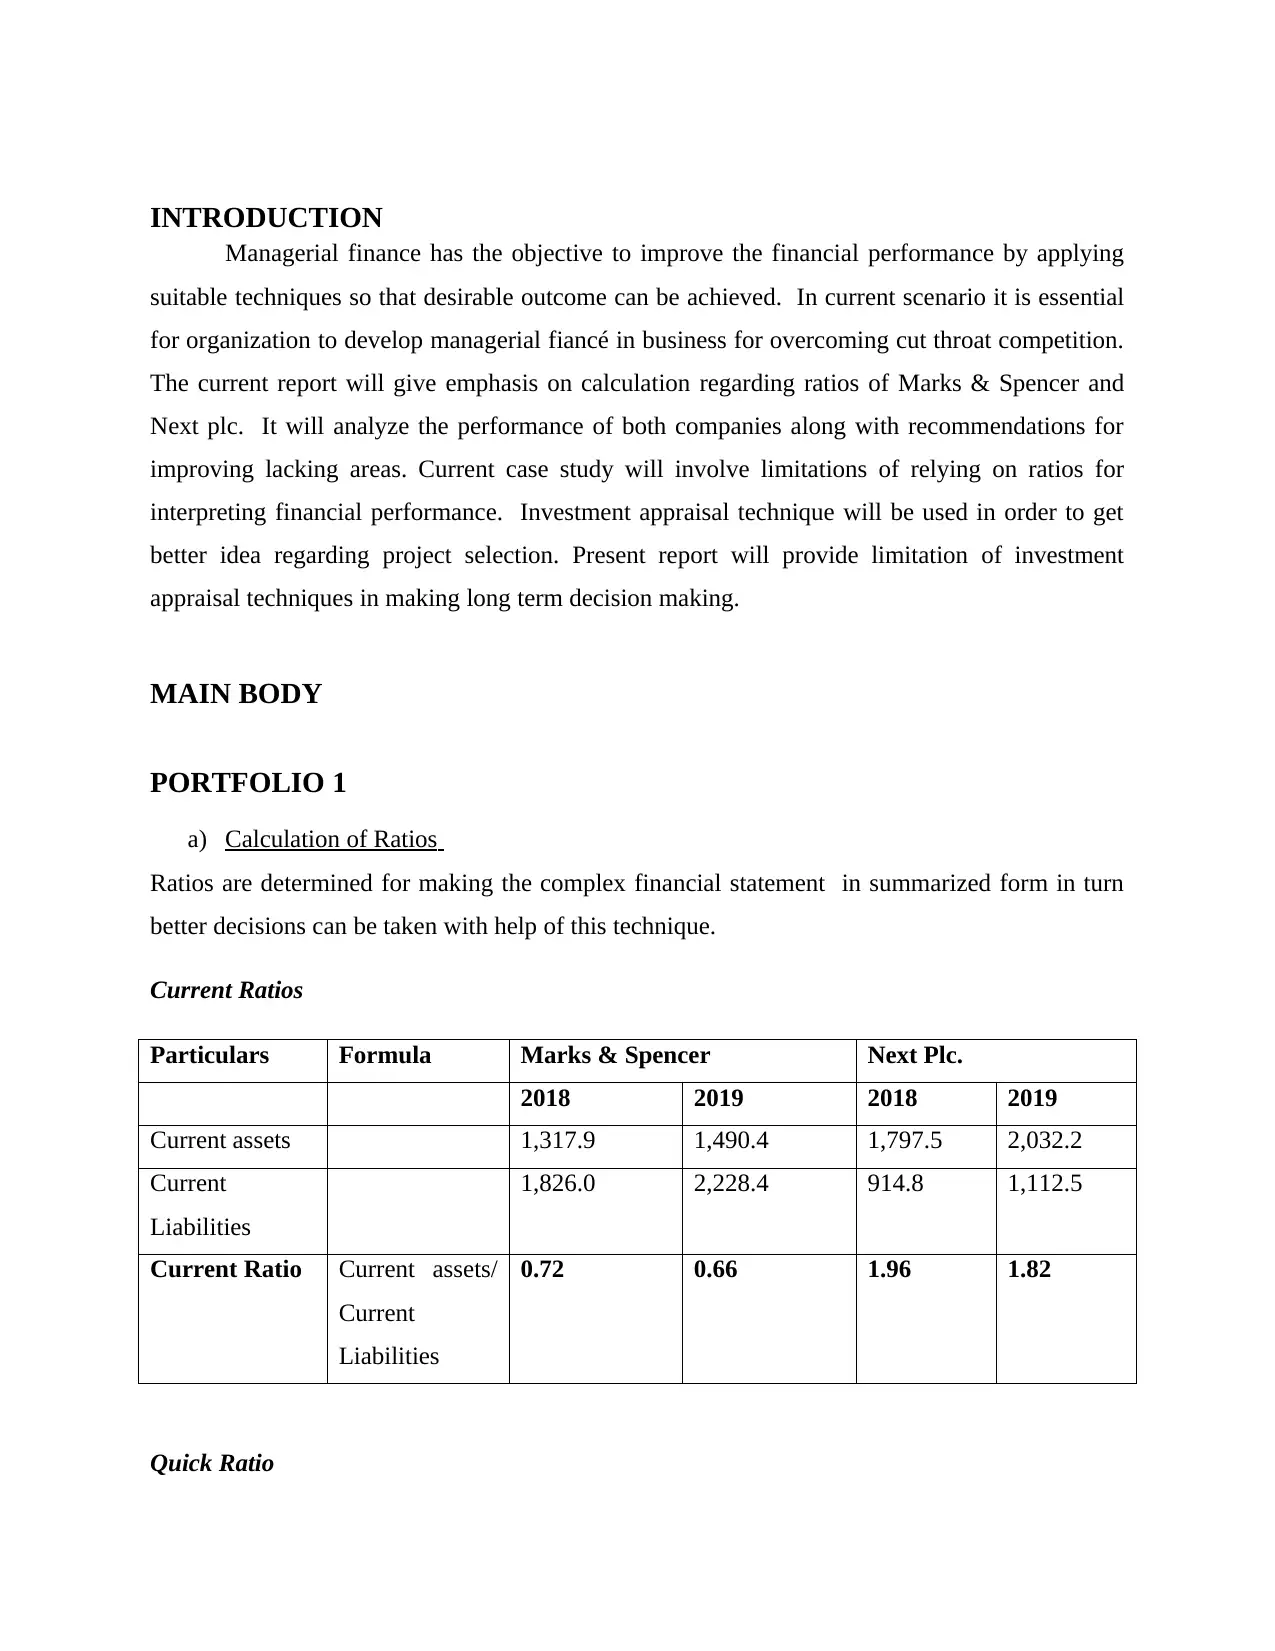
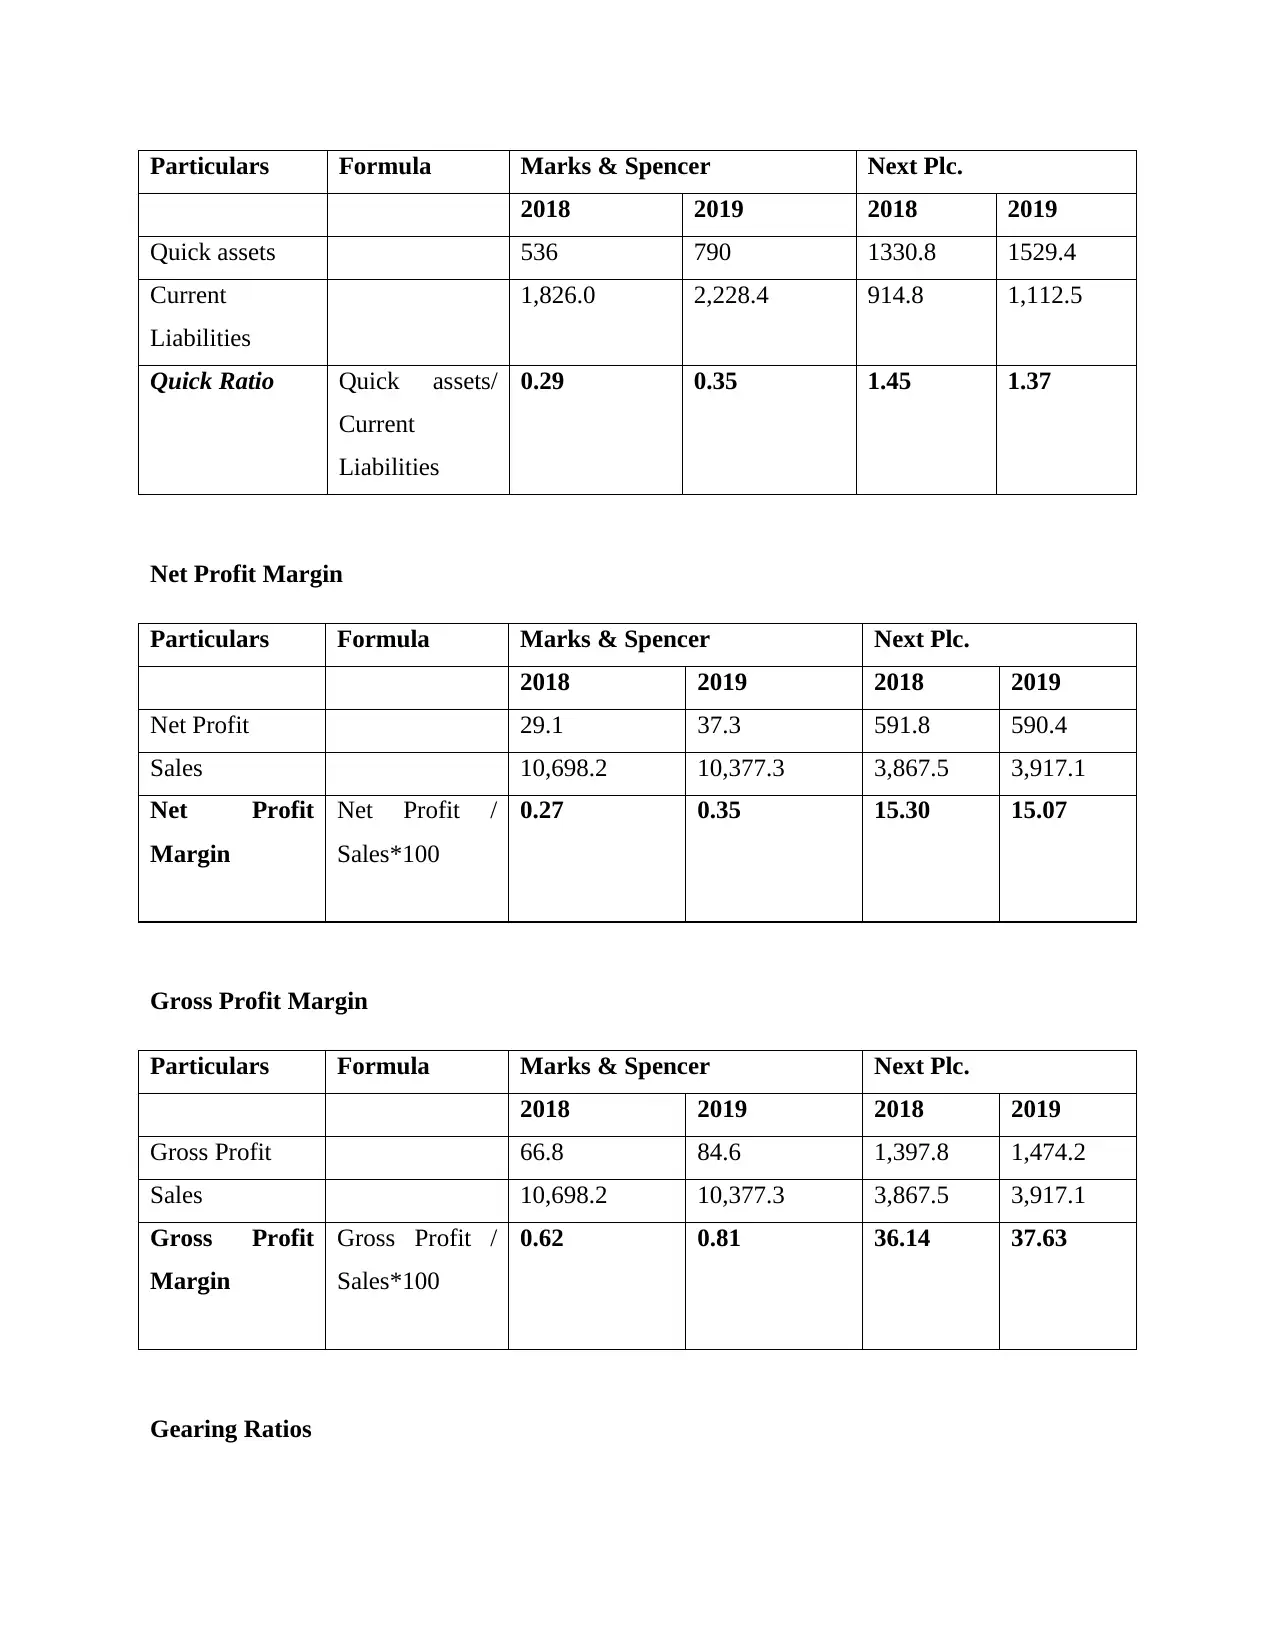
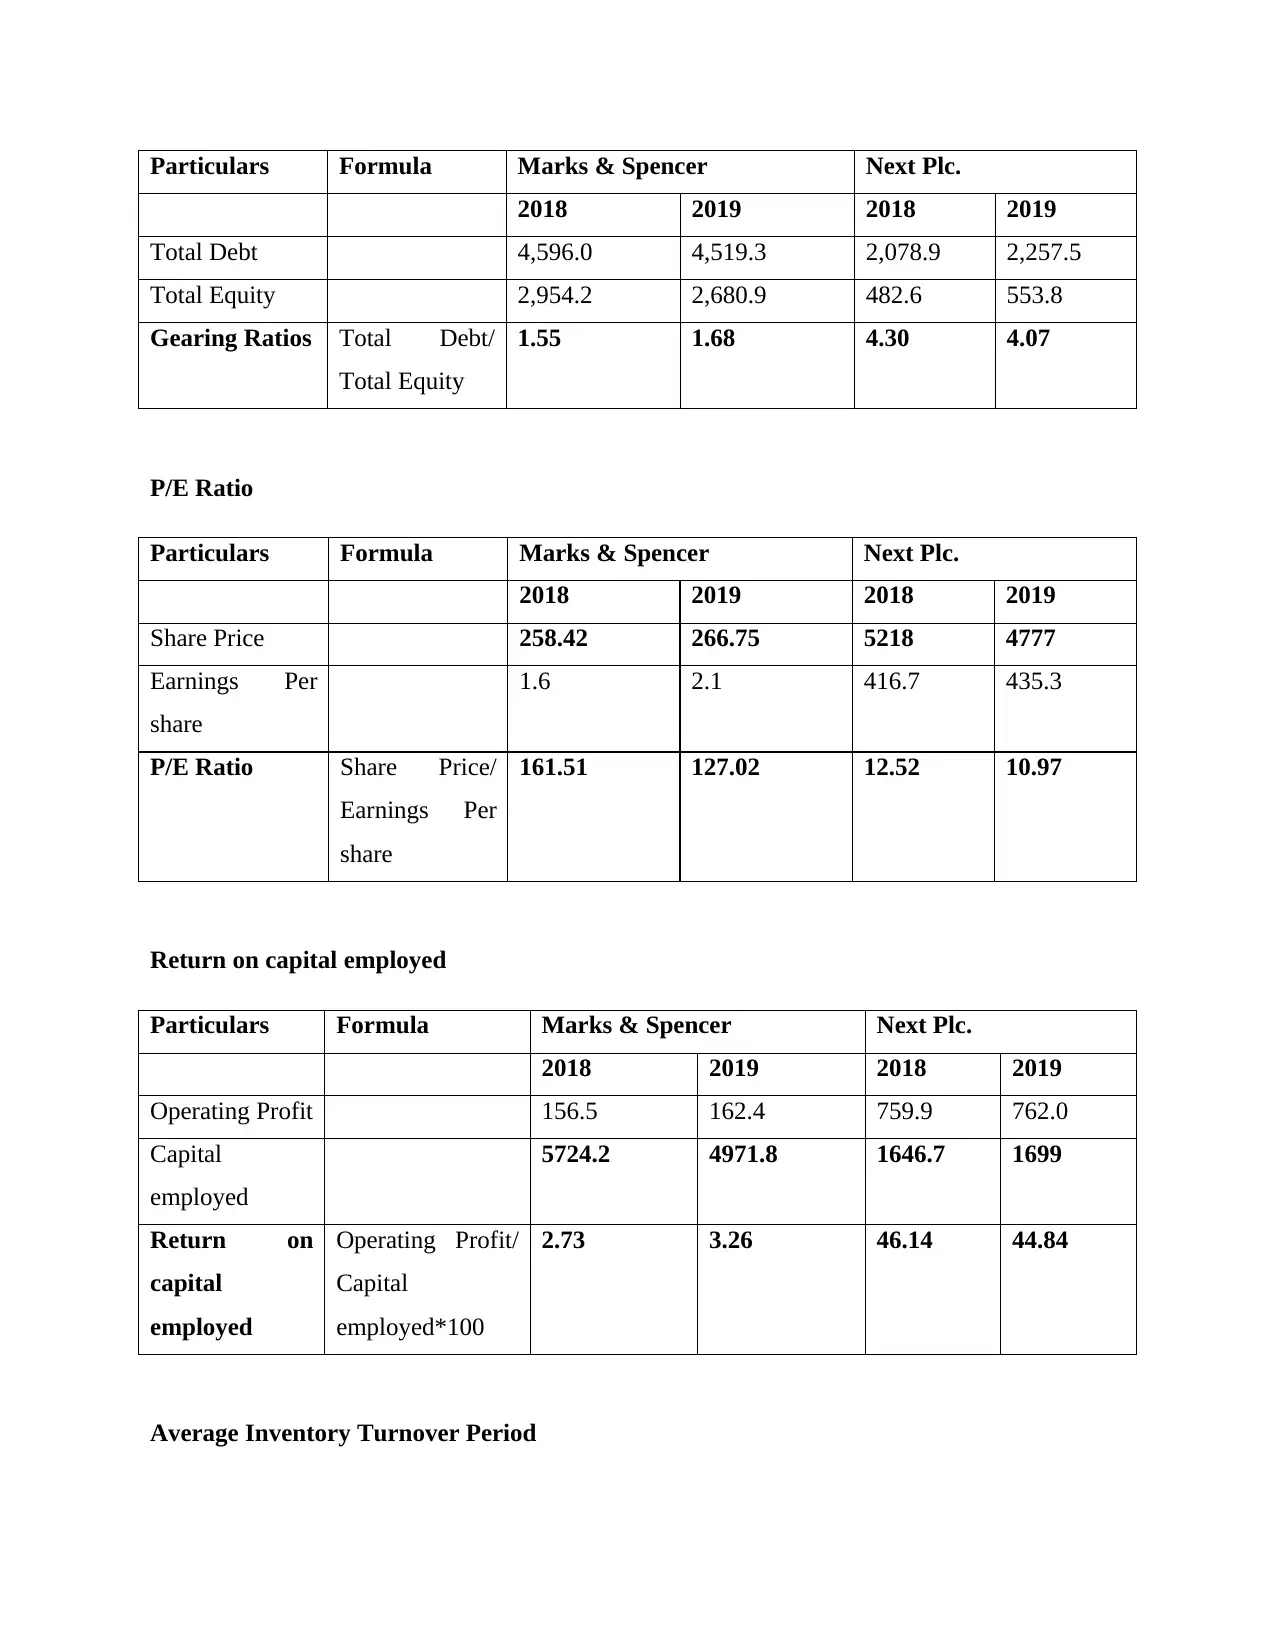
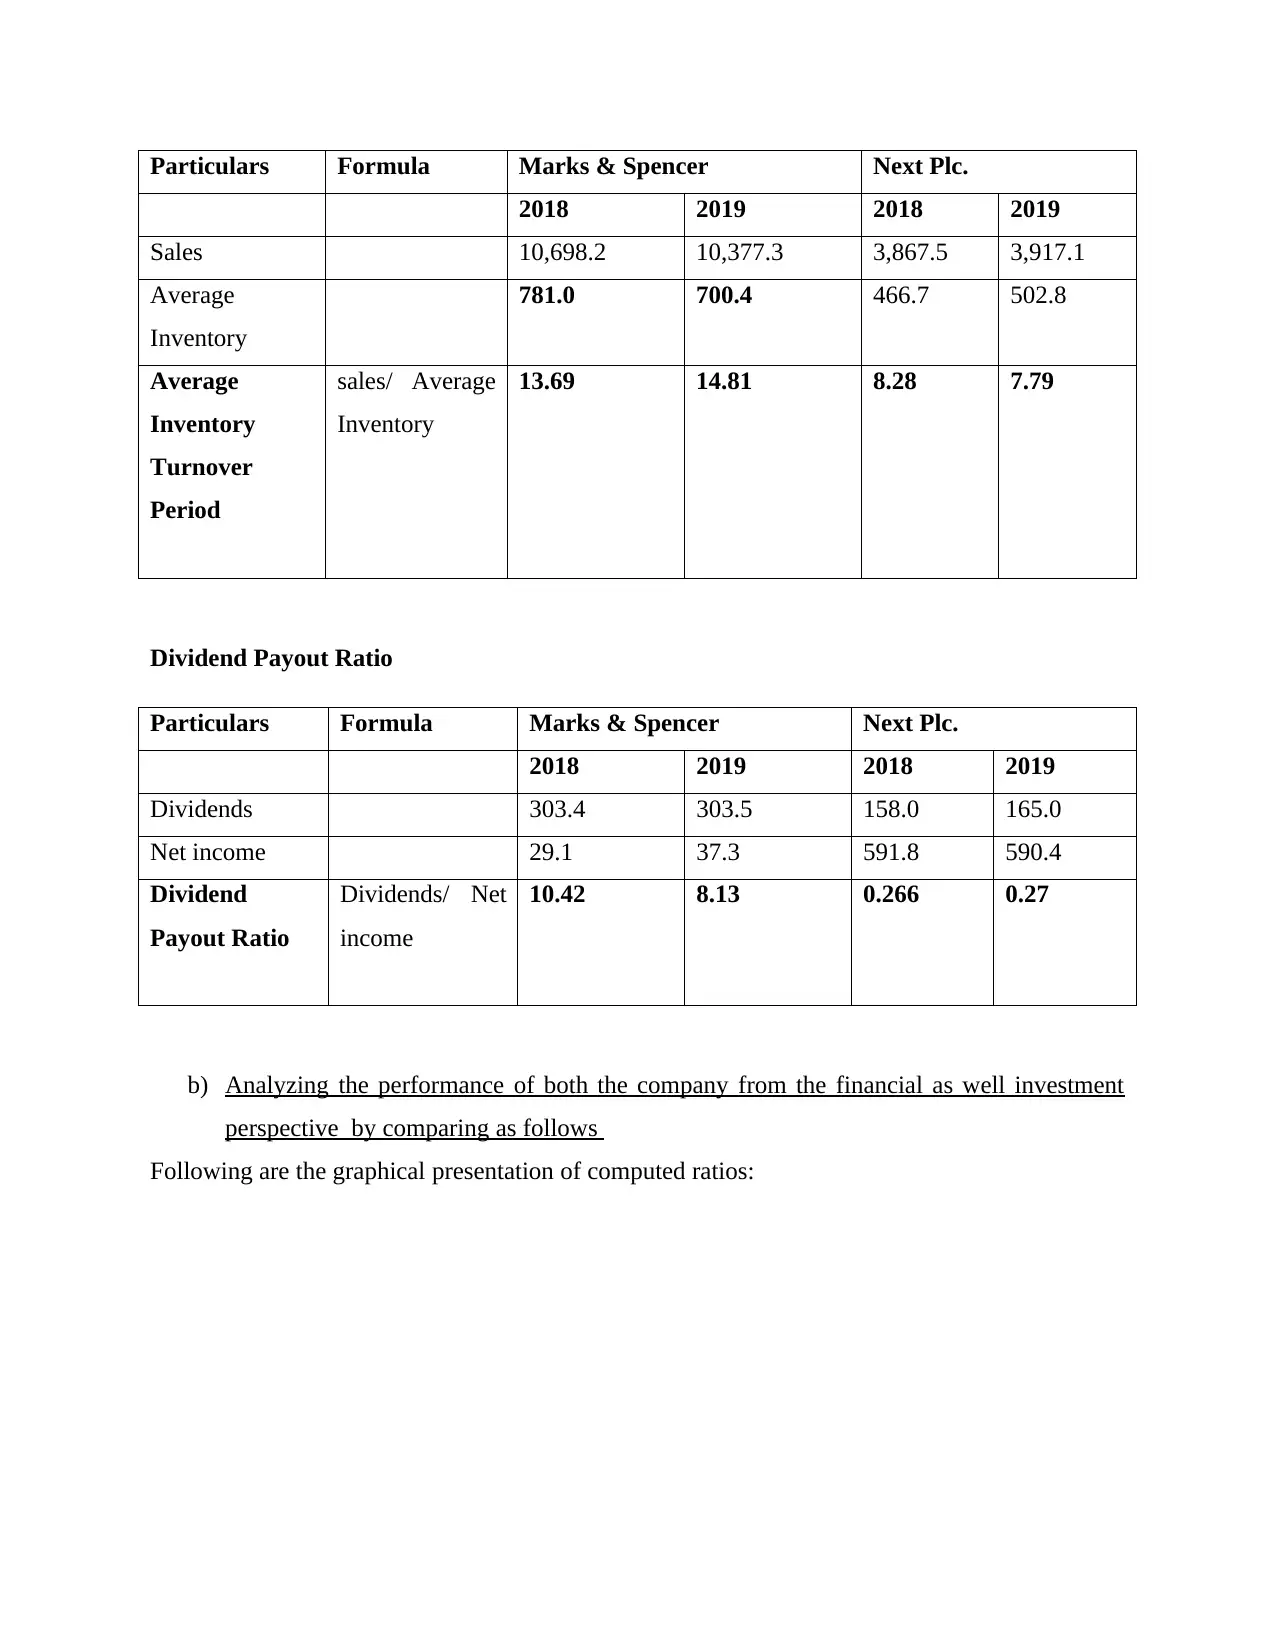
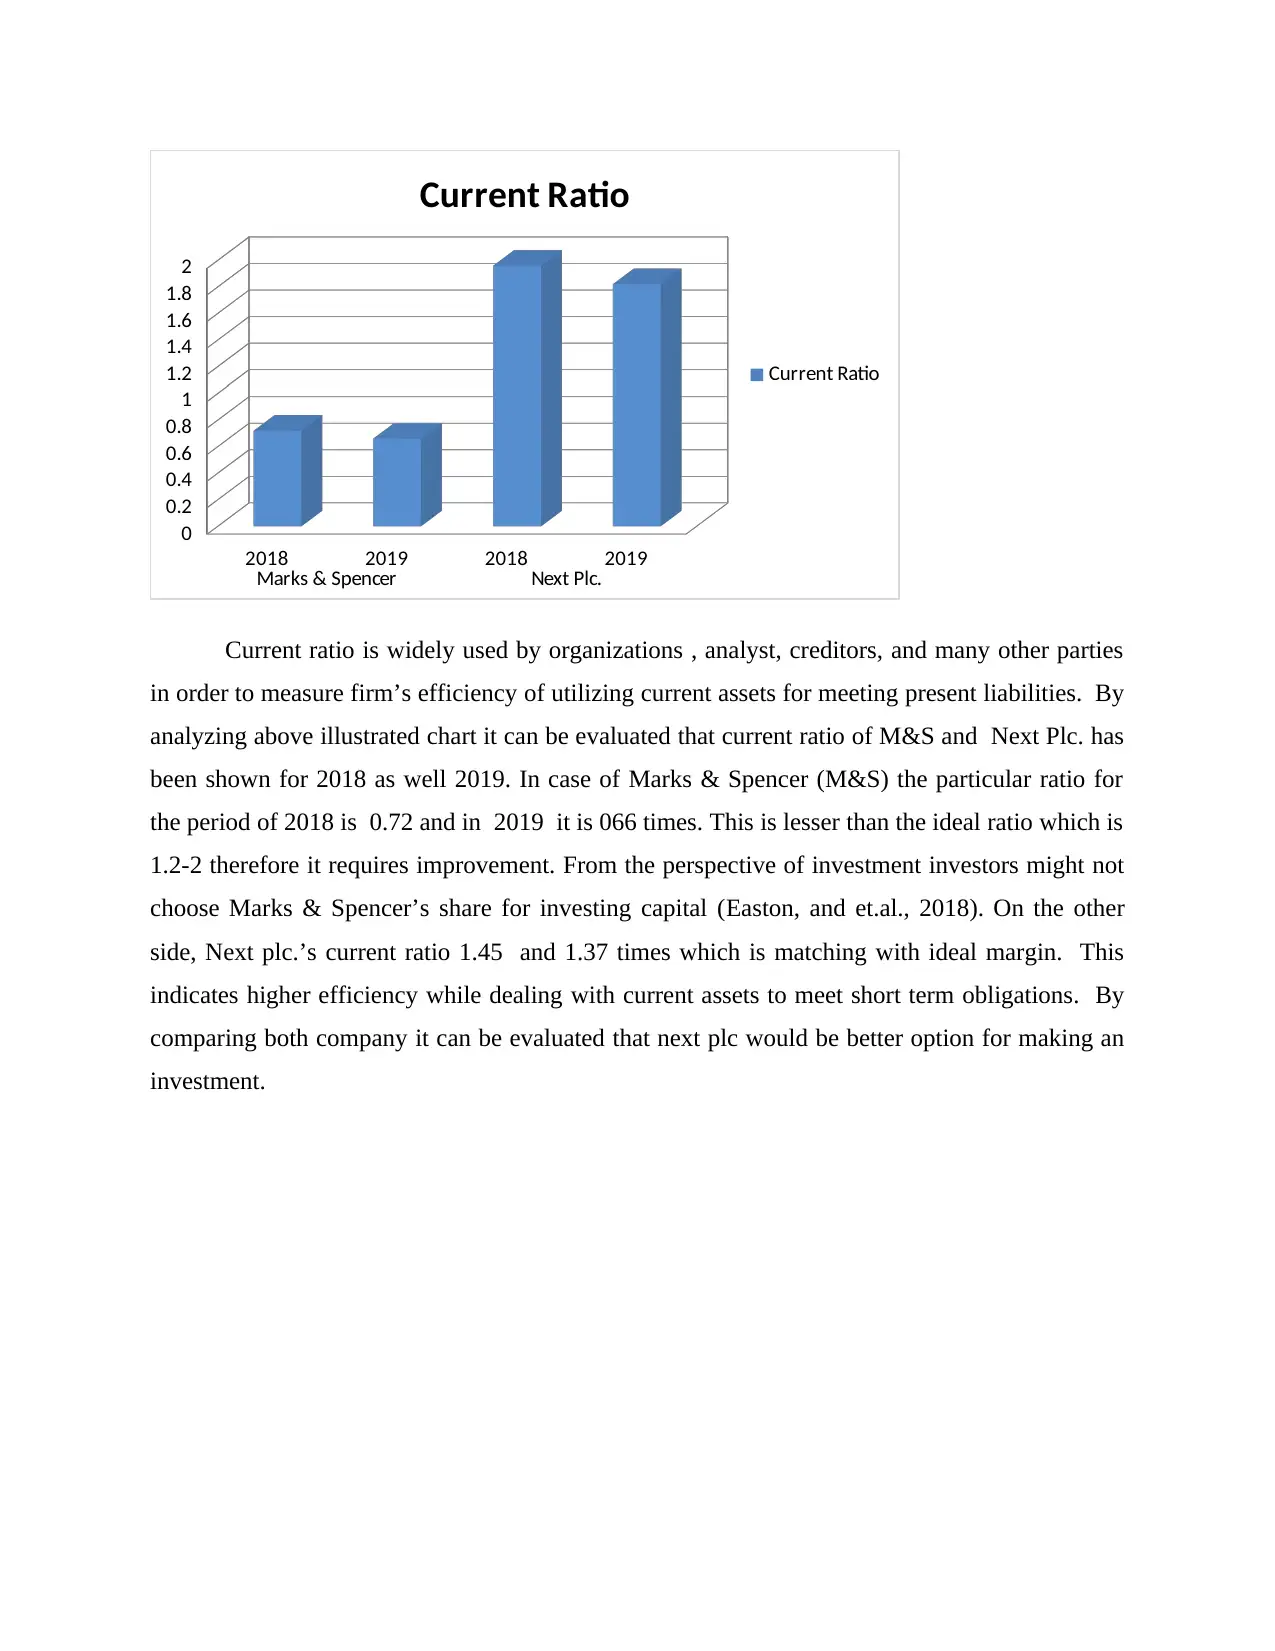
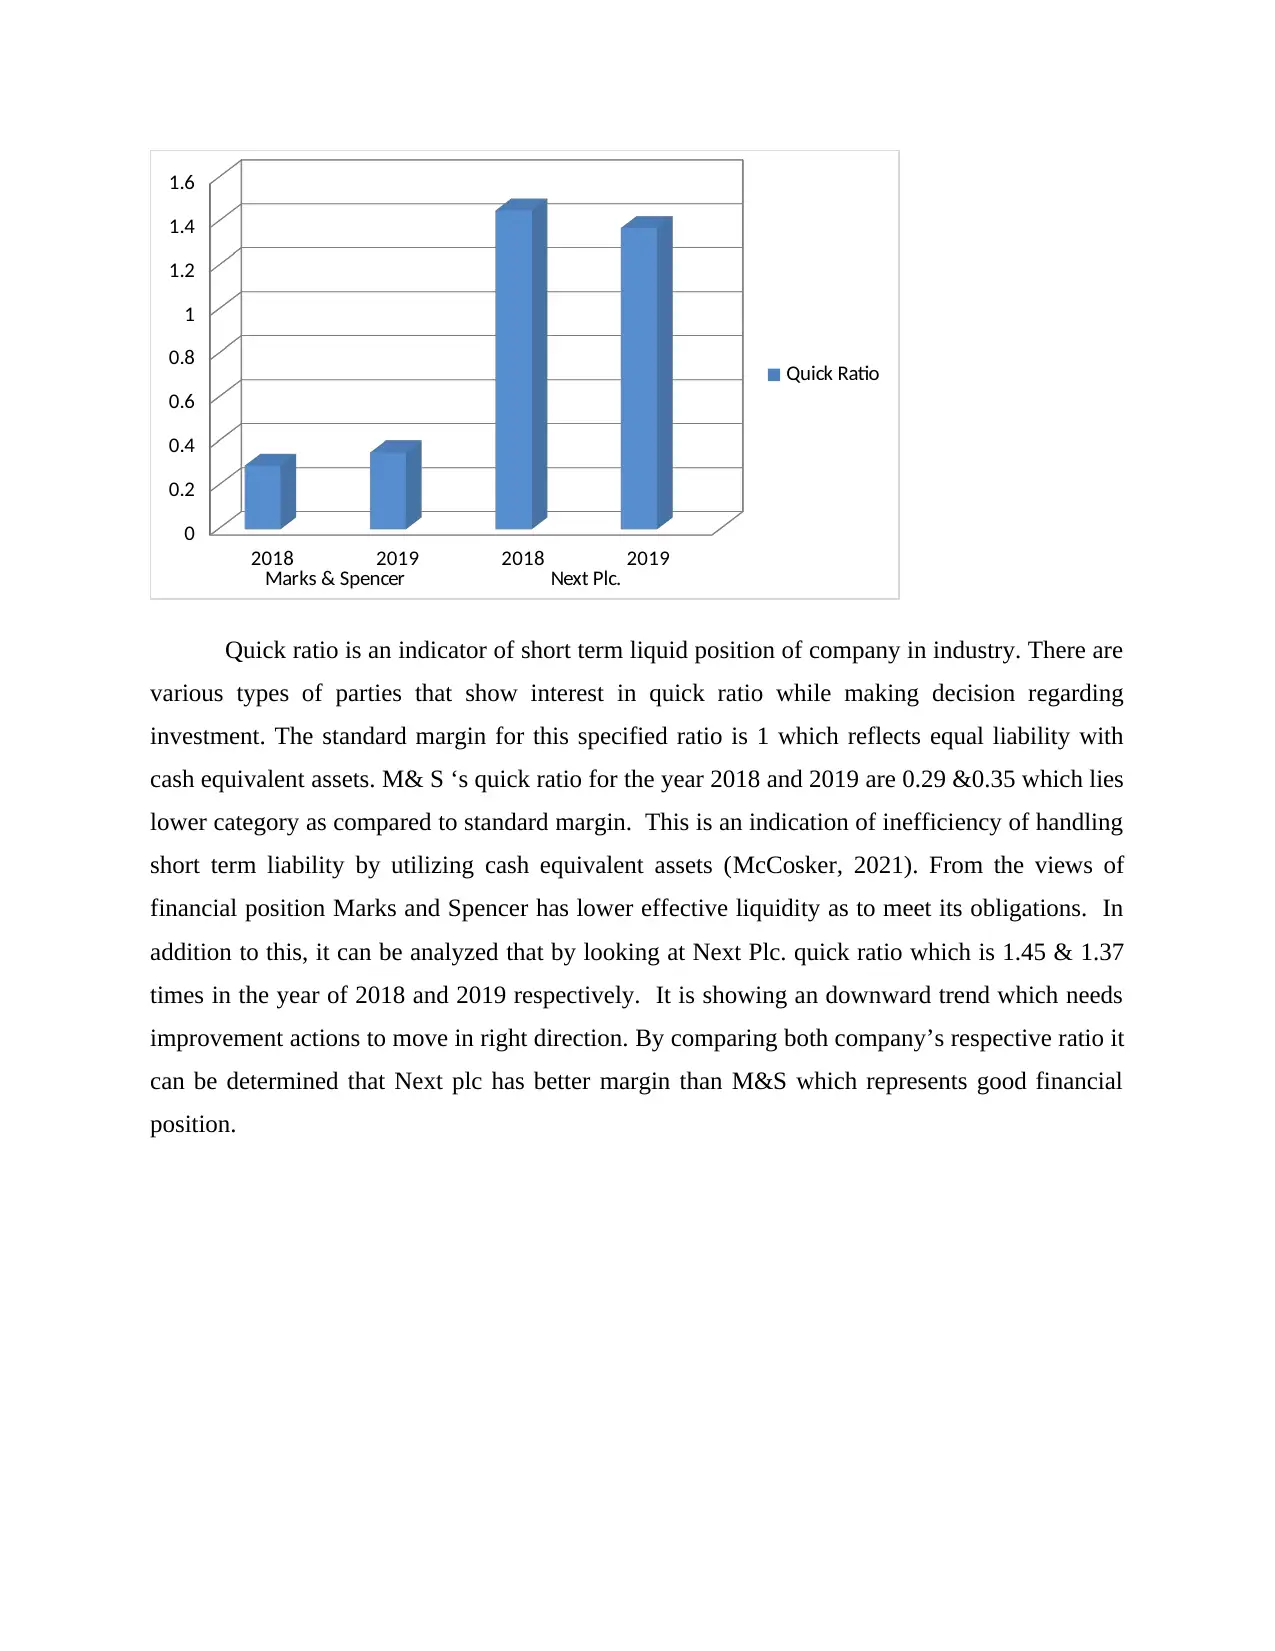
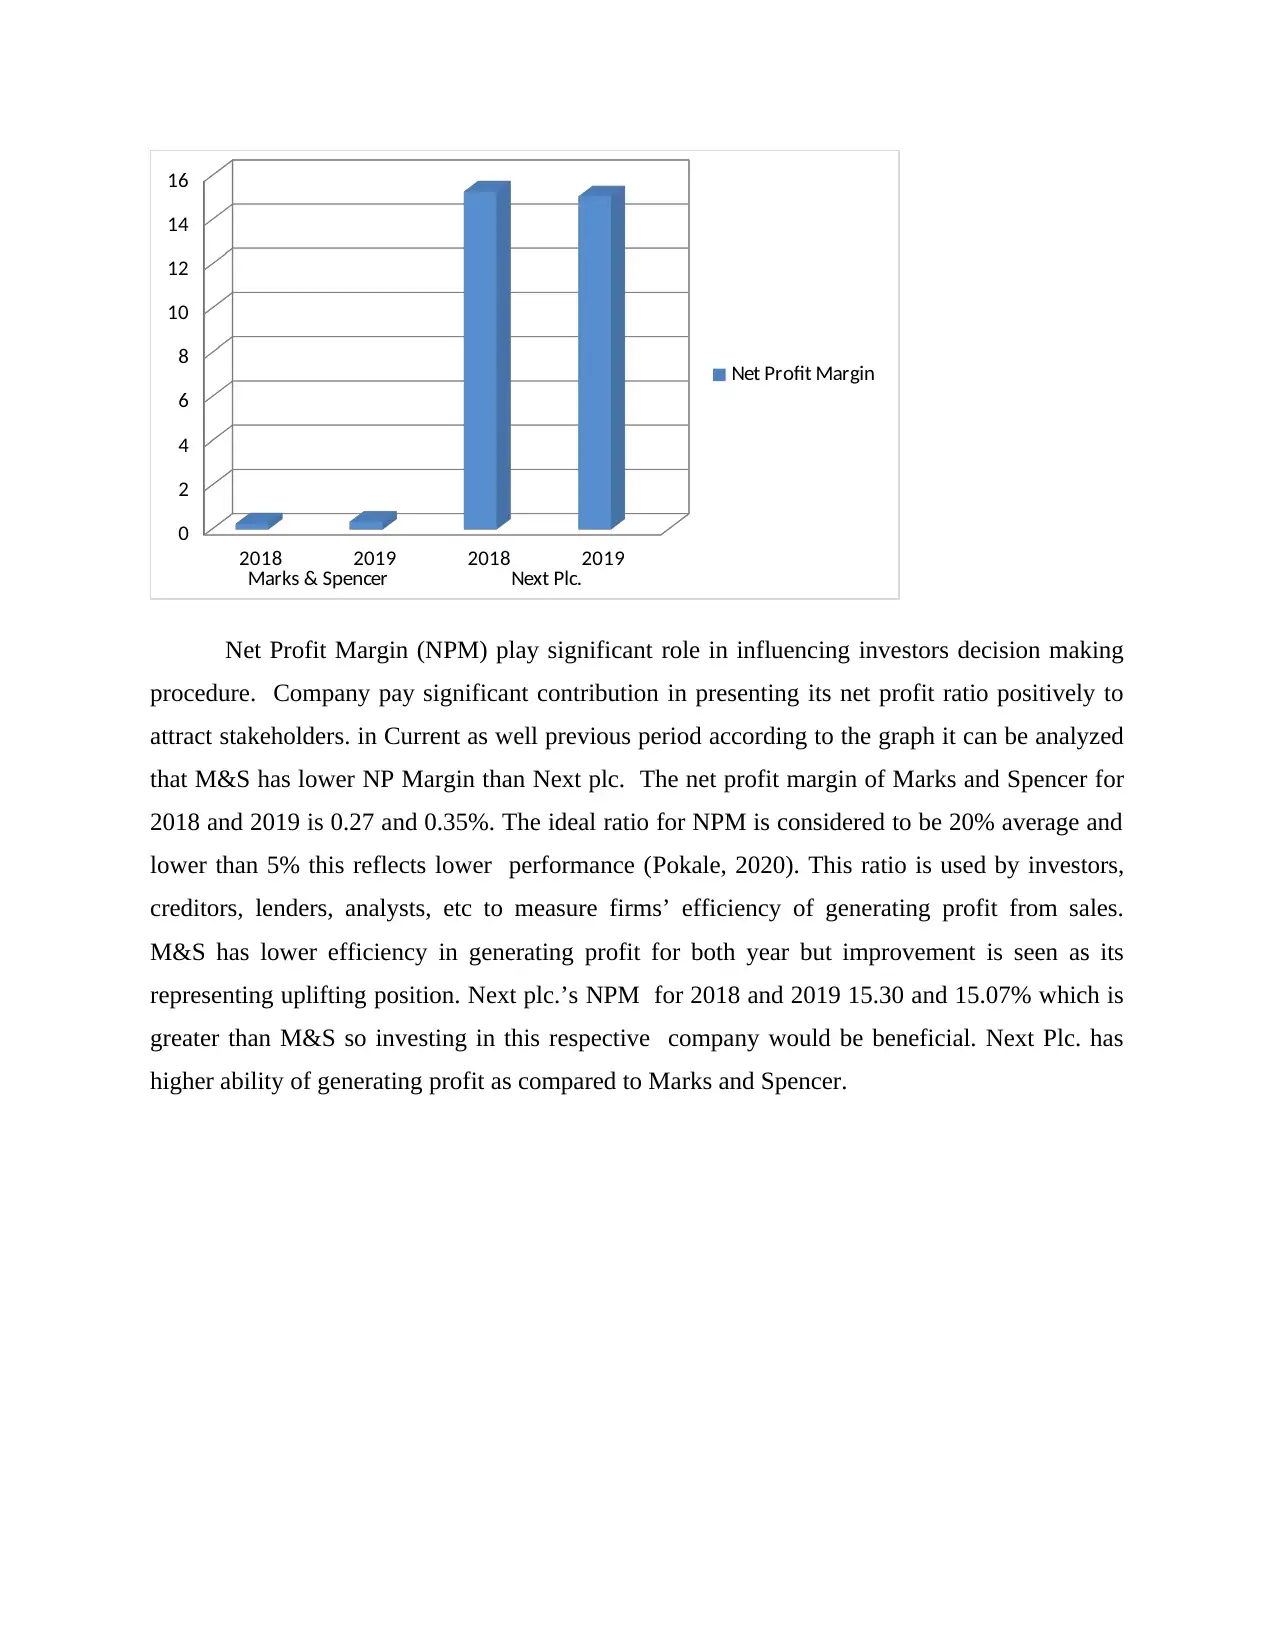
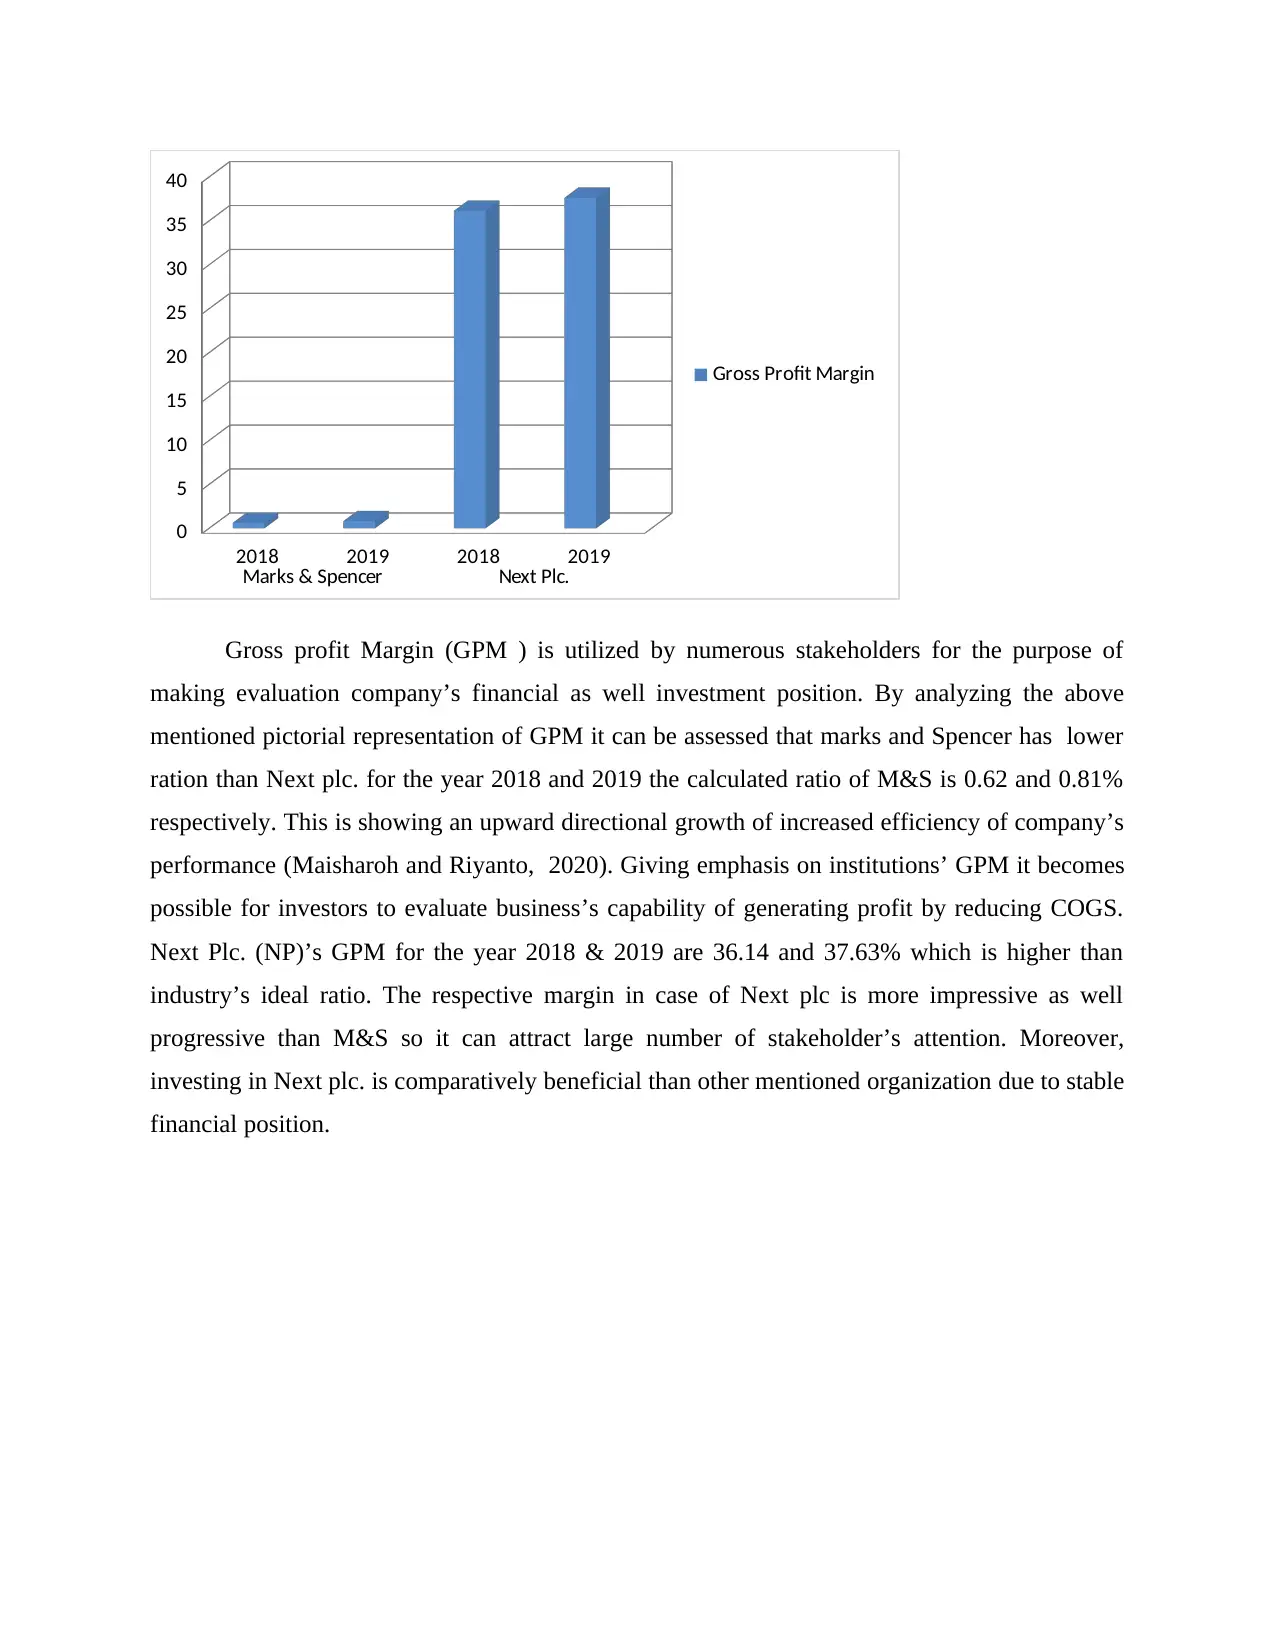
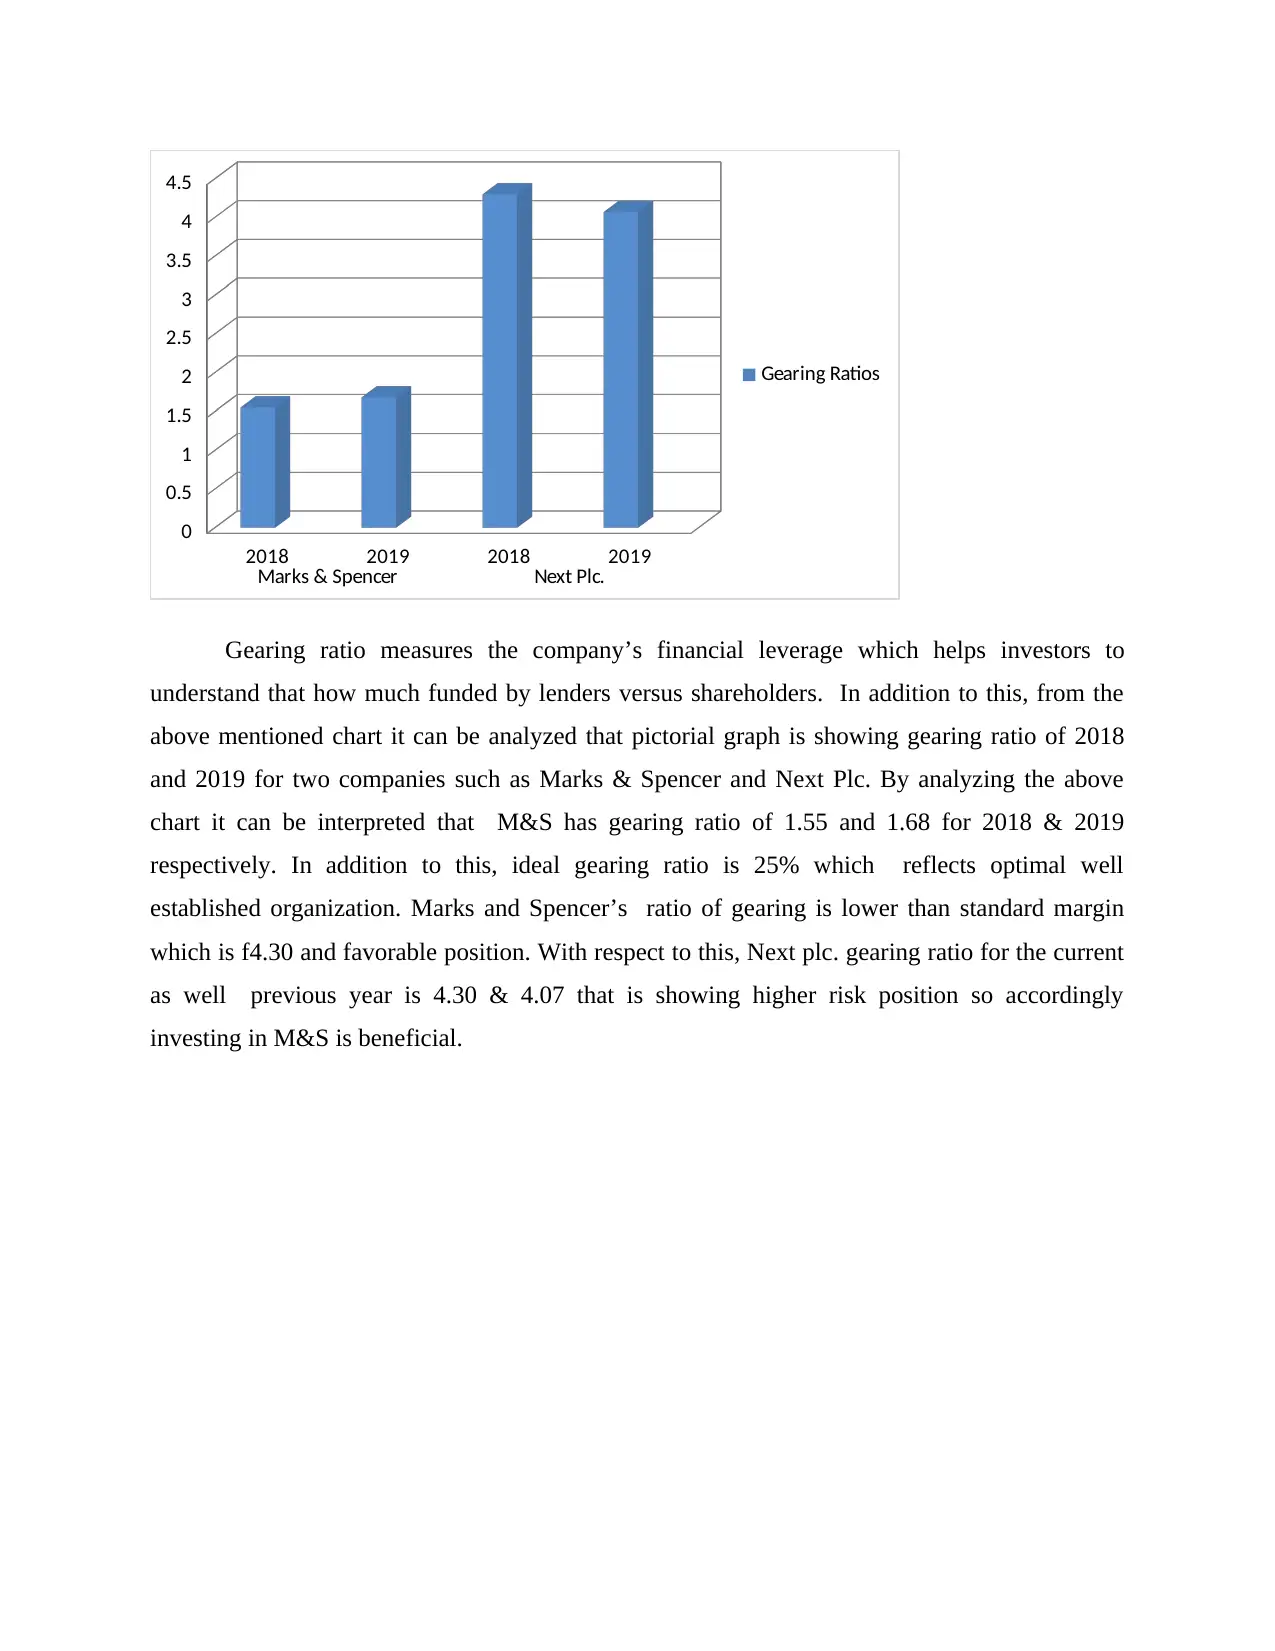
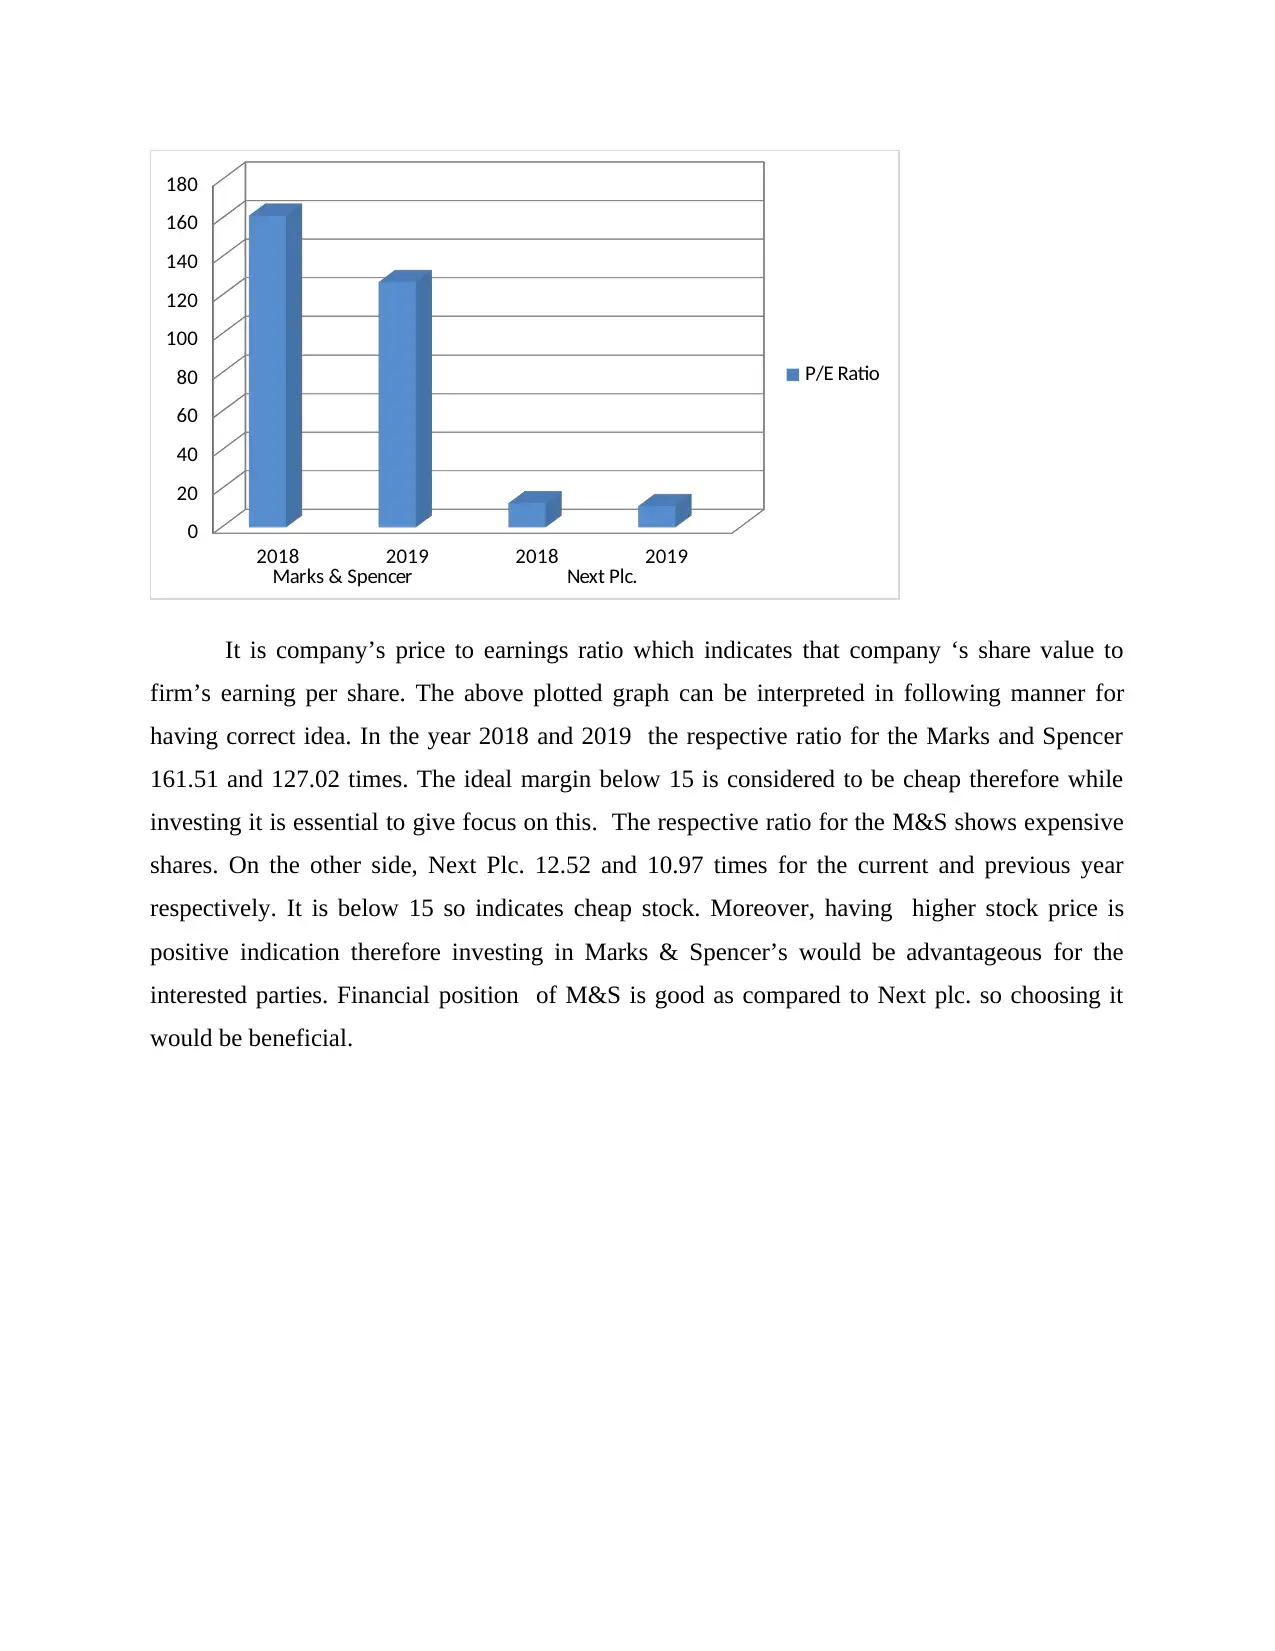
This report provides a detailed analysis of managerial finance, focusing on the financial performance of Marks & Spencer and Next plc. It begins with an introduction to managerial finance and its importance in business, followed by a calculation of various financial ratios such as current ratio, quick ratio, net profit margin, gross profit margin, gearing ratios, P/E ratio, return on capital employed, average inventory turnover period, and dividend payout ratio for both companies over two years. The report then analyzes the performance of both companies from financial and investment perspectives, using graphical presentations of the computed ratios. Recommendations are provided for improving poor performance, and the limitations of relying on ratios for analyzing company performance are discussed. Furthermore, the report explores investment appraisal techniques for advising project selection and discusses the limitations of capital appraisal techniques in long-term decision-making. The report concludes with a summary of the findings and provides references.

MANAGERIAL FINANCE -
SBM203_AS2R
SBM203_AS2R
Paraphrase This Document
Need a fresh take? Get an instant paraphrase of this document with our AI Paraphraser

TABLE OF CONTENTS
INTRODUCTION.......................................................................................................................................3
MAIN BODY..............................................................................................................................................3
PORTFOLIO 1............................................................................................................................................3
a) Calculation of Ratios.......................................................................................................................3
b) Analyzing the performance of both the company from the financial as well investment perspective
by comparing as follows..........................................................................................................................6
c) Providing recommendation for improving poor performance.....................................................15
d) Discussing the limitations of relying on ratios for analyzing company performance.....................16
PORTFOLIO 2..........................................................................................................................................16
a) Investment appraisal techniques for advising project selection......................................................16
b) Discussing the limitations of capital appraisal technique in long term decision making................19
CONCLUSION.........................................................................................................................................20
REFERENCES..........................................................................................................................................21

INTRODUCTION
Managerial finance has the objective to improve the financial performance by applying
suitable techniques so that desirable outcome can be achieved. In current scenario it is essential
for organization to develop managerial fiancé in business for overcoming cut throat competition.
The current report will give emphasis on calculation regarding ratios of Marks & Spencer and
Next plc. It will analyze the performance of both companies along with recommendations for
improving lacking areas. Current case study will involve limitations of relying on ratios for
interpreting financial performance. Investment appraisal technique will be used in order to get
better idea regarding project selection. Present report will provide limitation of investment
appraisal techniques in making long term decision making.
MAIN BODY
PORTFOLIO 1
a) Calculation of Ratios
Ratios are determined for making the complex financial statement in summarized form in turn
better decisions can be taken with help of this technique.
Current Ratios
Particulars Formula Marks & Spencer Next Plc.
2018 2019 2018 2019
Current assets 1,317.9 1,490.4 1,797.5 2,032.2
Current
Liabilities
1,826.0 2,228.4 914.8 1,112.5
Current Ratio Current assets/
Current
Liabilities
0.72 0.66 1.96 1.82
Quick Ratio
⊘ This is a preview!⊘
Do you want full access?
Subscribe today to unlock all pages.

Trusted by 1+ million students worldwide

Particulars Formula Marks & Spencer Next Plc.
2018 2019 2018 2019
Quick assets 536 790 1330.8 1529.4
Current
Liabilities
1,826.0 2,228.4 914.8 1,112.5
Quick Ratio Quick assets/
Current
Liabilities
0.29 0.35 1.45 1.37
Net Profit Margin
Particulars Formula Marks & Spencer Next Plc.
2018 2019 2018 2019
Net Profit 29.1 37.3 591.8 590.4
Sales 10,698.2 10,377.3 3,867.5 3,917.1
Net Profit
Margin
Net Profit /
Sales*100
0.27 0.35 15.30 15.07
Gross Profit Margin
Particulars Formula Marks & Spencer Next Plc.
2018 2019 2018 2019
Gross Profit 66.8 84.6 1,397.8 1,474.2
Sales 10,698.2 10,377.3 3,867.5 3,917.1
Gross Profit
Margin
Gross Profit /
Sales*100
0.62 0.81 36.14 37.63
Gearing Ratios
2018 2019 2018 2019
Quick assets 536 790 1330.8 1529.4
Current
Liabilities
1,826.0 2,228.4 914.8 1,112.5
Quick Ratio Quick assets/
Current
Liabilities
0.29 0.35 1.45 1.37
Net Profit Margin
Particulars Formula Marks & Spencer Next Plc.
2018 2019 2018 2019
Net Profit 29.1 37.3 591.8 590.4
Sales 10,698.2 10,377.3 3,867.5 3,917.1
Net Profit
Margin
Net Profit /
Sales*100
0.27 0.35 15.30 15.07
Gross Profit Margin
Particulars Formula Marks & Spencer Next Plc.
2018 2019 2018 2019
Gross Profit 66.8 84.6 1,397.8 1,474.2
Sales 10,698.2 10,377.3 3,867.5 3,917.1
Gross Profit
Margin
Gross Profit /
Sales*100
0.62 0.81 36.14 37.63
Gearing Ratios
Paraphrase This Document
Need a fresh take? Get an instant paraphrase of this document with our AI Paraphraser

Particulars Formula Marks & Spencer Next Plc.
2018 2019 2018 2019
Total Debt 4,596.0 4,519.3 2,078.9 2,257.5
Total Equity 2,954.2 2,680.9 482.6 553.8
Gearing Ratios Total Debt/
Total Equity
1.55 1.68 4.30 4.07
P/E Ratio
Particulars Formula Marks & Spencer Next Plc.
2018 2019 2018 2019
Share Price 258.42 266.75 5218 4777
Earnings Per
share
1.6 2.1 416.7 435.3
P/E Ratio Share Price/
Earnings Per
share
161.51 127.02 12.52 10.97
Return on capital employed
Particulars Formula Marks & Spencer Next Plc.
2018 2019 2018 2019
Operating Profit 156.5 162.4 759.9 762.0
Capital
employed
5724.2 4971.8 1646.7 1699
Return on
capital
employed
Operating Profit/
Capital
employed*100
2.73 3.26 46.14 44.84
Average Inventory Turnover Period
2018 2019 2018 2019
Total Debt 4,596.0 4,519.3 2,078.9 2,257.5
Total Equity 2,954.2 2,680.9 482.6 553.8
Gearing Ratios Total Debt/
Total Equity
1.55 1.68 4.30 4.07
P/E Ratio
Particulars Formula Marks & Spencer Next Plc.
2018 2019 2018 2019
Share Price 258.42 266.75 5218 4777
Earnings Per
share
1.6 2.1 416.7 435.3
P/E Ratio Share Price/
Earnings Per
share
161.51 127.02 12.52 10.97
Return on capital employed
Particulars Formula Marks & Spencer Next Plc.
2018 2019 2018 2019
Operating Profit 156.5 162.4 759.9 762.0
Capital
employed
5724.2 4971.8 1646.7 1699
Return on
capital
employed
Operating Profit/
Capital
employed*100
2.73 3.26 46.14 44.84
Average Inventory Turnover Period

Particulars Formula Marks & Spencer Next Plc.
2018 2019 2018 2019
Sales 10,698.2 10,377.3 3,867.5 3,917.1
Average
Inventory
781.0 700.4 466.7 502.8
Average
Inventory
Turnover
Period
sales/ Average
Inventory
13.69 14.81 8.28 7.79
Dividend Payout Ratio
Particulars Formula Marks & Spencer Next Plc.
2018 2019 2018 2019
Dividends 303.4 303.5 158.0 165.0
Net income 29.1 37.3 591.8 590.4
Dividend
Payout Ratio
Dividends/ Net
income
10.42 8.13 0.266 0.27
b) Analyzing the performance of both the company from the financial as well investment
perspective by comparing as follows
Following are the graphical presentation of computed ratios:
2018 2019 2018 2019
Sales 10,698.2 10,377.3 3,867.5 3,917.1
Average
Inventory
781.0 700.4 466.7 502.8
Average
Inventory
Turnover
Period
sales/ Average
Inventory
13.69 14.81 8.28 7.79
Dividend Payout Ratio
Particulars Formula Marks & Spencer Next Plc.
2018 2019 2018 2019
Dividends 303.4 303.5 158.0 165.0
Net income 29.1 37.3 591.8 590.4
Dividend
Payout Ratio
Dividends/ Net
income
10.42 8.13 0.266 0.27
b) Analyzing the performance of both the company from the financial as well investment
perspective by comparing as follows
Following are the graphical presentation of computed ratios:
⊘ This is a preview!⊘
Do you want full access?
Subscribe today to unlock all pages.

Trusted by 1+ million students worldwide

2018 2019 2018 2019
Marks & Spencer Next Plc.
0
0.2
0.4
0.6
0.8
1
1.2
1.4
1.6
1.8
2
Current Ratio
Current Ratio
Current ratio is widely used by organizations , analyst, creditors, and many other parties
in order to measure firm’s efficiency of utilizing current assets for meeting present liabilities. By
analyzing above illustrated chart it can be evaluated that current ratio of M&S and Next Plc. has
been shown for 2018 as well 2019. In case of Marks & Spencer (M&S) the particular ratio for
the period of 2018 is 0.72 and in 2019 it is 066 times. This is lesser than the ideal ratio which is
1.2-2 therefore it requires improvement. From the perspective of investment investors might not
choose Marks & Spencer’s share for investing capital (Easton, and et.al., 2018). On the other
side, Next plc.’s current ratio 1.45 and 1.37 times which is matching with ideal margin. This
indicates higher efficiency while dealing with current assets to meet short term obligations. By
comparing both company it can be evaluated that next plc would be better option for making an
investment.
Paraphrase This Document
Need a fresh take? Get an instant paraphrase of this document with our AI Paraphraser

2018 2019 2018 2019
Marks & Spencer Next Plc.
0
0.2
0.4
0.6
0.8
1
1.2
1.4
1.6
Quick Ratio
Quick ratio is an indicator of short term liquid position of company in industry. There are
various types of parties that show interest in quick ratio while making decision regarding
investment. The standard margin for this specified ratio is 1 which reflects equal liability with
cash equivalent assets. M& S ‘s quick ratio for the year 2018 and 2019 are 0.29 &0.35 which lies
lower category as compared to standard margin. This is an indication of inefficiency of handling
short term liability by utilizing cash equivalent assets (McCosker, 2021). From the views of
financial position Marks and Spencer has lower effective liquidity as to meet its obligations. In
addition to this, it can be analyzed that by looking at Next Plc. quick ratio which is 1.45 & 1.37
times in the year of 2018 and 2019 respectively. It is showing an downward trend which needs
improvement actions to move in right direction. By comparing both company’s respective ratio it
can be determined that Next plc has better margin than M&S which represents good financial
position.

2018 2019 2018 2019
Marks & Spencer Next Plc.
0
2
4
6
8
10
12
14
16
Net Profit Margin
Net Profit Margin (NPM) play significant role in influencing investors decision making
procedure. Company pay significant contribution in presenting its net profit ratio positively to
attract stakeholders. in Current as well previous period according to the graph it can be analyzed
that M&S has lower NP Margin than Next plc. The net profit margin of Marks and Spencer for
2018 and 2019 is 0.27 and 0.35%. The ideal ratio for NPM is considered to be 20% average and
lower than 5% this reflects lower performance (Pokale, 2020). This ratio is used by investors,
creditors, lenders, analysts, etc to measure firms’ efficiency of generating profit from sales.
M&S has lower efficiency in generating profit for both year but improvement is seen as its
representing uplifting position. Next plc.’s NPM for 2018 and 2019 15.30 and 15.07% which is
greater than M&S so investing in this respective company would be beneficial. Next Plc. has
higher ability of generating profit as compared to Marks and Spencer.
⊘ This is a preview!⊘
Do you want full access?
Subscribe today to unlock all pages.

Trusted by 1+ million students worldwide

2018 2019 2018 2019
Marks & Spencer Next Plc.
0
5
10
15
20
25
30
35
40
Gross Profit Margin
Gross profit Margin (GPM ) is utilized by numerous stakeholders for the purpose of
making evaluation company’s financial as well investment position. By analyzing the above
mentioned pictorial representation of GPM it can be assessed that marks and Spencer has lower
ration than Next plc. for the year 2018 and 2019 the calculated ratio of M&S is 0.62 and 0.81%
respectively. This is showing an upward directional growth of increased efficiency of company’s
performance (Maisharoh and Riyanto, 2020). Giving emphasis on institutions’ GPM it becomes
possible for investors to evaluate business’s capability of generating profit by reducing COGS.
Next Plc. (NP)’s GPM for the year 2018 & 2019 are 36.14 and 37.63% which is higher than
industry’s ideal ratio. The respective margin in case of Next plc is more impressive as well
progressive than M&S so it can attract large number of stakeholder’s attention. Moreover,
investing in Next plc. is comparatively beneficial than other mentioned organization due to stable
financial position.
Paraphrase This Document
Need a fresh take? Get an instant paraphrase of this document with our AI Paraphraser

2018 2019 2018 2019
Marks & Spencer Next Plc.
0
0.5
1
1.5
2
2.5
3
3.5
4
4.5
Gearing Ratios
Gearing ratio measures the company’s financial leverage which helps investors to
understand that how much funded by lenders versus shareholders. In addition to this, from the
above mentioned chart it can be analyzed that pictorial graph is showing gearing ratio of 2018
and 2019 for two companies such as Marks & Spencer and Next Plc. By analyzing the above
chart it can be interpreted that M&S has gearing ratio of 1.55 and 1.68 for 2018 & 2019
respectively. In addition to this, ideal gearing ratio is 25% which reflects optimal well
established organization. Marks and Spencer’s ratio of gearing is lower than standard margin
which is f4.30 and favorable position. With respect to this, Next plc. gearing ratio for the current
as well previous year is 4.30 & 4.07 that is showing higher risk position so accordingly
investing in M&S is beneficial.

2018 2019 2018 2019
Marks & Spencer Next Plc.
0
20
40
60
80
100
120
140
160
180
P/E Ratio
It is company’s price to earnings ratio which indicates that company ‘s share value to
firm’s earning per share. The above plotted graph can be interpreted in following manner for
having correct idea. In the year 2018 and 2019 the respective ratio for the Marks and Spencer
161.51 and 127.02 times. The ideal margin below 15 is considered to be cheap therefore while
investing it is essential to give focus on this. The respective ratio for the M&S shows expensive
shares. On the other side, Next Plc. 12.52 and 10.97 times for the current and previous year
respectively. It is below 15 so indicates cheap stock. Moreover, having higher stock price is
positive indication therefore investing in Marks & Spencer’s would be advantageous for the
interested parties. Financial position of M&S is good as compared to Next plc. so choosing it
would be beneficial.
⊘ This is a preview!⊘
Do you want full access?
Subscribe today to unlock all pages.

Trusted by 1+ million students worldwide
1 out of 21
Related Documents

Your All-in-One AI-Powered Toolkit for Academic Success.
+13062052269
info@desklib.com
Available 24*7 on WhatsApp / Email
Unlock your academic potential
Copyright © 2020–2025 A2Z Services. All Rights Reserved. Developed and managed by ZUCOL.