Analyzing Incentives and Carbon Emission Reduction in Organizations
VerifiedAdded on 2021/01/05
|16
|3751
|77
Report
AI Summary
This report investigates the relationship between managerial incentives and carbon emission reduction in organizations. It begins with an introduction and a literature review, covering stakeholder theory and its relevance. A conceptual model and hypotheses are presented, followed by descriptive statistics and inferential data analysis using t-tests. The study examines data from 60 USA organizations, analyzing the impact of incentives on carbon emissions. The report includes hypothesis testing, a discussion of findings, limitations, and suggestions for further research. The analysis reveals a significant relationship between providing incentives to managers and a reduction in carbon emissions, suggesting that incentives can be an effective tool for environmental policy. The report concludes with references and a detailed analysis of the data, providing valuable insights into the effectiveness of incentive-based approaches to climate change mitigation.
Draft Research Question: Does the incentives provided to the managers to
address the issue of climate change results in percentage reduction in carbon
emission?
Title: Incentives offered to the Mangers and its impact on amount on carbon
emission
Acknowledgement:
I certify that I have carefully reviewed the university’s academic misconduct policy. I
understand that the source of ideas must be referenced and that quotation marks and a
reference are required when directly quoting anyone else’s words.
1
Paraphrase This Document
Need a fresh take? Get an instant paraphrase of this document with our AI Paraphraser
TABLE OF CONTENTS
INTRODUCTION...........................................................................................................................1
LITERATURE REVIEW................................................................................................................1
CONCEPTUAL MODEL................................................................................................................4
HYPOTHESES................................................................................................................................4
DESCRIPTIVE STATISTICS.........................................................................................................5
DATA ANALYSIS – INFERENTIAL...........................................................................................7
HYPOTHESIS TESTING...............................................................................................................7
DISCUSSION................................................................................................................................10
LIMITATIONS..............................................................................................................................11
FURTHER RESEARCH...............................................................................................................11
REFERENCES..............................................................................................................................12
0
INTRODUCTION
The best method for governments to encourage businesses to comply with new
legislations and policies is usually through subsidies and incentives. This use of incentives has
been applied in the implementation of climate change policies globally. However, the incentives
are not always available for all industries. This affects the implementation of the climate change
agenda across the board.
This report will discuss data and information which were being gathered from 60 USA
organization who will be anlsyed on the carbon emission rating. There will be analysis based on
the outcomes derived after implicating the statistical measurements such as Descriptive analysis
and T-test. Moreover, it will calculate data of the organization which pays incentives to their
professionals in context with climate control or firms which do not pay the same.
Moreover, analyzing a concrete solution will draft the revolutionary discussion and
suggestion to implicated by government in terms of changing the operational policies and
making qualitative improvements in operations. On the other side, there will be literature over
stakeholder theories and concepts which will be helpful to an organization in terms of managing
the working capital as well as bringing financial stability in business.
LITERATURE REVIEW
Stakeholder Theory:
As per the views of (Wu & et.al., 2017), a stakeholder theory is comprised of developing
fruitful managerial operations, strategies and interconnection relationship in the business. It
includes all the individual which are having stakes of the firm such as suppliers, customers,
competitors, managers, employees, owners etc. As stated by (Fassin, et al., 2017), the theory had
become key consideration among industries as it helps in effective policy formulation,
identification of business opportunities, bringing innovative concerns in developing operational
activities as well as bringing sustainability in financial aspects of the firm.
1
⊘ This is a preview!⊘
Do you want full access?
Subscribe today to unlock all pages.
Trusted by 1+ million students worldwide
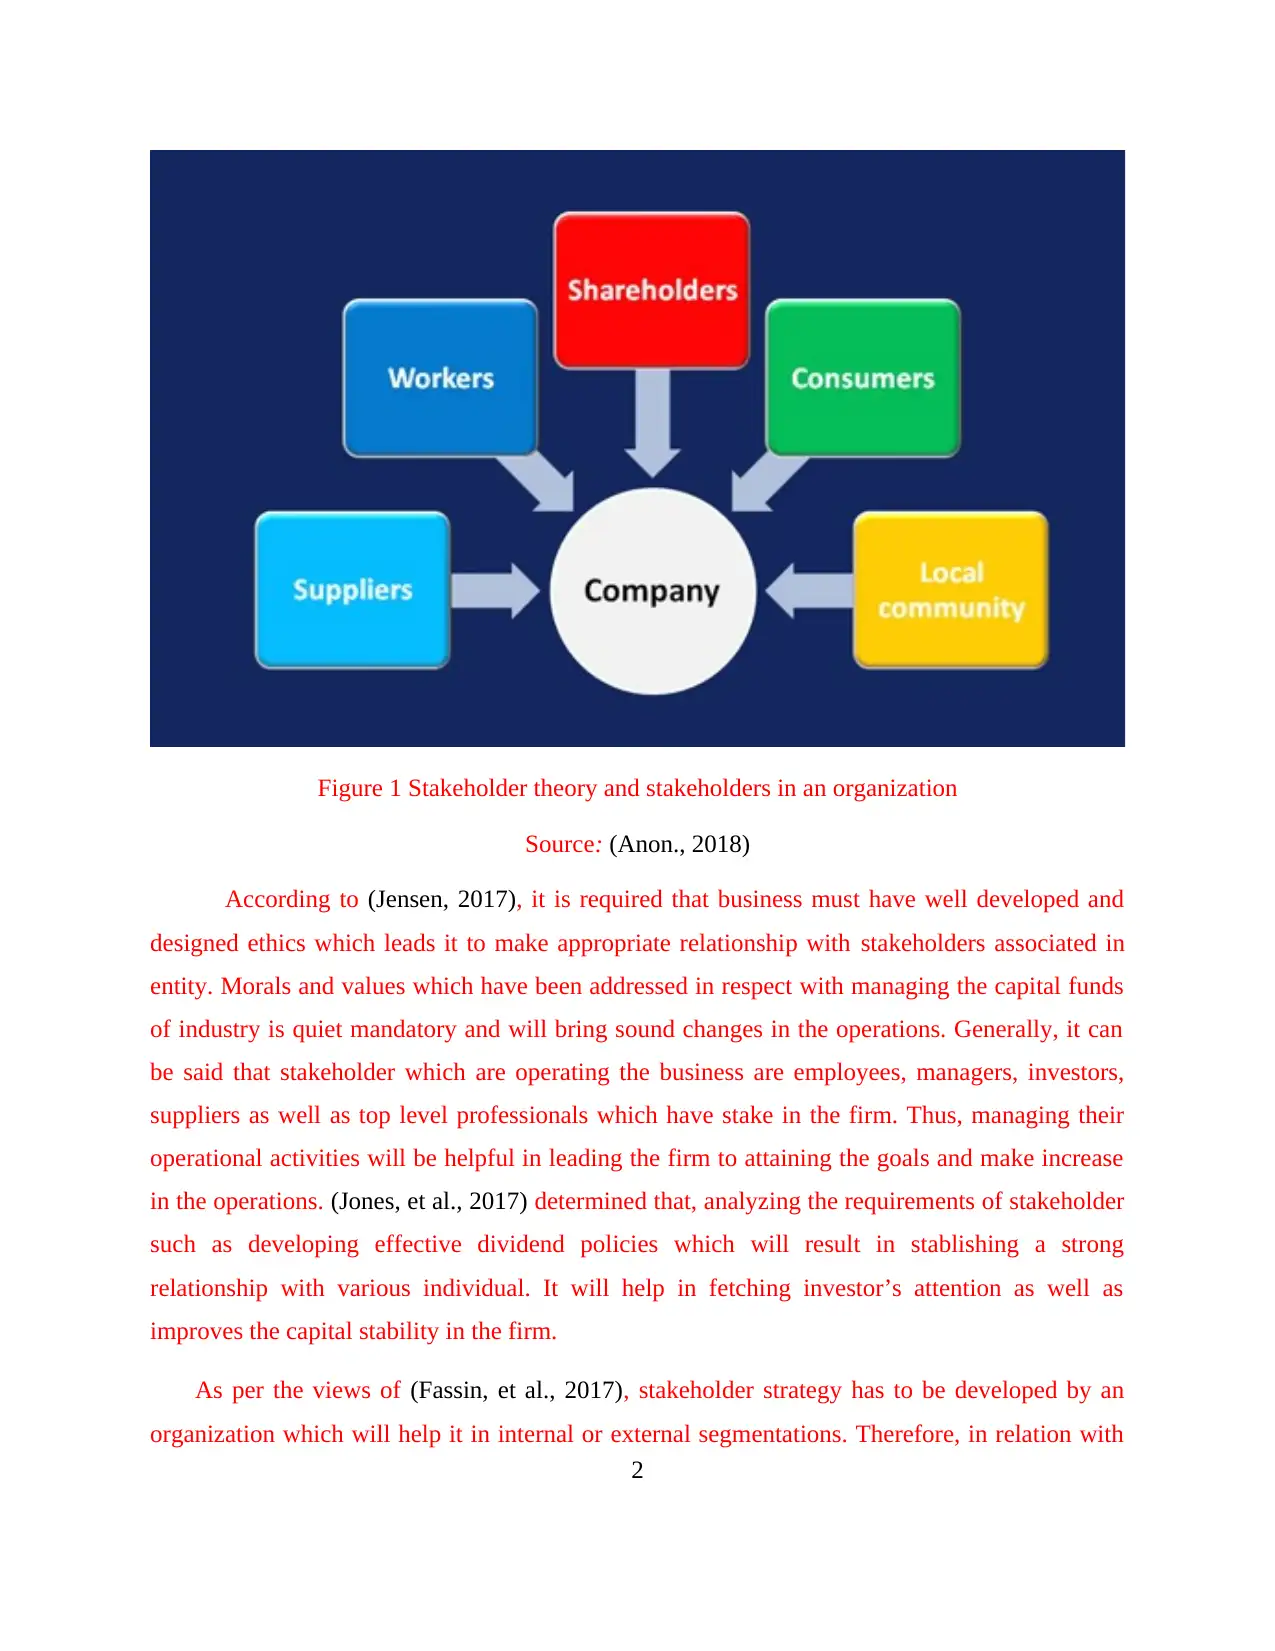
Figure 1 Stakeholder theory and stakeholders in an organization
Source: (Anon., 2018)
According to (Jensen, 2017), it is required that business must have well developed and
designed ethics which leads it to make appropriate relationship with stakeholders associated in
entity. Morals and values which have been addressed in respect with managing the capital funds
of industry is quiet mandatory and will bring sound changes in the operations. Generally, it can
be said that stakeholder which are operating the business are employees, managers, investors,
suppliers as well as top level professionals which have stake in the firm. Thus, managing their
operational activities will be helpful in leading the firm to attaining the goals and make increase
in the operations. (Jones, et al., 2017) determined that, analyzing the requirements of stakeholder
such as developing effective dividend policies which will result in stablishing a strong
relationship with various individual. It will help in fetching investor’s attention as well as
improves the capital stability in the firm.
As per the views of (Fassin, et al., 2017), stakeholder strategy has to be developed by an
organization which will help it in internal or external segmentations. Therefore, in relation with
2
Paraphrase This Document
Need a fresh take? Get an instant paraphrase of this document with our AI Paraphraser
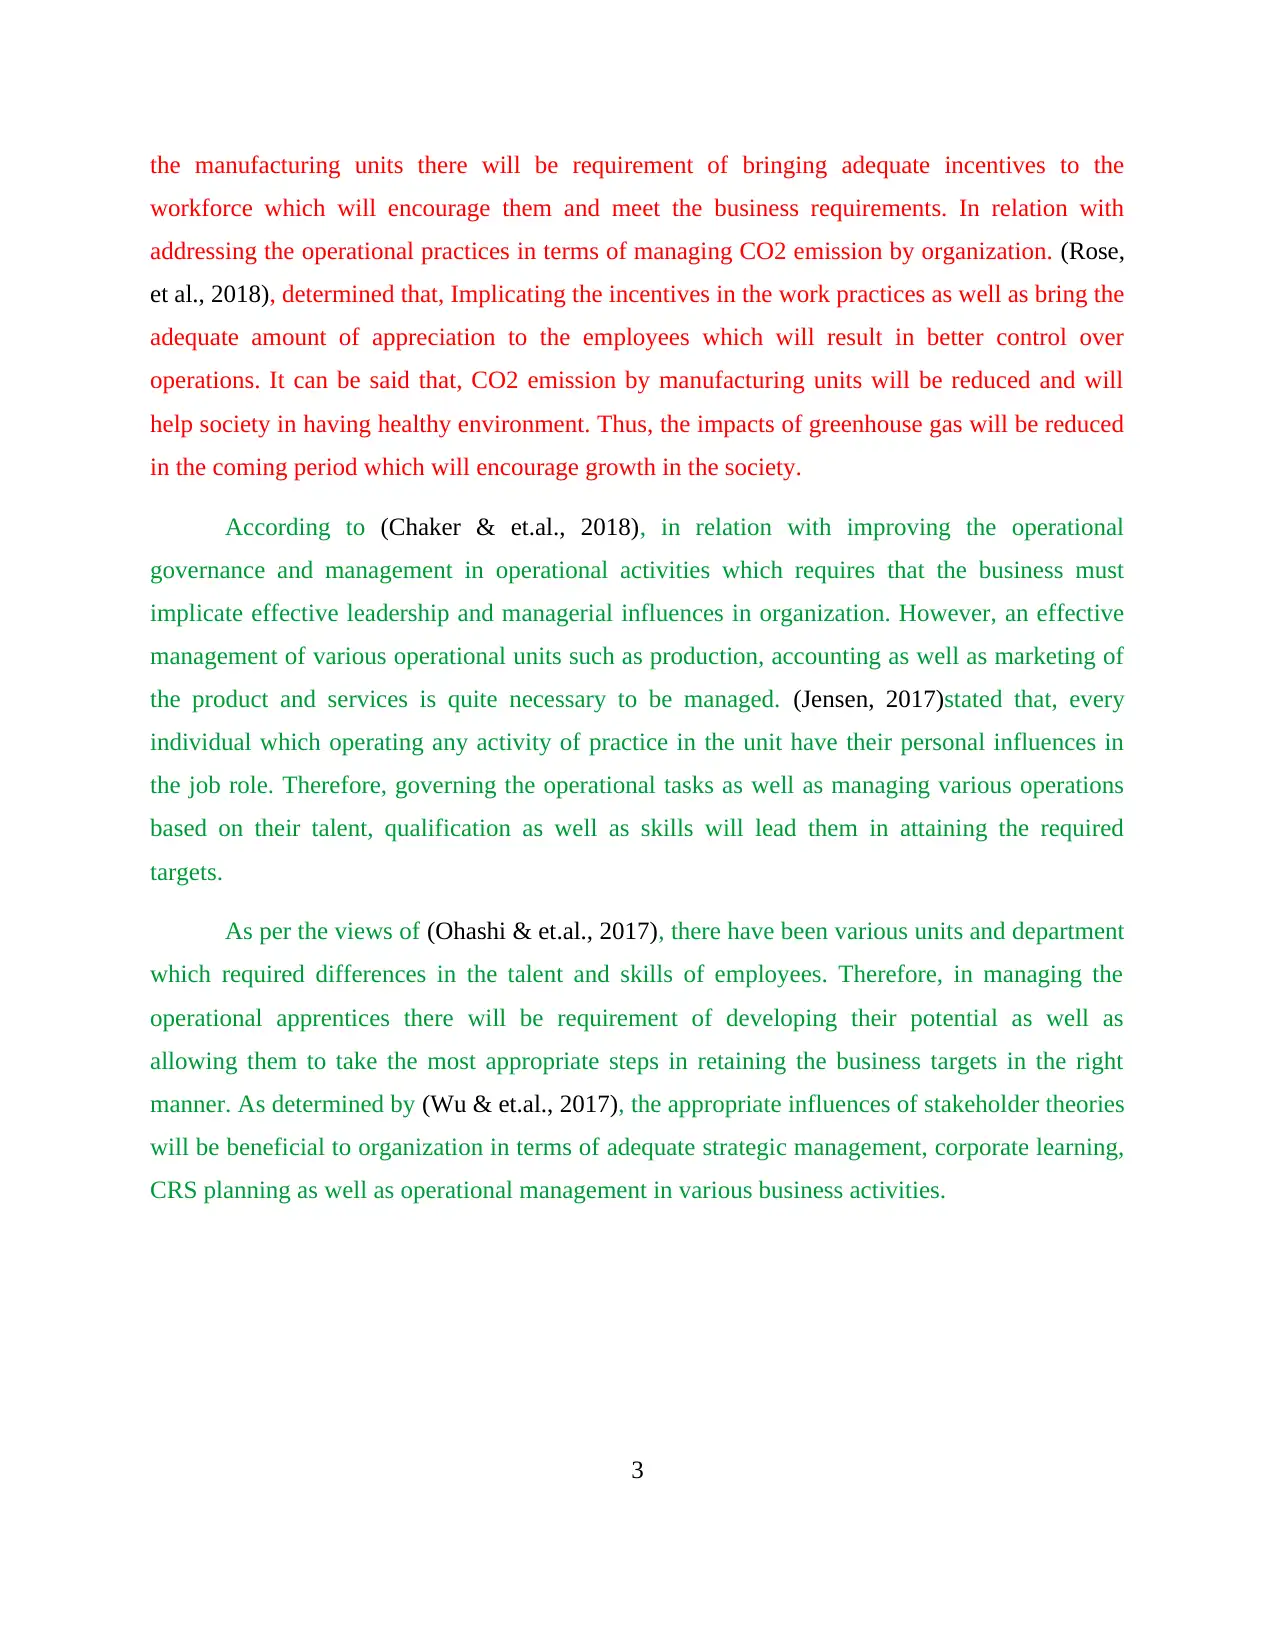
the manufacturing units there will be requirement of bringing adequate incentives to the
workforce which will encourage them and meet the business requirements. In relation with
addressing the operational practices in terms of managing CO2 emission by organization. (Rose,
et al., 2018), determined that, Implicating the incentives in the work practices as well as bring the
adequate amount of appreciation to the employees which will result in better control over
operations. It can be said that, CO2 emission by manufacturing units will be reduced and will
help society in having healthy environment. Thus, the impacts of greenhouse gas will be reduced
in the coming period which will encourage growth in the society.
According to (Chaker & et.al., 2018), in relation with improving the operational
governance and management in operational activities which requires that the business must
implicate effective leadership and managerial influences in organization. However, an effective
management of various operational units such as production, accounting as well as marketing of
the product and services is quite necessary to be managed. (Jensen, 2017)stated that, every
individual which operating any activity of practice in the unit have their personal influences in
the job role. Therefore, governing the operational tasks as well as managing various operations
based on their talent, qualification as well as skills will lead them in attaining the required
targets.
As per the views of (Ohashi & et.al., 2017), there have been various units and department
which required differences in the talent and skills of employees. Therefore, in managing the
operational apprentices there will be requirement of developing their potential as well as
allowing them to take the most appropriate steps in retaining the business targets in the right
manner. As determined by (Wu & et.al., 2017), the appropriate influences of stakeholder theories
will be beneficial to organization in terms of adequate strategic management, corporate learning,
CRS planning as well as operational management in various business activities.
3
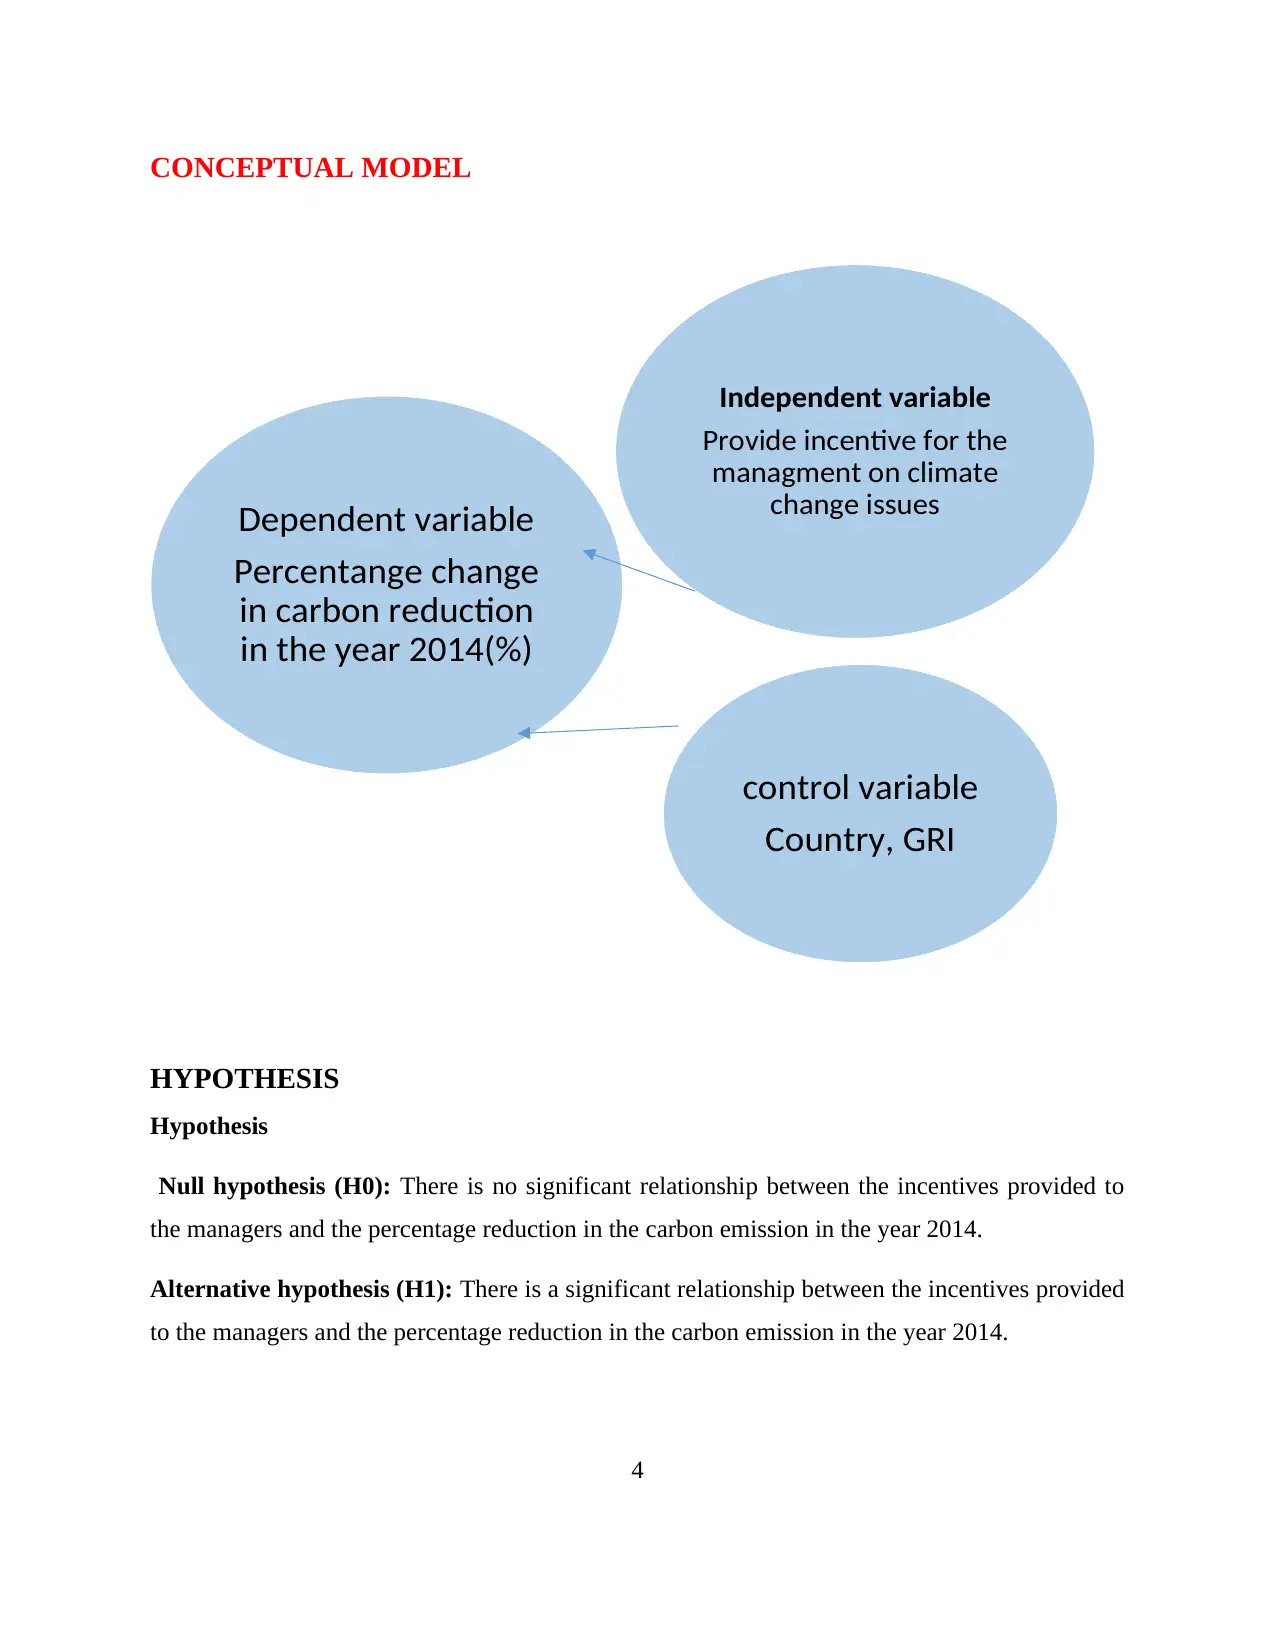
CONCEPTUAL MODEL
HYPOTHESIS
Hypothesis
Null hypothesis (H0): There is no significant relationship between the incentives provided to
the managers and the percentage reduction in the carbon emission in the year 2014.
Alternative hypothesis (H1): There is a significant relationship between the incentives provided
to the managers and the percentage reduction in the carbon emission in the year 2014.
4
Independent variable
Provide incentive for the
managment on climate
change issues
control variable
Country, GRI
Dependent variable
Percentange change
in carbon reduction
in the year 2014(%)
⊘ This is a preview!⊘
Do you want full access?
Subscribe today to unlock all pages.
Trusted by 1+ million students worldwide
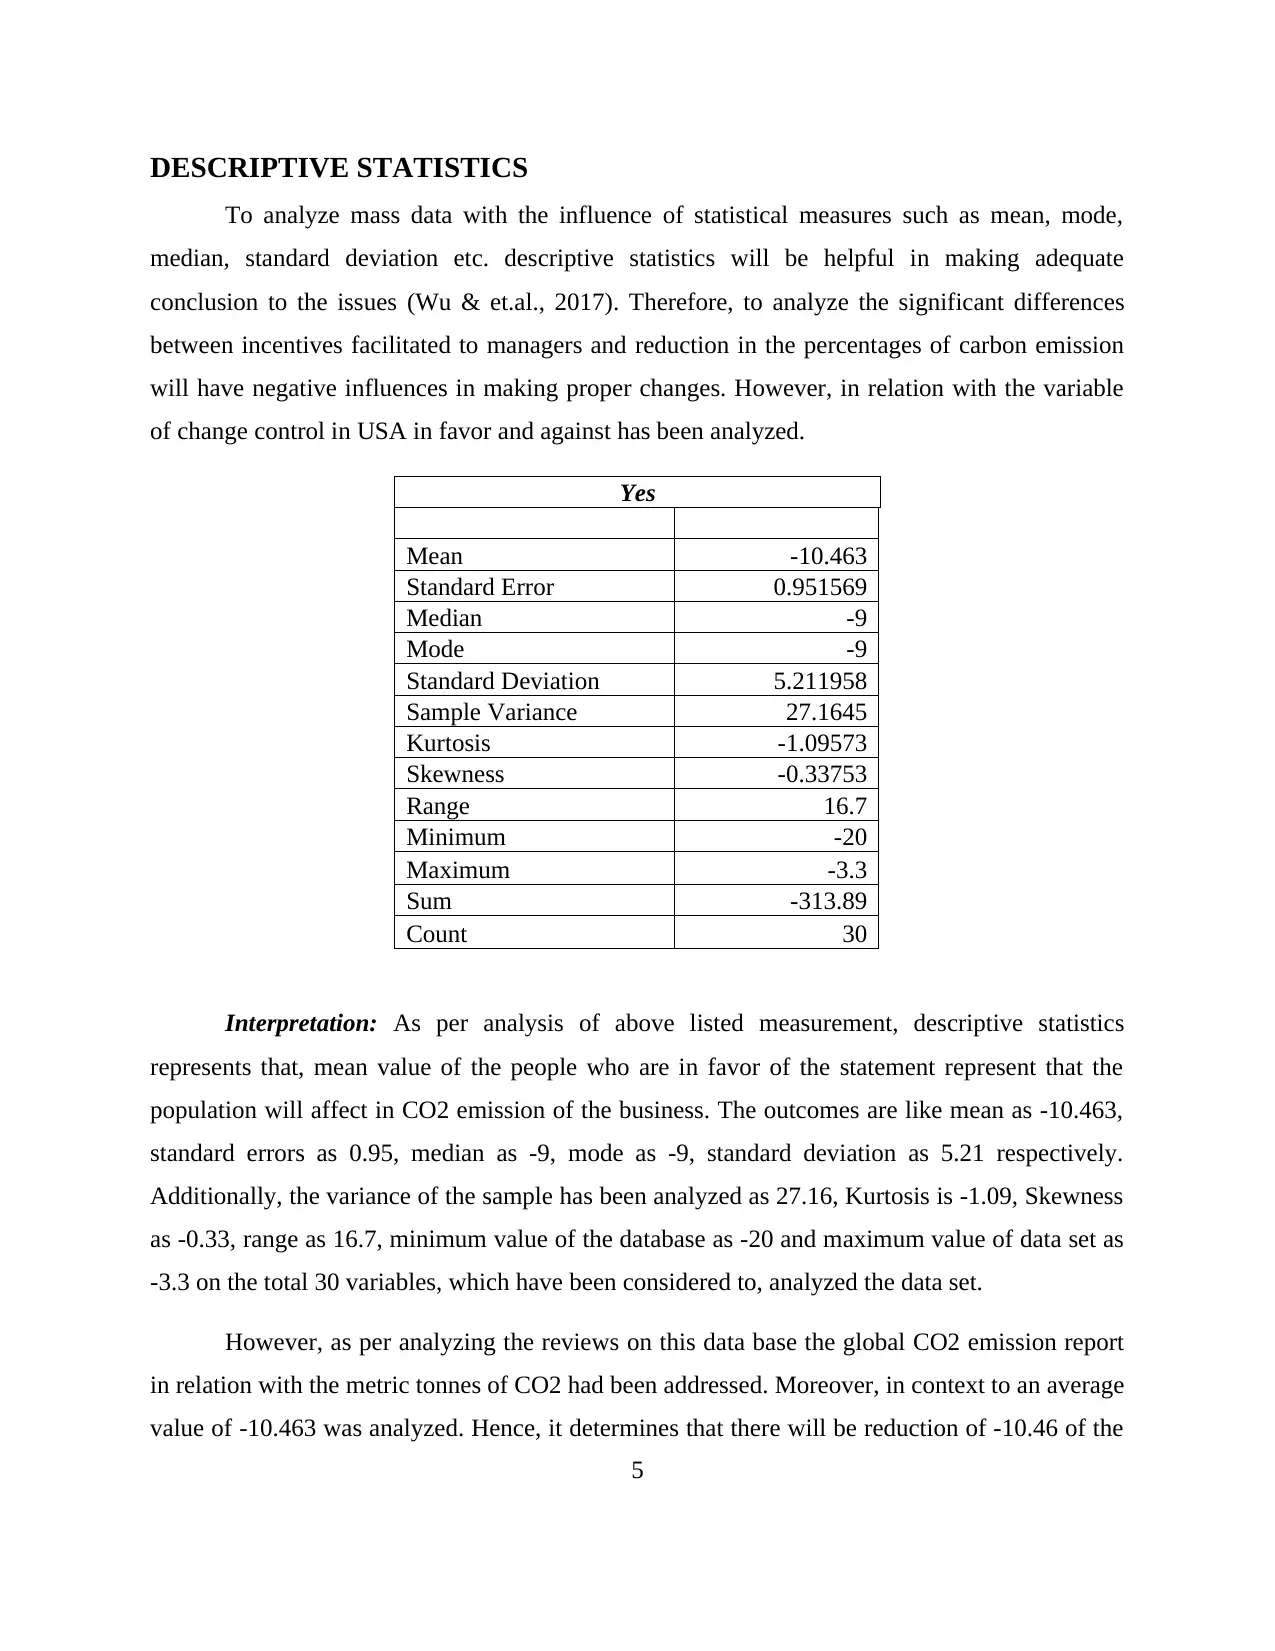
DESCRIPTIVE STATISTICS
To analyze mass data with the influence of statistical measures such as mean, mode,
median, standard deviation etc. descriptive statistics will be helpful in making adequate
conclusion to the issues (Wu & et.al., 2017). Therefore, to analyze the significant differences
between incentives facilitated to managers and reduction in the percentages of carbon emission
will have negative influences in making proper changes. However, in relation with the variable
of change control in USA in favor and against has been analyzed.
Yes
Mean -10.463
Standard Error 0.951569
Median -9
Mode -9
Standard Deviation 5.211958
Sample Variance 27.1645
Kurtosis -1.09573
Skewness -0.33753
Range 16.7
Minimum -20
Maximum -3.3
Sum -313.89
Count 30
Interpretation: As per analysis of above listed measurement, descriptive statistics
represents that, mean value of the people who are in favor of the statement represent that the
population will affect in CO2 emission of the business. The outcomes are like mean as -10.463,
standard errors as 0.95, median as -9, mode as -9, standard deviation as 5.21 respectively.
Additionally, the variance of the sample has been analyzed as 27.16, Kurtosis is -1.09, Skewness
as -0.33, range as 16.7, minimum value of the database as -20 and maximum value of data set as
-3.3 on the total 30 variables, which have been considered to, analyzed the data set.
However, as per analyzing the reviews on this data base the global CO2 emission report
in relation with the metric tonnes of CO2 had been addressed. Moreover, in context to an average
value of -10.463 was analyzed. Hence, it determines that there will be reduction of -10.46 of the
5
Paraphrase This Document
Need a fresh take? Get an instant paraphrase of this document with our AI Paraphraser
CO2 emission globally as per those who are in favor of bringing incentives benefits to their
professionals.
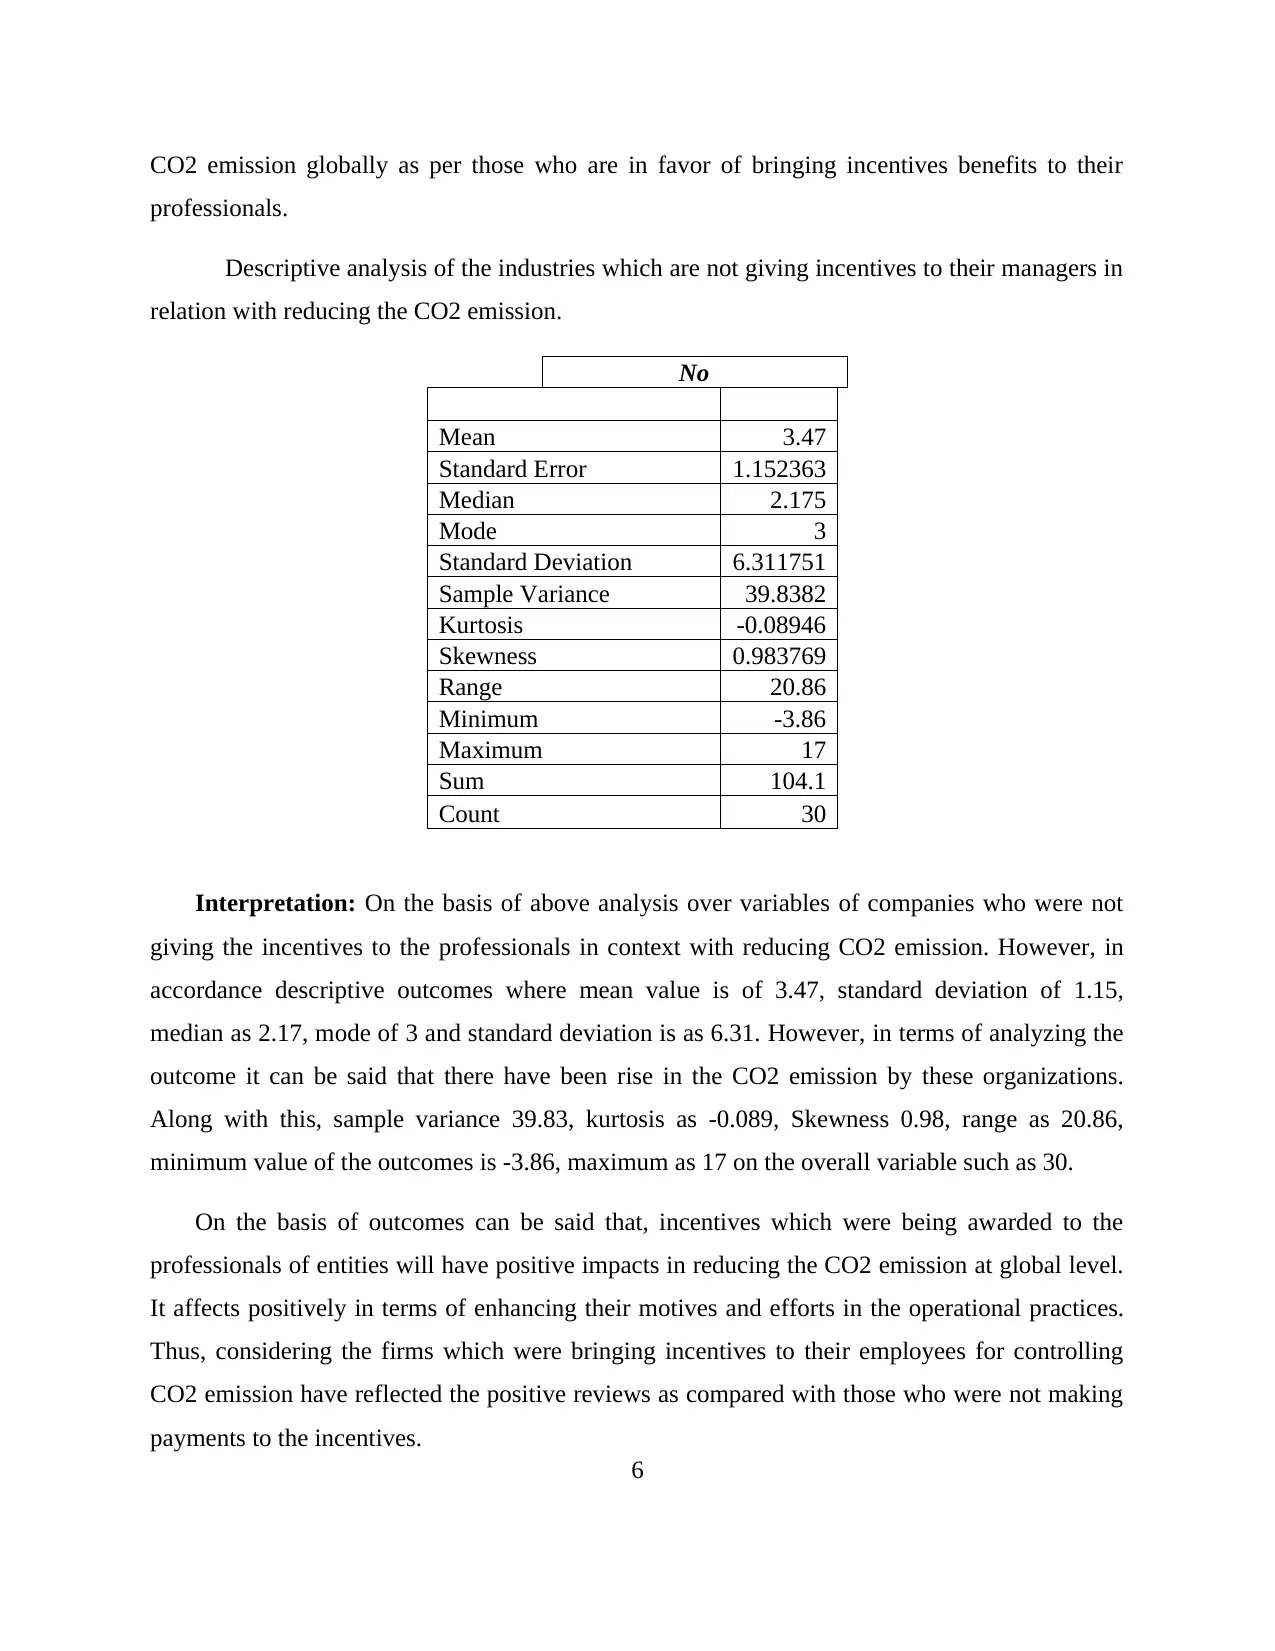
Descriptive analysis of the industries which are not giving incentives to their managers in
relation with reducing the CO2 emission.
No
Mean 3.47
Standard Error 1.152363
Median 2.175
Mode 3
Standard Deviation 6.311751
Sample Variance 39.8382
Kurtosis -0.08946
Skewness 0.983769
Range 20.86
Minimum -3.86
Maximum 17
Sum 104.1
Count 30
Interpretation: On the basis of above analysis over variables of companies who were not
giving the incentives to the professionals in context with reducing CO2 emission. However, in
accordance descriptive outcomes where mean value is of 3.47, standard deviation of 1.15,
median as 2.17, mode of 3 and standard deviation is as 6.31. However, in terms of analyzing the
outcome it can be said that there have been rise in the CO2 emission by these organizations.
Along with this, sample variance 39.83, kurtosis as -0.089, Skewness 0.98, range as 20.86,
minimum value of the outcomes is -3.86, maximum as 17 on the overall variable such as 30.
On the basis of outcomes can be said that, incentives which were being awarded to the
professionals of entities will have positive impacts in reducing the CO2 emission at global level.
It affects positively in terms of enhancing their motives and efforts in the operational practices.
Thus, considering the firms which were bringing incentives to their employees for controlling
CO2 emission have reflected the positive reviews as compared with those who were not making
payments to the incentives.
6
professionals.
Descriptive analysis of the industries which are not giving incentives to their managers in
relation with reducing the CO2 emission.
No
Mean 3.47
Standard Error 1.152363
Median 2.175
Mode 3
Standard Deviation 6.311751
Sample Variance 39.8382
Kurtosis -0.08946
Skewness 0.983769
Range 20.86
Minimum -3.86
Maximum 17
Sum 104.1
Count 30
Interpretation: On the basis of above analysis over variables of companies who were not
giving the incentives to the professionals in context with reducing CO2 emission. However, in
accordance descriptive outcomes where mean value is of 3.47, standard deviation of 1.15,
median as 2.17, mode of 3 and standard deviation is as 6.31. However, in terms of analyzing the
outcome it can be said that there have been rise in the CO2 emission by these organizations.
Along with this, sample variance 39.83, kurtosis as -0.089, Skewness 0.98, range as 20.86,
minimum value of the outcomes is -3.86, maximum as 17 on the overall variable such as 30.
On the basis of outcomes can be said that, incentives which were being awarded to the
professionals of entities will have positive impacts in reducing the CO2 emission at global level.
It affects positively in terms of enhancing their motives and efforts in the operational practices.
Thus, considering the firms which were bringing incentives to their employees for controlling
CO2 emission have reflected the positive reviews as compared with those who were not making
payments to the incentives.
6
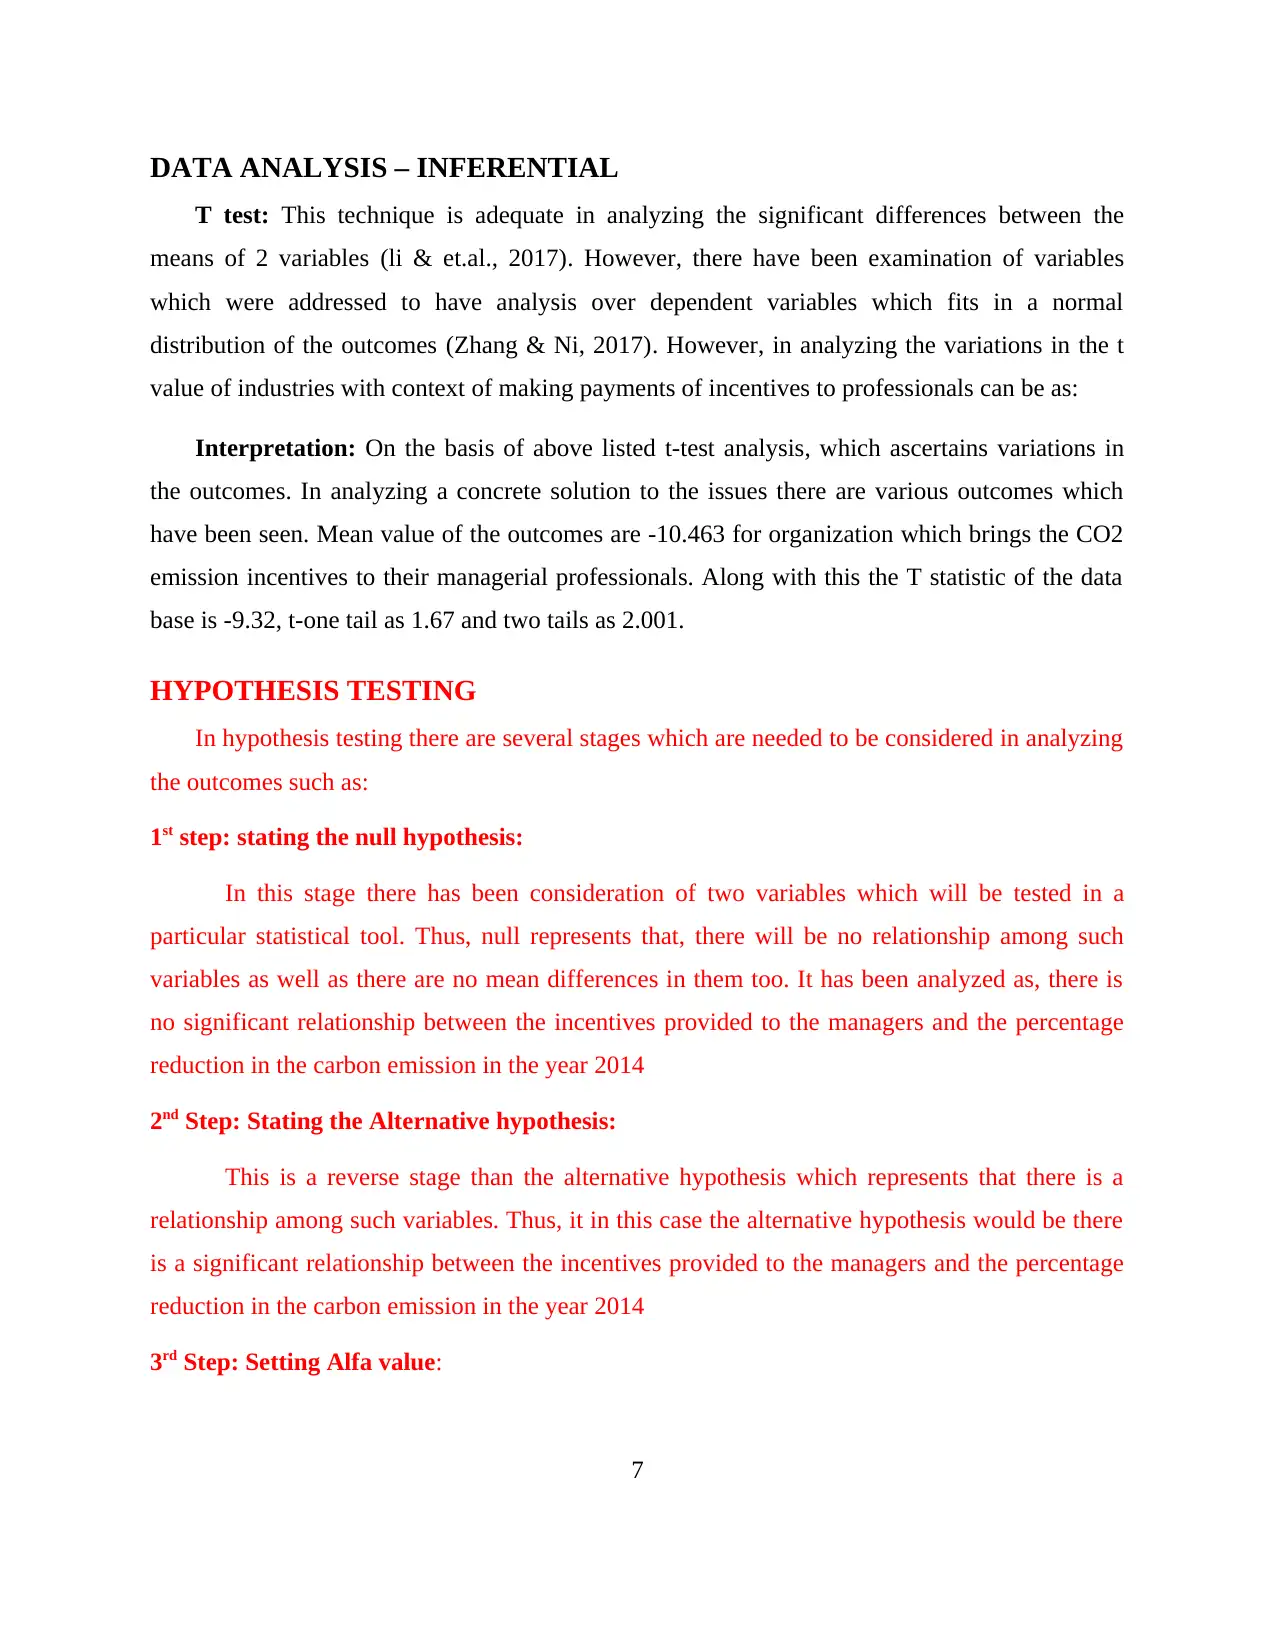
DATA ANALYSIS – INFERENTIAL
T test: This technique is adequate in analyzing the significant differences between the
means of 2 variables (li & et.al., 2017). However, there have been examination of variables
which were addressed to have analysis over dependent variables which fits in a normal
distribution of the outcomes (Zhang & Ni, 2017). However, in analyzing the variations in the t
value of industries with context of making payments of incentives to professionals can be as:
Interpretation: On the basis of above listed t-test analysis, which ascertains variations in
the outcomes. In analyzing a concrete solution to the issues there are various outcomes which
have been seen. Mean value of the outcomes are -10.463 for organization which brings the CO2
emission incentives to their managerial professionals. Along with this the T statistic of the data
base is -9.32, t-one tail as 1.67 and two tails as 2.001.
HYPOTHESIS TESTING
In hypothesis testing there are several stages which are needed to be considered in analyzing
the outcomes such as:
1st step: stating the null hypothesis:
In this stage there has been consideration of two variables which will be tested in a
particular statistical tool. Thus, null represents that, there will be no relationship among such
variables as well as there are no mean differences in them too. It has been analyzed as, there is
no significant relationship between the incentives provided to the managers and the percentage
reduction in the carbon emission in the year 2014
2nd Step: Stating the Alternative hypothesis:
This is a reverse stage than the alternative hypothesis which represents that there is a
relationship among such variables. Thus, it in this case the alternative hypothesis would be there
is a significant relationship between the incentives provided to the managers and the percentage
reduction in the carbon emission in the year 2014
3rd Step: Setting Alfa value:
7
⊘ This is a preview!⊘
Do you want full access?
Subscribe today to unlock all pages.
Trusted by 1+ million students worldwide
This states that, there will be selection of a confidence level which will bring the
outcomes on such value. Therefore, in this case the alfa value is 0.05 which determines that
confidence level as 95%.
4th Step: collection of data:
It considers the gathered information must be based on observations and experimental
designs which will be helpful in generating the relevant outcomes.
5th Step: Calculating a test statistic:
It is necessary to set a category of test which will be made on the variables. Therefore, in
this case there had been use of paired samples test.
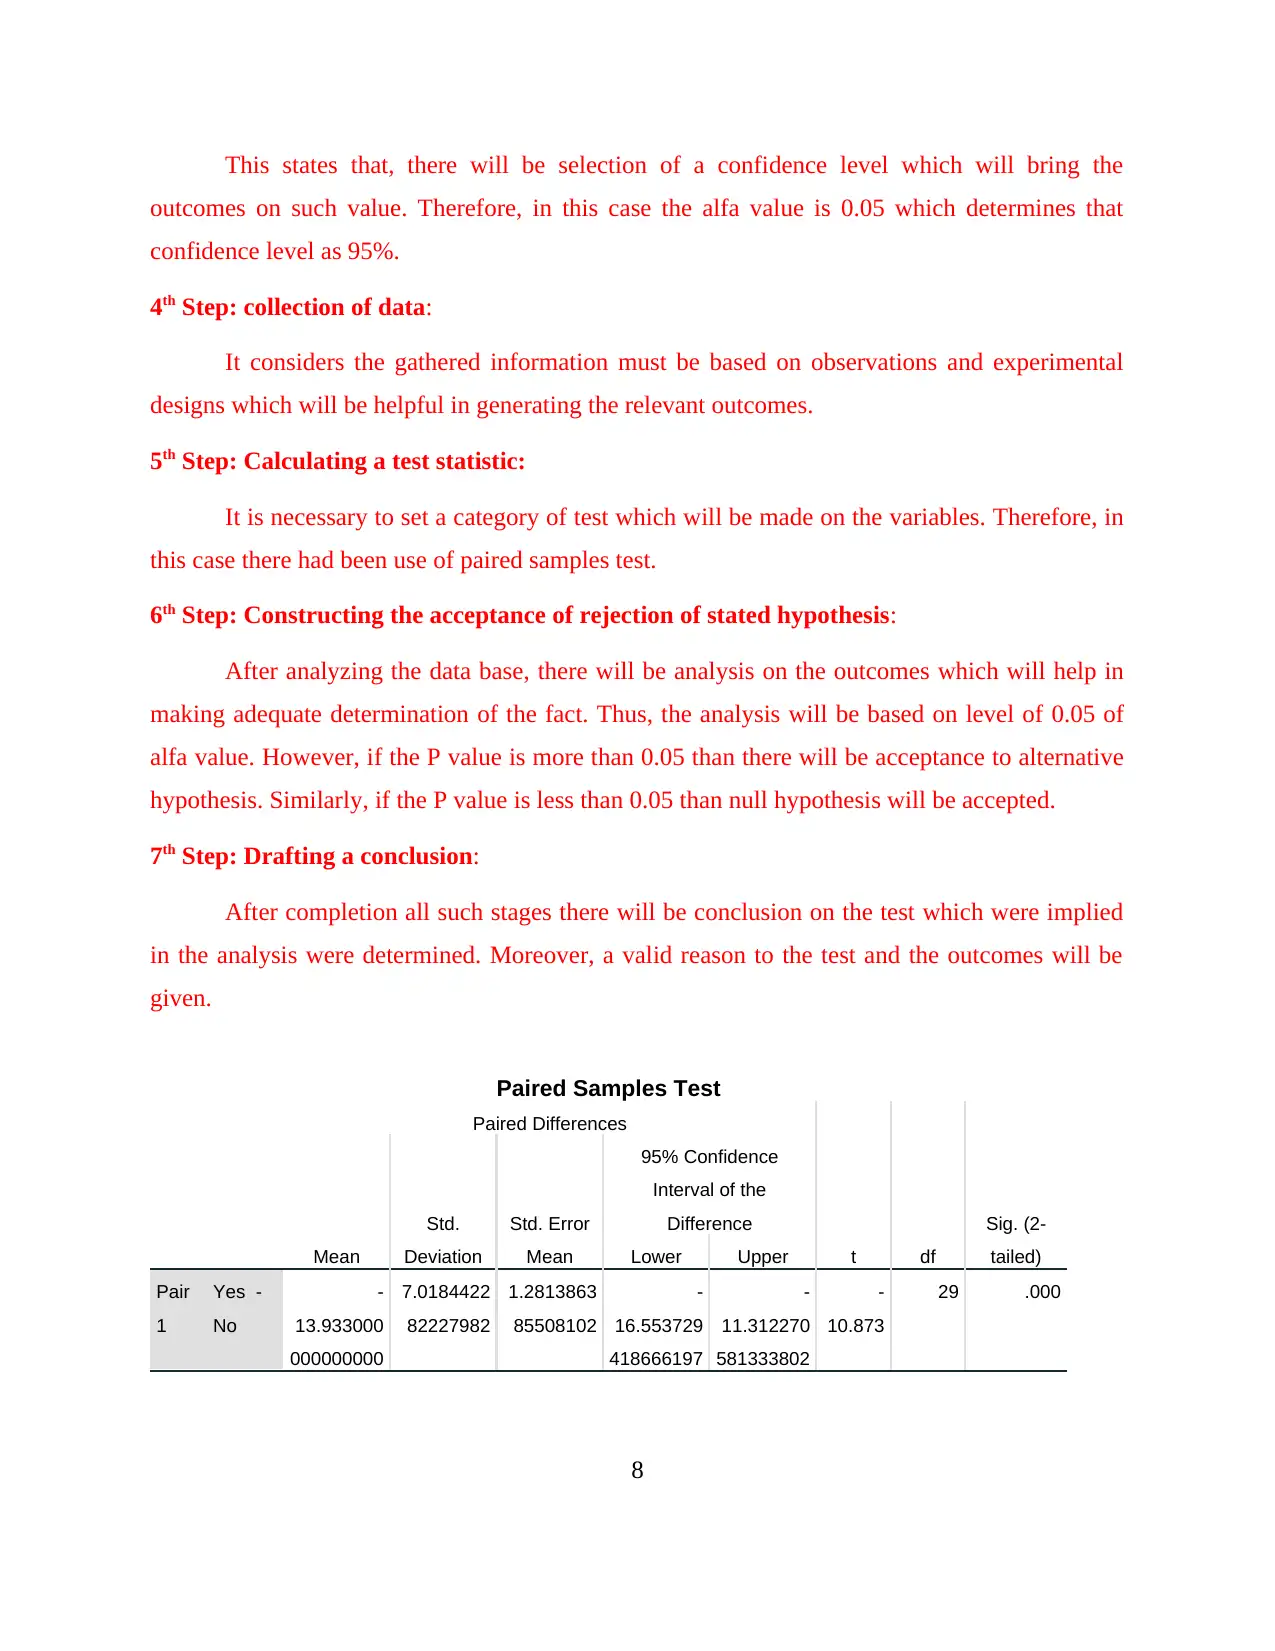
6th Step: Constructing the acceptance of rejection of stated hypothesis:
After analyzing the data base, there will be analysis on the outcomes which will help in
making adequate determination of the fact. Thus, the analysis will be based on level of 0.05 of
alfa value. However, if the P value is more than 0.05 than there will be acceptance to alternative
hypothesis. Similarly, if the P value is less than 0.05 than null hypothesis will be accepted.
7th Step: Drafting a conclusion:
After completion all such stages there will be conclusion on the test which were implied
in the analysis were determined. Moreover, a valid reason to the test and the outcomes will be
given.
Paired Samples Test
Paired Differences
t df
Sig. (2-
tailed)Mean
Std.
Deviation
Std. Error
Mean
95% Confidence
Interval of the
Difference
Lower Upper
Pair
1
Yes -
No
-
13.933000
000000000
7.0184422
82227982
1.2813863
85508102
-
16.553729
418666197
-
11.312270
581333802
-
10.873
29 .000
8
outcomes on such value. Therefore, in this case the alfa value is 0.05 which determines that
confidence level as 95%.
4th Step: collection of data:
It considers the gathered information must be based on observations and experimental
designs which will be helpful in generating the relevant outcomes.
5th Step: Calculating a test statistic:
It is necessary to set a category of test which will be made on the variables. Therefore, in
this case there had been use of paired samples test.
6th Step: Constructing the acceptance of rejection of stated hypothesis:
After analyzing the data base, there will be analysis on the outcomes which will help in
making adequate determination of the fact. Thus, the analysis will be based on level of 0.05 of
alfa value. However, if the P value is more than 0.05 than there will be acceptance to alternative
hypothesis. Similarly, if the P value is less than 0.05 than null hypothesis will be accepted.
7th Step: Drafting a conclusion:
After completion all such stages there will be conclusion on the test which were implied
in the analysis were determined. Moreover, a valid reason to the test and the outcomes will be
given.
Paired Samples Test
Paired Differences
t df
Sig. (2-
tailed)Mean
Std.
Deviation
Std. Error
Mean
95% Confidence
Interval of the
Difference
Lower Upper
Pair
1
Yes -
No
-
13.933000
000000000
7.0184422
82227982
1.2813863
85508102
-
16.553729
418666197
-
11.312270
581333802
-
10.873
29 .000
8
Paraphrase This Document
Need a fresh take? Get an instant paraphrase of this document with our AI Paraphraser
Interpretation: On the basis of above listed sample test it can be said that, Organizations
which are bringing the incentives to the professionals as well as which are not bringing any
incentives has -13.93. Standard deviation of the data base can be analyzed as 7.02. Moreover, the
significant 2 tailed outcomes have been determined as 0.000. However, as per analyzing P value
of the outcomes on which these outcomes are comparatively less than the required level such as
0.05. Thus, in this case there will be rejection to the null hypothesis. In addition, it can eb said
that, there is a significant relationship between the incentives provided to the managers and the
percentage reduction in the carbon emission in the year 2014.
9
DISCUSSION
On the basis of above listed analysis on which it can be said that, implication of various
techniques will help in bringing adequate returns to professionals. The analysis has been based
on examining the global reports based on CO2 emission and incentives awarded to the
professionals (Huang & et.al.,, 2017). Thus, in consideration with the outcomes where, those
organization which were giving the incentives to their managerial professionals based on CO2
emission has resulted an average reduction of -10.463 in report.
On the other side, those industries which were not making any payment to professionals in
terms of incentives have reflected increment in CO2 emission reports. Thus, as per such
outcomes it can be said that, businesses have to make payment to their employees for incentives
which will bring them motivation as well as encourage them to reduce the CO2 emission (Yang
& et.al., 2017). Along with this, it will also help to environment for having effective operational
control and management of various operations.
Moreover, implication this technique will bring suitable gains and increment in the
operational level of these industries as well as control over the pollution caused by them (Chaker
& et.al., 2018). Moreover, as per analyzing the outcome where it can be said that there will be
acceptance to the alternative hypothesis. Thus, it determines that, there is a significant
relationship between the incentives provided to the managers and the percentage reduction in the
carbon emission in the year 2014.
However, in relation with managing the business operations there will be consideration of
various theories which are needed to be taken into practice such as Stakeholder theories. In
relation with bringing them the appropriate incentive which will be beneficial in uplifting their
moral and motives towards firm. There can be rise in the operational efficiencies as well as
positive results have been seen in context with the reduction of CO2 emission. Along with this,
operational performance of these organization will be increased and which will be fruitful to the
environment as well as organization for effective growth and development.
As per analyzing the wants and demands of professionals as well as benefiting them will
allowances such as monetary benefits, incentives which will result in effective commitment.
10
⊘ This is a preview!⊘
Do you want full access?
Subscribe today to unlock all pages.
Trusted by 1+ million students worldwide
1 out of 16
Related Documents


Your All-in-One AI-Powered Toolkit for Academic Success.
+13062052269
info@desklib.com
Available 24*7 on WhatsApp / Email
![[object Object]](/_next/static/media/star-bottom.7253800d.svg)
Unlock your academic potential
Copyright © 2020–2026 A2Z Services. All Rights Reserved. Developed and managed by ZUCOL.