Managerial Economics Assignment on Market Dynamics and Profit

Verified

Added on  2020/04/21

|12
|1257
|68
Homework Assignment
AI Summary
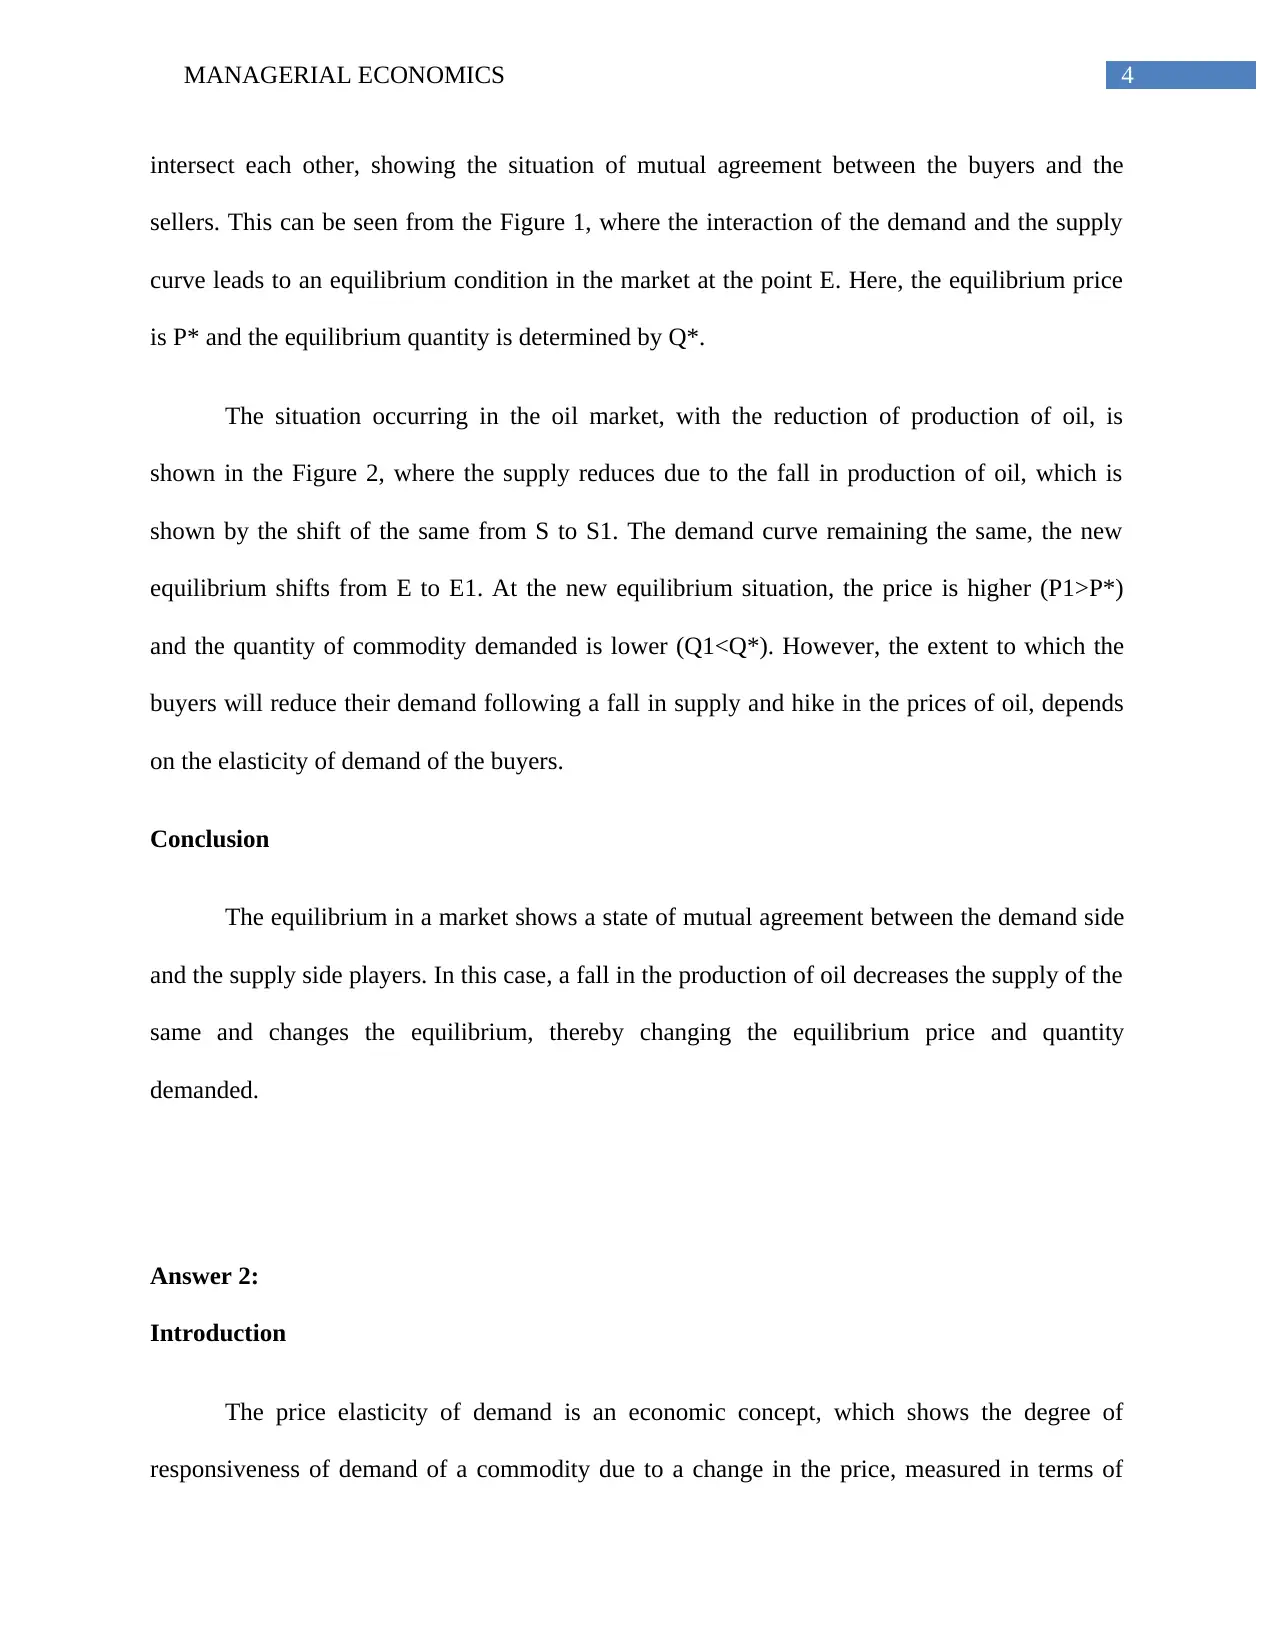
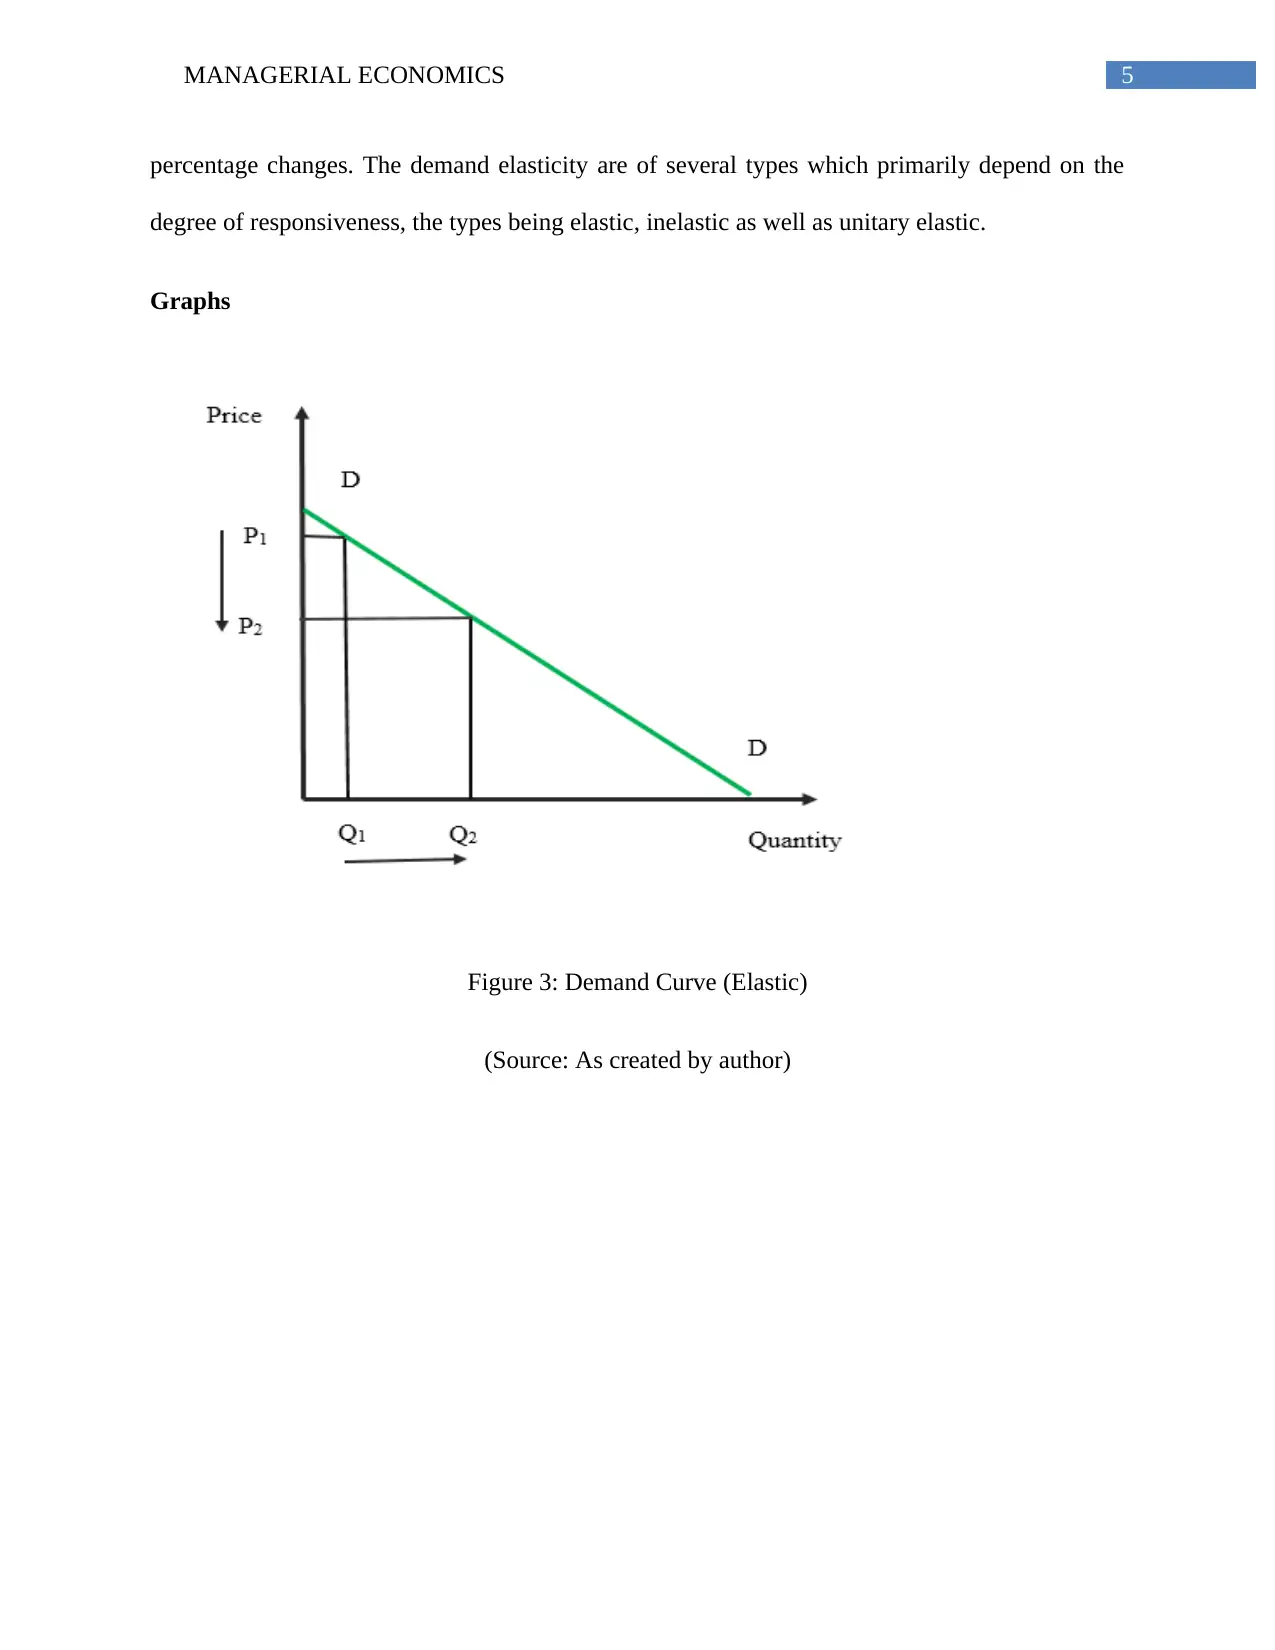
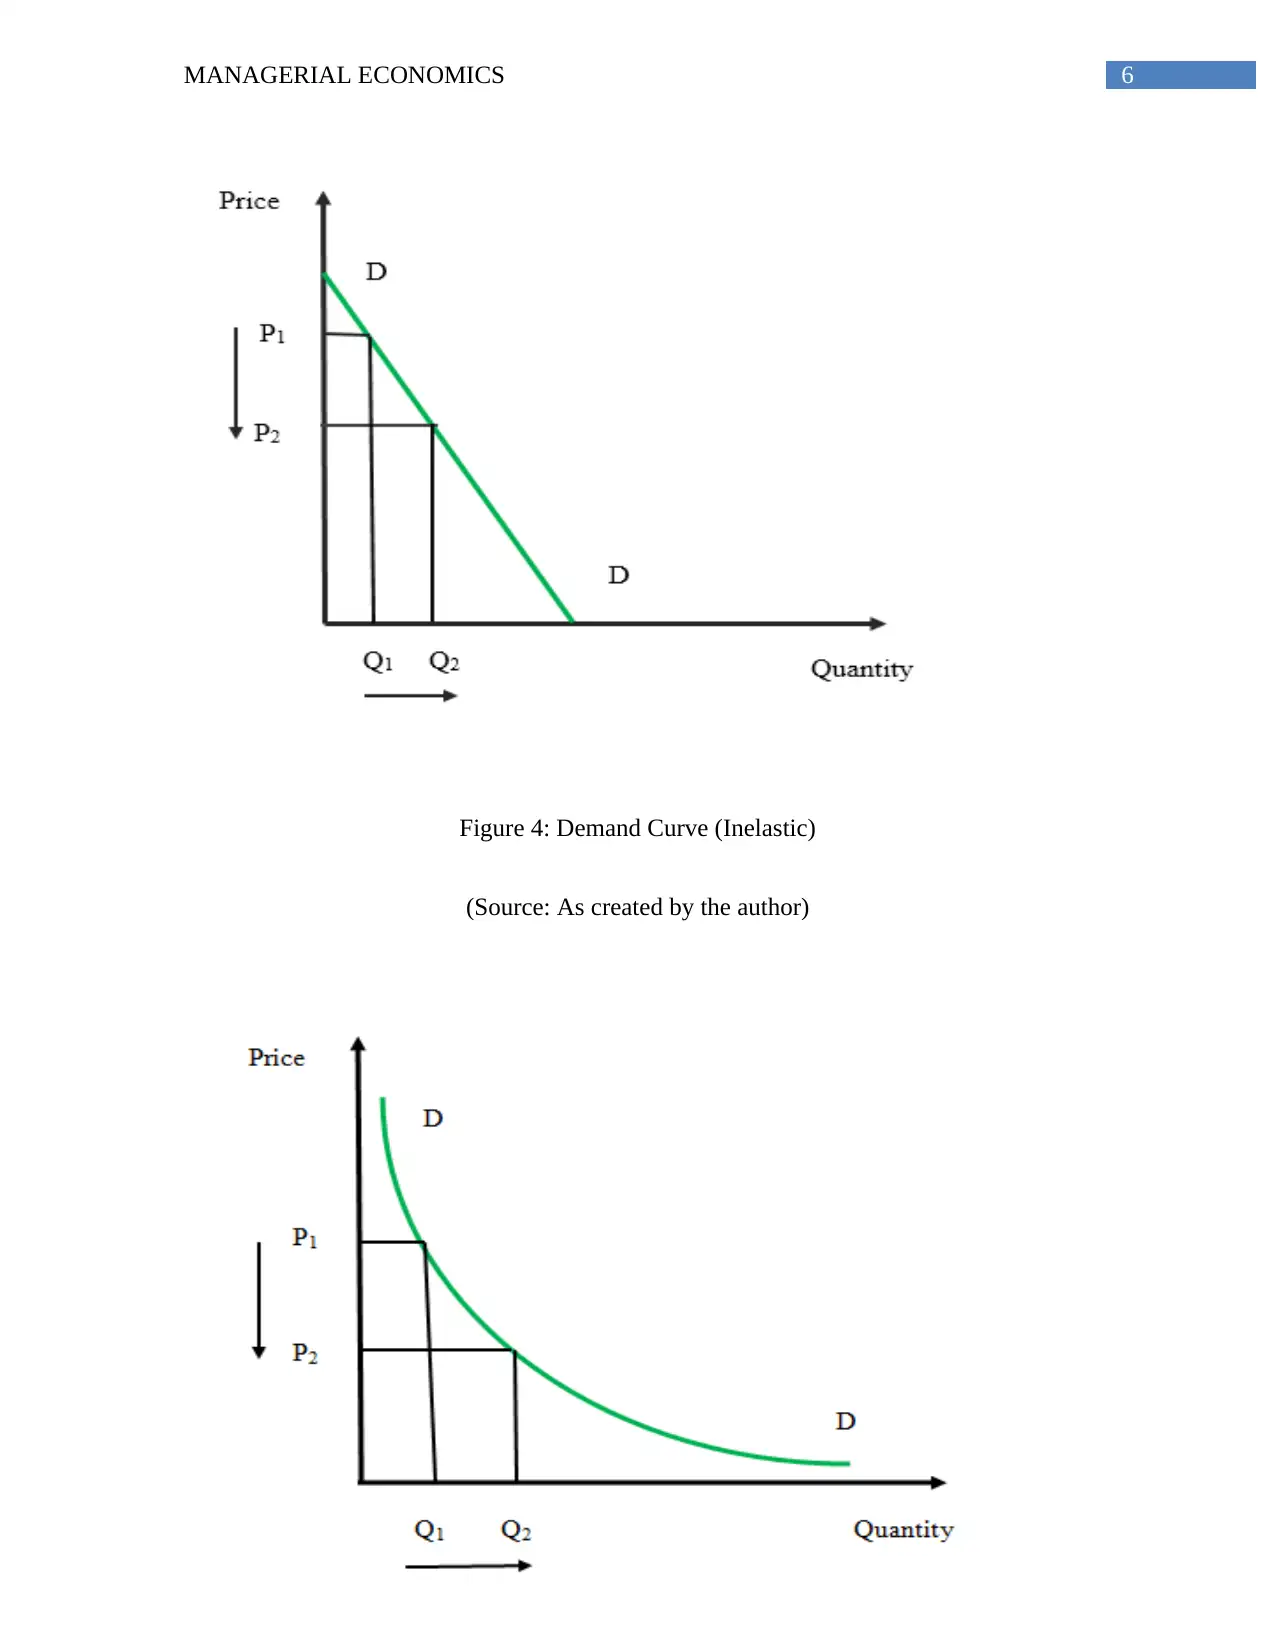
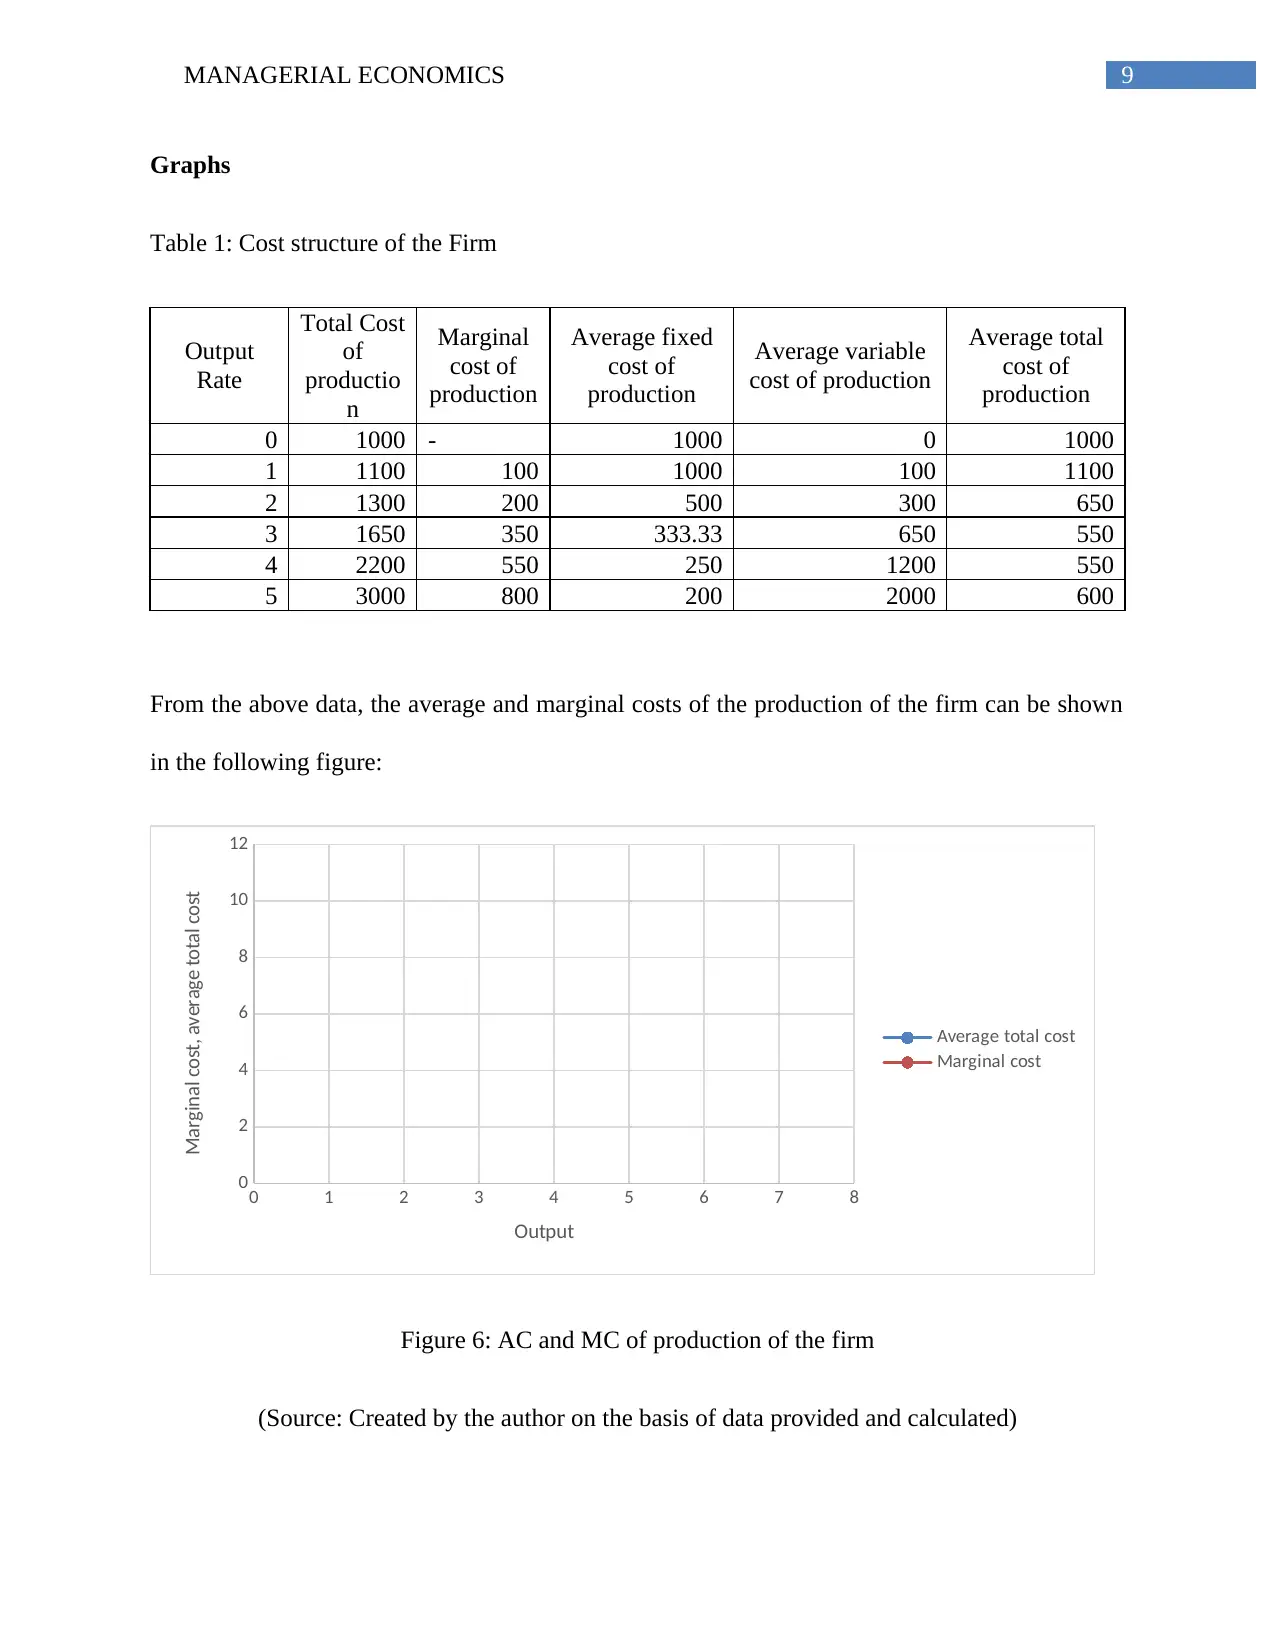
This managerial economics assignment explores core concepts including market equilibrium, elasticity of demand, and cost structures. The first section analyzes market equilibrium, illustrating how supply and demand interact to determine prices and quantities, and demonstrating the impact of shifts in supply, such as a reduction in oil production. The second section focuses on price elasticity of demand, categorizing demand as elastic, inelastic, or unitary elastic, with examples of each. The final section examines profit maximization, showing how firms aim to minimize average costs, using a cost structure table and a graph to determine the output level at which average cost is minimized. The assignment provides a comprehensive overview of these key economic principles.
Document Page
Running head: MANAGERIAL ECONOMICS
Managerial Economics
Name of the Student
Name of the University
Author Note
tabler-icon-diamond-filled.svg

Paraphrase This Document

Need a fresh take? Get an instant paraphrase of this document with our AI Paraphraser
Document Page
1MANAGERIAL ECONOMICS
Table of Contents
Answer 1:.........................................................................................................................................2
Answer 2:.........................................................................................................................................4
Answer 3:.........................................................................................................................................8
References......................................................................................................................................11
Document Page
2MANAGERIAL ECONOMICS
Answer 1:
Introduction
In markets, the goods and services are transacted because of two facts. One of them is the
fact that people cannot produce everything, which is consumed by people, solely. On the other
hand, focusing on the production of a particular good helps in increasing in the efficiency in
production of the good and also leads to production of the same in an increased amount. The
equilibrium in market, is determined by the mutual interactions of the demand and the supply
forces. Thus, when there are changes in the supply and demand forces of a particular good or
service, the reactions of the buyers and the sellers change accordingly, which in its turn, leads to
a change in the equilibrium in the market (Hall and Lieberman 2012).
Graphs
Figure 1: Determination of Equilibrium with the help of Demand and Supply
Document Page
3MANAGERIAL ECONOMICS
(Source: As created by the author)
Figure 2: Changes due to a fall in the production of oil
(Source: As created by the author)
Discussion
The demand factor in any market shows the buyer’s side dynamics. Demand curve is the
representation of the willingness of a buyer to avail some good or service, backed by their
purchasing power, at different levels of the prices for the same commodity. The seller’s side
dynamics, on the other hand, is represented by the supply side. The supply curve is the graphical
representation of the willingness of the sellers to sell their products at different levels of prices.
The equilibrium occurs, in the market, at the point where the demand curve and the supply curve
tabler-icon-diamond-filled.svg

Paraphrase This Document

Need a fresh take? Get an instant paraphrase of this document with our AI Paraphraser
Document Page
4MANAGERIAL ECONOMICS
intersect each other, showing the situation of mutual agreement between the buyers and the
sellers. This can be seen from the Figure 1, where the interaction of the demand and the supply
curve leads to an equilibrium condition in the market at the point E. Here, the equilibrium price
is P* and the equilibrium quantity is determined by Q*.
The situation occurring in the oil market, with the reduction of production of oil, is
shown in the Figure 2, where the supply reduces due to the fall in production of oil, which is
shown by the shift of the same from S to S1. The demand curve remaining the same, the new
equilibrium shifts from E to E1. At the new equilibrium situation, the price is higher (P1>P*)
and the quantity of commodity demanded is lower (Q1<Q*). However, the extent to which the
buyers will reduce their demand following a fall in supply and hike in the prices of oil, depends
on the elasticity of demand of the buyers.
Conclusion
The equilibrium in a market shows a state of mutual agreement between the demand side
and the supply side players. In this case, a fall in the production of oil decreases the supply of the
same and changes the equilibrium, thereby changing the equilibrium price and quantity
demanded.
Answer 2:
Introduction
The price elasticity of demand is an economic concept, which shows the degree of
responsiveness of demand of a commodity due to a change in the price, measured in terms of
Document Page
5MANAGERIAL ECONOMICS
percentage changes. The demand elasticity are of several types which primarily depend on the
degree of responsiveness, the types being elastic, inelastic as well as unitary elastic.
Graphs
Figure 3: Demand Curve (Elastic)
(Source: As created by author)
Document Page
6MANAGERIAL ECONOMICS
Figure 4: Demand Curve (Inelastic)
(Source: As created by the author)
tabler-icon-diamond-filled.svg

Paraphrase This Document

Need a fresh take? Get an instant paraphrase of this document with our AI Paraphraser
Document Page
7MANAGERIAL ECONOMICS
Figure 5: Demand Curve (Unitary Elastic)
(Source: As created by the author)
Discussion
The elasticity of demand of a commodity depends on the nature of the goods and services
demanded by the consumers. When due to a small change in price, the demand for the good
changes more than proportionately, then the elasticity of demand of the same is greater than 1
and the demand is said to be relatively elastic. Examples of these types of commodities are
mainly luxury commodities like diamonds, pleasure travels and others. Figure 3 shows the elastic
demand curve, the extreme case of which leads to perfect elasticity of demand for which the
demand curve becomes parallel to the horizontal axis.
Document Page
8MANAGERIAL ECONOMICS
When the changes in price lead to less than proportionate changes in demand of a
commodity then the demand for the same is said to have an elasticity less than 1 and are said to
be inelastic in demand. Most common examples of the same are the necessary commodities. The
most extreme case of the same is the case of perfectly inelastic demand in which there exists a
vertical demand curve.
Unitary elastic demand shows the situation when due to a change in price the demand
changes proportionately and the elasticity of demand is 1. Figure 5 shows the demand curve in
this type of hypothetical situation, the demand curve being a rectangular hyperbola (Rader 2014).
Conclusion
The price elasticity of demand, as discussed above, shows the changes in demand due to
change in prices of the goods and services and the same varies according to the nature of the
goods and the demand dynamics of the same.
Answer 3:
Introduction
The primary objective of any producer of goods and services in an economy is to
maximize their own profit. In the long run, the profit maximization occurs at the point where the
average cost of the firm is minimum.
Document Page
9MANAGERIAL ECONOMICS
Graphs
Table 1: Cost structure of the Firm
Output
Rate
Total Cost
of
productio
n
Marginal
cost of
production
Average fixed
cost of
production
Average variable
cost of production
Average total
cost of
production
0 1000 - 1000 0 1000
1 1100 100 1000 100 1100
2 1300 200 500 300 650
3 1650 350 333.33 650 550
4 2200 550 250 1200 550
5 3000 800 200 2000 600
From the above data, the average and marginal costs of the production of the firm can be shown
in the following figure:
0 1 2 3 4 5 6 7 8
0
2
4
6
8
10
12
Average total cost
Marginal cost
Output
Marginal cost, average total cost
Figure 6: AC and MC of production of the firm
(Source: Created by the author on the basis of data provided and calculated)
tabler-icon-diamond-filled.svg

Paraphrase This Document

Need a fresh take? Get an instant paraphrase of this document with our AI Paraphraser
Document Page
10MANAGERIAL ECONOMICS
Discussion
It can be seen from the above data and figure that the minimum AC is 550 and this occurs
at the point where the output produced is 3 units.
Conclusion
The objective of the firm being maximization of profit, the equilibrium occurs at the
point of minimum AC, which in this case is 550 and is achieved when the output is 3 units.
Document Page
11MANAGERIAL ECONOMICS
References
Hall, R.E. and Lieberman, M., 2012. Microeconomics: Principles and applications. Cengage
Learning.
Rader, T., 2014. Theory of microeconomics. Academic Press.
chevron_up_icon
1 out of 12
circle_padding
hide_on_mobile
zoom_out_icon
[object Object]