FINA6000: Case Study on Australian IPOs and Finance Management
VerifiedAdded on 2023/03/30
|21
|2982
|273
Case Study
AI Summary
This case study examines the efficiency of Initial Public Offerings (IPOs) conducted in Australia from 2007 to 2013, focusing on three companies: iSelect, Sandon Capital Investments, and Virtus Health. The analysis assesses the funds raised, their intended uses, and the actual outcomes, including debt reduction and capital expansion. The study evaluates the returns generated on the first day of trading, identifying levels of underpricing, and calculates the cost of capital post-IPO for each company. Furthermore, it explores the IPO activity in Australia, correlating it with capital market conditions and providing a detailed comparison of returns for the selected IPOs over a five-year period. The findings highlight the impact of market dynamics on IPO success and the importance of understanding underpricing and cost of capital in financial decision-making.

Running head: MANAGING FINANCE
Managing Finance
Name of the Student:
Name of the University:
Authors Note:
Managing Finance
Name of the Student:
Name of the University:
Authors Note:
Paraphrase This Document
Need a fresh take? Get an instant paraphrase of this document with our AI Paraphraser

MANAGING FINANCE
1
Table of Contents
Introduction:...............................................................................................................................2
Answer to a:...............................................................................................................................2
Answer to b:...............................................................................................................................3
Answer to c:...............................................................................................................................4
Answer to d:...............................................................................................................................6
Answer to e:...............................................................................................................................7
Answer to f:................................................................................................................................9
Conclusion:..............................................................................................................................14
References and Bibliography:..................................................................................................15

MANAGING FINANCE
2
Introduction:
The aim of the assessment is to detect efficiency of the IPOs that has been conducted
in Australia over the period of time. There is adequate analysis conducted on the overall IPOs
which tissue during 2013 whose main purpose was to acquire the required level of funding
support their future expansion and debt combination. Moreover, the assessment evaluates the
overall returns that have been generated by the initial public offering during the first day of
trade. In addition, this relevant comparison of the first day return is relatively conducted to
identify the levels of underpricing which is present within the initial public offerings of
organization. Further evaluation has been conducted on the overall value of cost of capital
that has already changed for the organizations after the initial public offering. Lastly,
adequate measures are taken to provide information about the IPO activity in Australia and
relevant returns that has been provided by the three selected IPO during five financial years..
Answer to a:
Company
Name
Industry Date
of
IPO
Amount
intended to
raise
Amount
actually
raised
The purpose of the funds
iSelect health
insurance
Jun-
13
$215m $215m The main purpose of the fund
acquisition it to reduce debt and
increase acquisition of
additional capital funding’s
Sandon
Capital
Investments
Diversified
financial
Dec-
13
$100m $100m The fund acquisition is
conducted to increase the
relevant fund, which might help
in minimising the risk exposure
⊘ This is a preview!⊘
Do you want full access?
Subscribe today to unlock all pages.
Trusted by 1+ million students worldwide

MANAGING FINANCE
3
of the organisation
Virtus Health Healthcare
Equipment
Jun-
13
$346.5m $346.5m The IPO funding is required by
the organisation for minimising
the exposure of debt in their
capital requirements
The companies initiating the IPO structure has adequately gather all the relevant
funding for their operational needs. The purpose of the funds have been meet adequately, as
all the three companies were able to gather the relevant funding from their share issue.
Company iSelect
Sandon Capital
Investments Virtus Health
Industry
health
insurance Diversified financial
Healthcare
Equipment
Date of IPO 6/1/2013 12/1/2013 6/1/2013
Amount Raised $215m $100m $346.5m
Offer price $215m $100m $346.5m
Offer price 1.85 0.9835 5.68
Closing price on first day of
trading 1.55 0.95 6.28
Return on first day of trading -16.22% -3.41% 10.56%
Answer to b:
iSelect 2014
Growth(retention) 15.0%
Closing price 1.385
Dividend 0.0786
Cost of capital 20.7%
Sandon Capital
Investments 2014
Growth(retention) 5.0%
Closing price 0.945
Dividend 0.17
Cost of capital 22.76%
Paraphrase This Document
Need a fresh take? Get an instant paraphrase of this document with our AI Paraphraser

MANAGING FINANCE
4
Virtus Health 2014
Growth(retention) 16.0%
Closing price 8.31
Dividend 0.095
Cost of capital 17.1%
The above calculations shed light on the overall cost of capital for all the three
companies that have initiated the initial public offering during the financial year 2013. The
cost of capital has been derived during 2014 by adequately identifying all the relevant values
from the annual report. The analysis directly indicates that cost of capital of the organization
was relatively zero, as the companies were not trading shares in the capital market, which is
the main reason why the actual cost of the capital is not derived. From the analysis, it could
be identified that the dividend anticipated by the organization with the growth conditions is a
relatively helpful in detecting the cost of capital for each organization. The detection of the
cost of capital would eventually allow the investors to identify the level of returns that needs
to be provided by the companies during the financial year. The range of cost of capital is
derived from the relevant growth conditions that are anticipated by the organization for its
future dividends. Therefore, it could be understood that the overall cost of capital for each
IPO is directly related to financial benefits that would be provided by the organization to the
shareholders (Au.finance.yahoo.com, 2019).
Answer to c:
Company iSelect
Sandon Capital
Investments Virtus Health
Industry
health
insurance Diversified financial
Healthcare
Equipment
Date of IPO 6/1/2013 12/1/2013 6/1/2013
Amount Raised $215m $100m $346.5m
Offer amount $215m $100m $346.5m
Offer price 1.85 0.9835 5.68
Closing price on first day of 1.55 0.95 6.28

MANAGING FINANCE
5
trading
Return on first day of trading -16.22% -3.41% 10.56%
Underpricing is a relevant concern for major organizations, as they are not able to
identify the level of Capital that would be generated from the overall initial public offering.
The underpricing measure directly impact the overall price of the organization, as investors
are focused on reducing the offer price of an organization to effectively generate higher
returns on the first day of trade. The above calculations and directly indicated that only the
IPO of Virtus Health was subject to underpricing method, as it generated a return of 10.56%
in the first day of trade. Hence, underpricing is present under different industries, which led
to the underpricing of Virtus Health IPO, as calculated in the above table. This mainly
indicated that the actual valuation of the company was higher, as the investors used the
underpricing method to reduce the initial public offering price of the organization. This is the
main reason why the overall returns on the first day of trade is relatively higher. The negative
impact of underpricing is relevantly present throughout the industry, as relevant research has
been conducted on the Australian market, which indicates that more than 33% of the IPOs
that are conducted during the year are underpriced. The confirmation is relevantly provided
from the analysis of the above table, where one of the three IPOs was affected by
underpricing effect (Asx.com.au, 2019).
⊘ This is a preview!⊘
Do you want full access?
Subscribe today to unlock all pages.
Trusted by 1+ million students worldwide

MANAGING FINANCE
6
Answer to d:
2008 2009 2010 2011 2012 2013 2014 2015 2016 2017
-100.00%
-50.00%
0.00%
50.00%
100.00%
150.00%
Return Activity of IPO Return ALL Ordinary Index
Yea
r ALL Ordinary Index
Activity of
IPO Return
2007 6,416.7 260.0 ALL Ordinary Index Activity of IPO
2008 3,659.3 75.0 -42.97% -71.15%
2009 4,882.7 42.0 33.43% -44.00%
2010 4,846.9 99.0 -0.73% 135.71%
2011 4,111.0 105.0 -15.18% 6.06%
2012 4,664.6 51.0 13.47% -51.43%
2013 5,353.1 61.0 14.76% 19.61%
2014 5,388.6 73.0 0.66% 19.67%
2015 5,344.6 97.0 -0.82% 32.88%
2016 5,719.1 94.0 7.01% -3.09%
2017 6,167.3 115.0 7.84% 22.34%
The above table provides information about the IPO activity that has been derived
from different sources of Deloitte. From the relevant analysis, it could be identified that the
IPO activity is directly related to the overall financial performance of the capital market.
From the analysis, it could be identified that the before the financial crisis IPO was relatively
at its peak where 260 companies conducted the first public offering. However, the negative
impact of the financial crisis on the capital market has directly reduced due to the low
Paraphrase This Document
Need a fresh take? Get an instant paraphrase of this document with our AI Paraphraser

MANAGING FINANCE
7
performance of the capital market. The initial public offerings in Australia are directly related
to its capital market conditions, where relevant decline in the capital market performance is
directly reflected on the number of |IPOs conducted during the year. The progress of the
financial crisis started to increase, which is the level of IPOs conducted each year.
Nevertheless, the short recession occurred during 2012 negatively affected the overall IPOs
in the country, as a capital market was not performing adequately. Hence, it could be
identified that after the 2013 the IPOs in Australia started to increase gradually, due to the
improvements that was achieved by its capital market. Thus, it could be understood that the
company wait for the capital market to perform well before imitating their IPO, as it helps
them to complete the process successfully and acquire the required funding from their public
offerings (Indoorskydiveaustralia.com.au, 2013).
Answer to e:
Return without dividends
Date
All Ordinary
Index
Virtus
Health Ltd
Sandon Capital
Investments Ltd
iSelect
Ltd
30-06-2013 5.45% 10.23% -5.88%
31-07-2013 1.78% 4.78% -11.25%
31-08-2013 1.80% 10.60% -11.27%
30-09-2013 3.88% 0.73% 3.97%
31-10-2013 -1.96% 6.02% -6.87%
30-11-2013 0.73% -0.68% 18.44%
31-12-2013 -2.76% -4.92% -2.02% -4.15%
31-01-2014 4.04% -5.66% 0.00% -21.66%
28-02-2014 -0.23% -7.14% 0.53% 5.07%
31-03-2014 1.25% 1.92% 0.00% -1.32%
30-04-2014 0.05% 11.32% 3.78% 8.00%
31-05-2014 -1.68% -1.21% -4.15% -5.35%
30-06-2014 4.48% -3.80% 4.76% 7.39%
31-07-2014 0.03% -0.64% 3.11% -2.02%
31-08-2014 -5.83% -0.38% -5.96% 16.94%
30-09-2014 3.93% -4.12% -3.65% -3.18%
31-10-2014 -3.76% -6.31% 7.51% -6.57%
30-11-2014 1.71% 12.46% -7.99% 0.39%
MANAGING FINANCE
8
31-12-2014 3.02% 2.29% 9.06% -5.06%
31-01-2015 6.25% -2.24% -0.03% 20.08%
28-02-2015 -0.62% -6.62% -8.78% 1.37%
31-03-2015 -1.50% 4.23% 4.95% 2.69%
30-04-2015 0.02% 1.57% 4.93% 2.95%
31-05-2015 -5.61% -30.80% -13.68% -8.28%
30-06-2015 4.23% 0.00% 4.05% 22.22%
31-07-2015 -8.09% -4.10% 0.00% -17.61%
31-08-2015 -3.13% 5.44% -1.11% 3.79%
30-09-2015 4.55% 16.21% 7.49% -0.33%
31-10-2015 -1.33% 2.69% -10.11% -11.67%
30-11-2015 2.42% 0.31% -1.16% -14.72%
31-12-2015 -5.39% -2.62% 13.53% -20.35%
31-01-2016 -2.15% -5.06% -11.40% -1.67%
29-02-2016 4.12% 4.16% -0.58% 16.38%
31-03-2016 3.19% 7.99% 9.72% 11.17%
30-04-2016 2.48% 4.88% -12.61% -4.37%
31-05-2016 -2.52% -3.10% -1.84% 13.70%
30-06-2016 6.28% 12.52% 24.21% 4.42%
31-07-2016 -2.03% 5.30% -8.42% 11.15%
31-08-2016 -0.08% -5.41% -0.55% 28.72%
30-09-2016 -2.22% -9.48% -0.55% -2.15%
31-10-2016 1.85% -17.36% 7.22% 5.77%
30-11-2016 3.94% 8.33% 6.75% -1.82%
31-12-2016 -0.77% -18.11% -4.86% -7.94%
31-01-2017 1.52% 5.87% 12.24% 11.78%
28-02-2017 2.48% 6.84% -2.73% 1.80%
31-03-2017 0.74% 0.69% -6.50% 0.51%
30-04-2017 -3.13% -3.61% -6.04% 5.53%
31-05-2017 0.05% -4.10% 0.00% -4.29%
30-06-2017 0.17% 4.28% 3.19% 3.98%
31-07-2017 0.04% 3.39% 2.58% -19.14%
31-08-2017 -0.54% -3.79% 1.22% -5.33%
30-09-2017 4.03% -1.79% -1.70% -0.31%
31-10-2017 0.79% -5.11% 0.00% -10.34%
30-11-2017 2.39% 1.15% 1.77% 0.35%
31-12-2017 -0.34% -0.38% -1.24% -9.06%
31-01-2018 -0.48% 10.11% 0.00% -7.28%
28-02-2018 -4.06% -6.24% 0.04% -15.70%
31-03-2018 3.45% 4.44% 1.47% -44.12%
30-04-2018 0.85% -2.12% -4.46% 9.65%
31-05-2018 2.71% 3.98% 3.03% 30.40%
Average 0.51% 0.13% 0.28% -0.37%
⊘ This is a preview!⊘
Do you want full access?
Subscribe today to unlock all pages.
Trusted by 1+ million students worldwide
MANAGING FINANCE
9
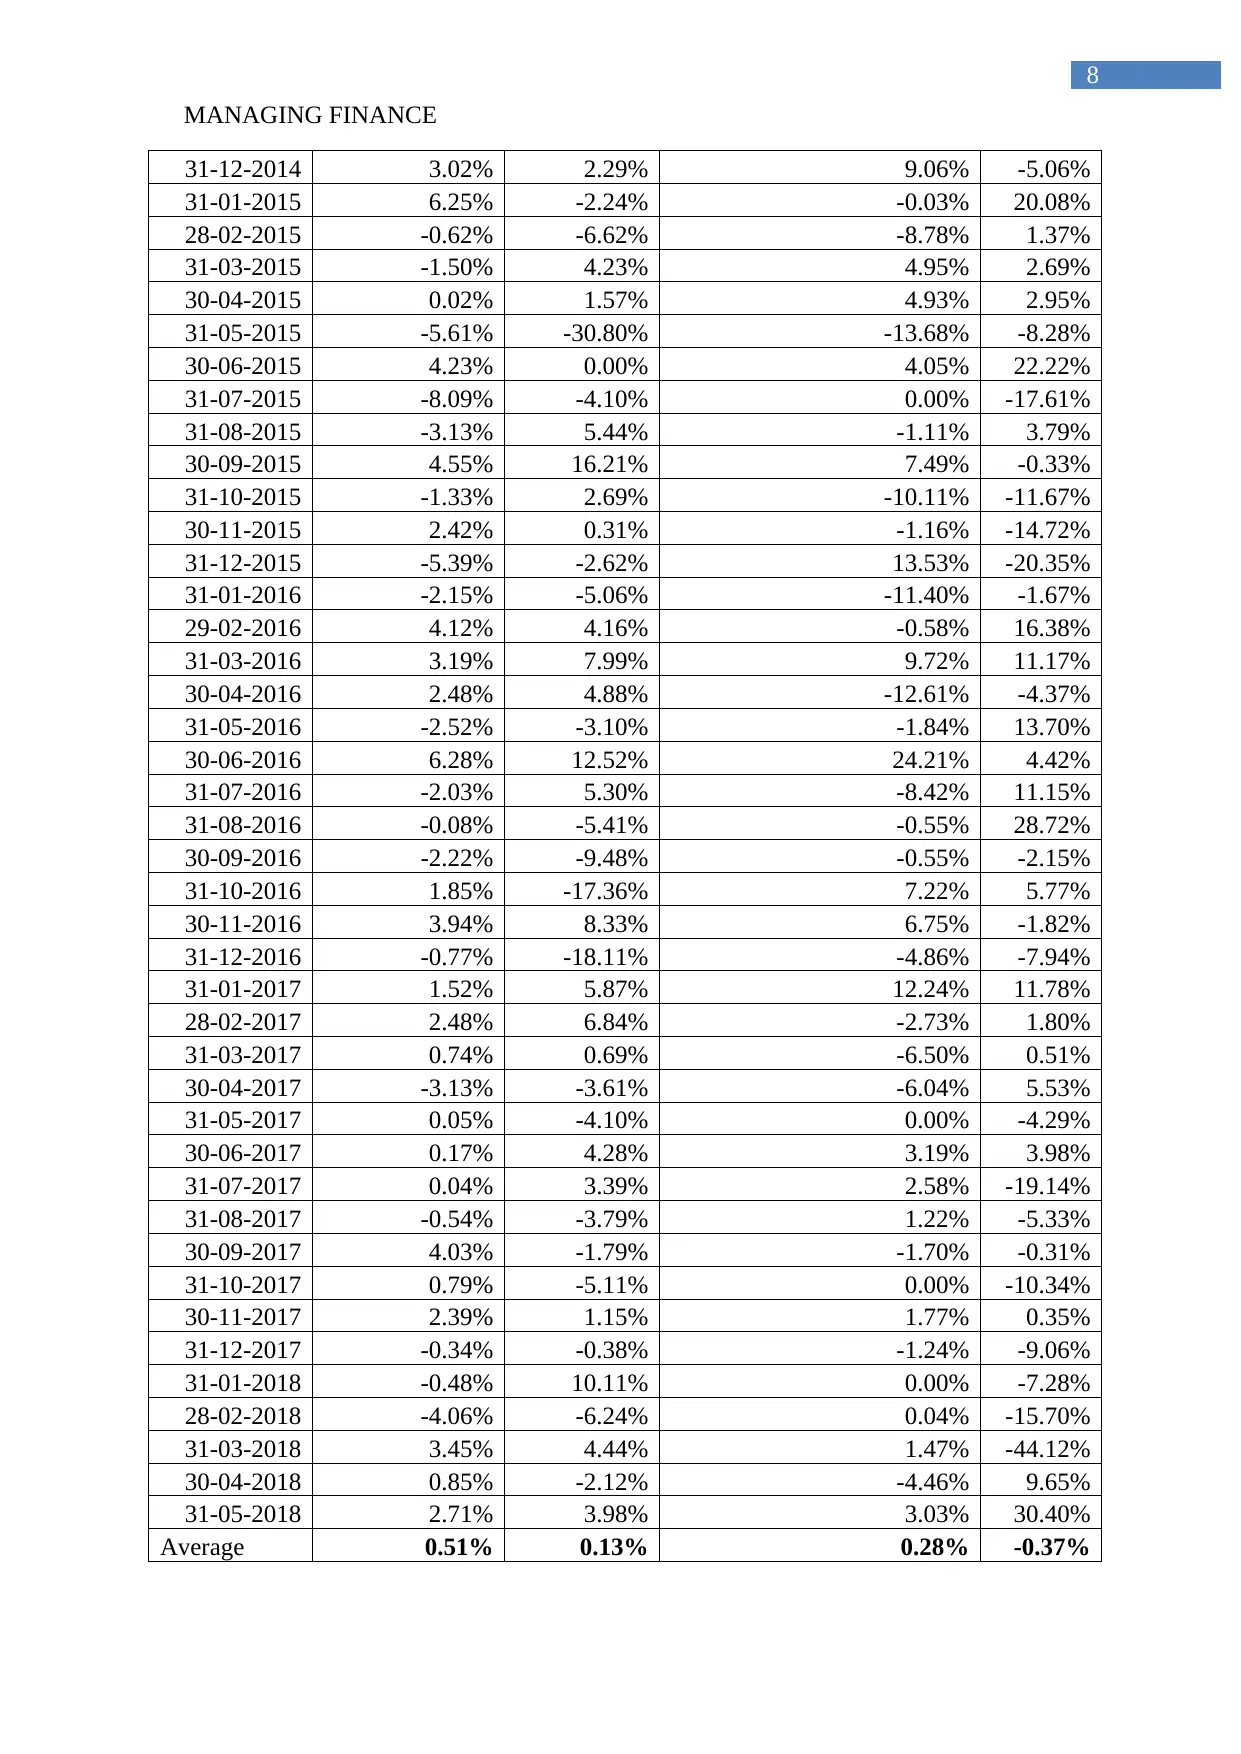
The above calculations directly provide information about the average returns that is
generated by all index and three IPOs for the next five years after their public offerings. From
the relevant analysis, it can be identified that the average returns of the market was not
breached by any of the IPOs that was taken into consideration and is depicted in the above
table. This indicates that the company's return did not outperform the Australian capital
market, which relatively depicts about the low growth capability of the IPOs
(Au.finance.yahoo.com, 2019).
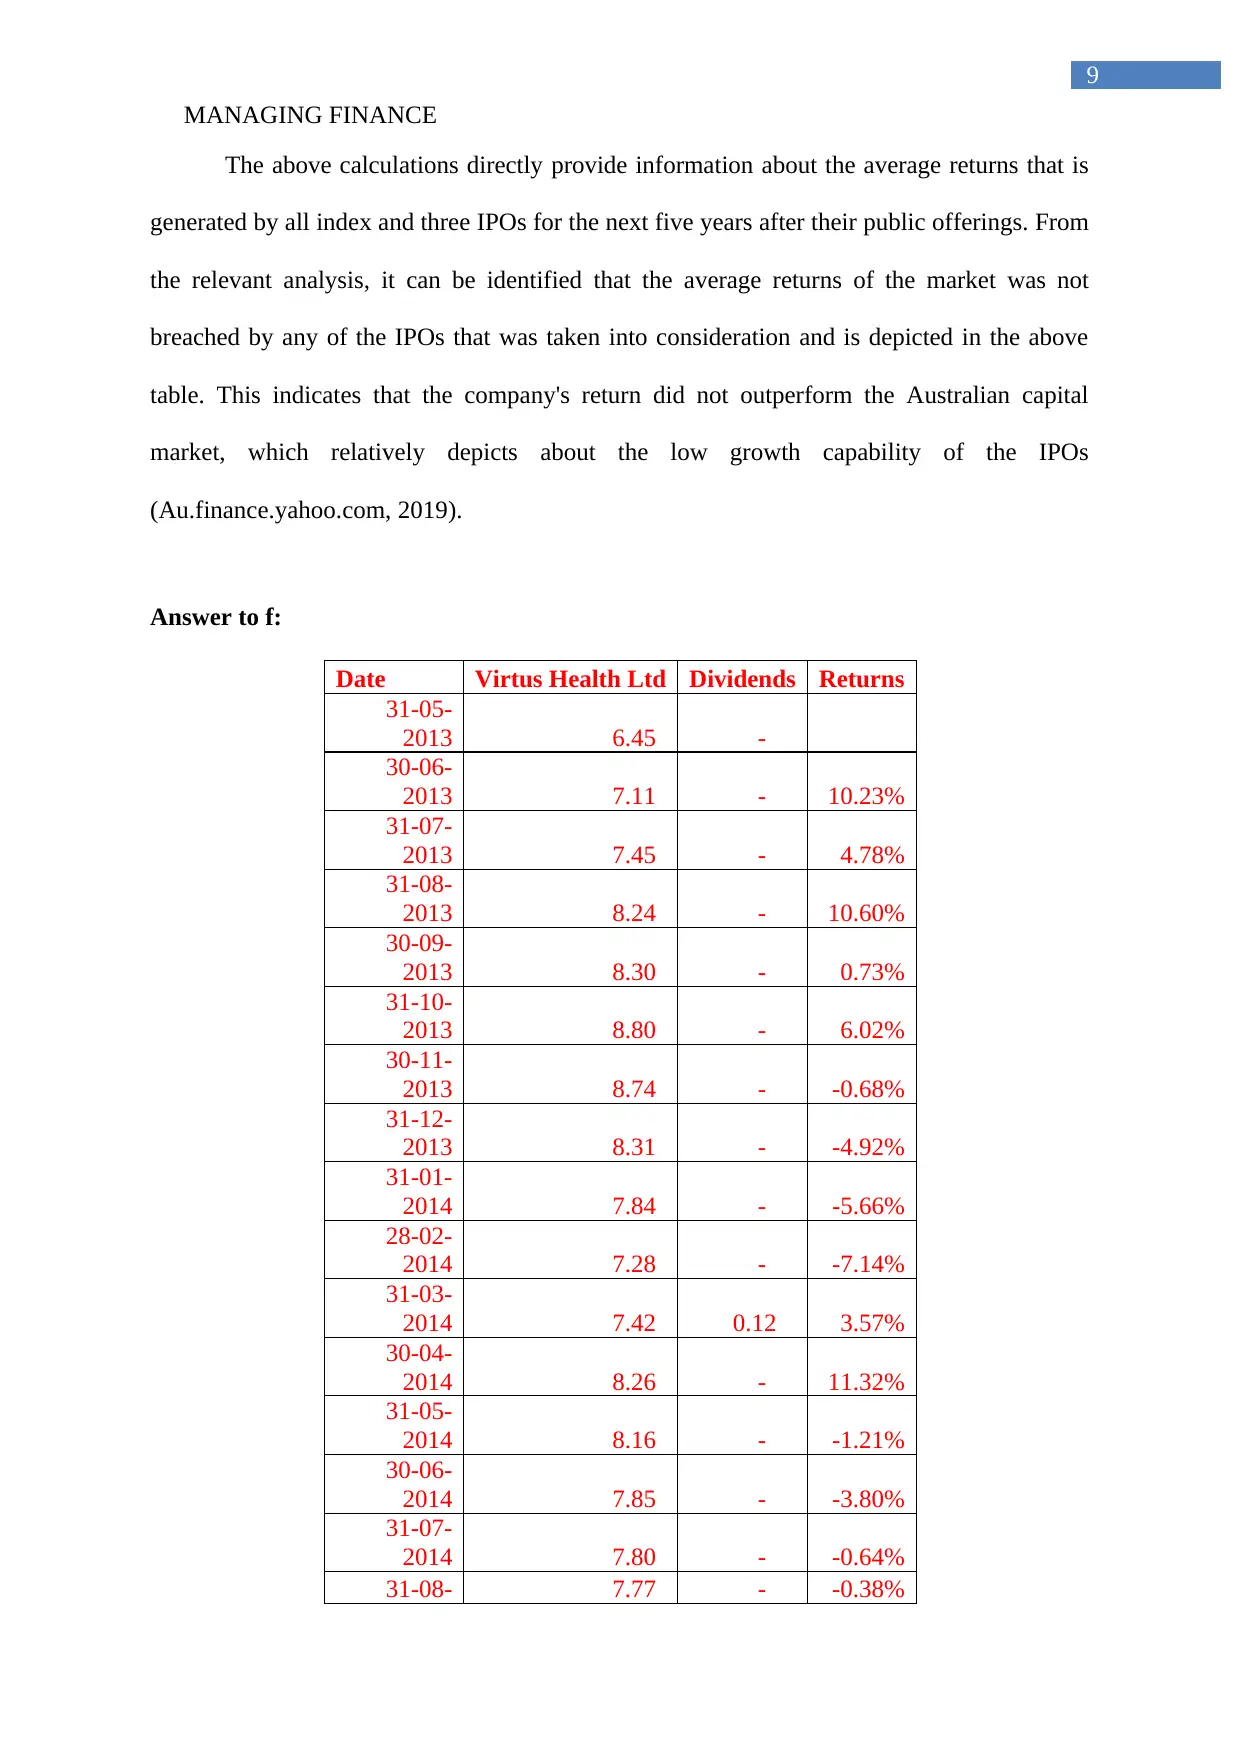
Answer to f:
Date Virtus Health Ltd Dividends Returns
31-05-
2013 6.45 -
30-06-
2013 7.11 - 10.23%
31-07-
2013 7.45 - 4.78%
31-08-
2013 8.24 - 10.60%
30-09-
2013 8.30 - 0.73%
31-10-
2013 8.80 - 6.02%
30-11-
2013 8.74 - -0.68%
31-12-
2013 8.31 - -4.92%
31-01-
2014 7.84 - -5.66%
28-02-
2014 7.28 - -7.14%
31-03-
2014 7.42 0.12 3.57%
30-04-
2014 8.26 - 11.32%
31-05-
2014 8.16 - -1.21%
30-06-
2014 7.85 - -3.80%
31-07-
2014 7.80 - -0.64%
31-08- 7.77 - -0.38%
9
The above calculations directly provide information about the average returns that is
generated by all index and three IPOs for the next five years after their public offerings. From
the relevant analysis, it can be identified that the average returns of the market was not
breached by any of the IPOs that was taken into consideration and is depicted in the above
table. This indicates that the company's return did not outperform the Australian capital
market, which relatively depicts about the low growth capability of the IPOs
(Au.finance.yahoo.com, 2019).
Answer to f:
Date Virtus Health Ltd Dividends Returns
31-05-
2013 6.45 -
30-06-
2013 7.11 - 10.23%
31-07-
2013 7.45 - 4.78%
31-08-
2013 8.24 - 10.60%
30-09-
2013 8.30 - 0.73%
31-10-
2013 8.80 - 6.02%
30-11-
2013 8.74 - -0.68%
31-12-
2013 8.31 - -4.92%
31-01-
2014 7.84 - -5.66%
28-02-
2014 7.28 - -7.14%
31-03-
2014 7.42 0.12 3.57%
30-04-
2014 8.26 - 11.32%
31-05-
2014 8.16 - -1.21%
30-06-
2014 7.85 - -3.80%
31-07-
2014 7.80 - -0.64%
31-08- 7.77 - -0.38%
Paraphrase This Document
Need a fresh take? Get an instant paraphrase of this document with our AI Paraphraser

MANAGING FINANCE
10
2014
30-09-
2014 7.45 0.14 -2.32%
31-10-
2014 6.98 - -6.31%
30-11-
2014 7.85 - 12.46%
31-12-
2014 8.03 - 2.29%
31-01-
2015 7.85 - -2.24%
28-02-
2015 7.33 - -6.62%
31-03-
2015 7.64 0.13 6.00%
30-04-
2015 7.76 - 1.57%
31-05-
2015 5.37 - -30.80%
30-06-
2015 5.37 - 0.00%
31-07-
2015 5.15 - -4.10%
31-08-
2015 5.43 - 5.44%
30-09-
2015 6.31 0.14 18.78%
31-10-
2015 6.48 - 2.69%
30-11-
2015 6.50 - 0.31%
31-12-
2015 6.33 - -2.62%
31-01-
2016 6.01 - -5.06%
29-02-
2016 6.26 - 4.16%
31-03-
2016 6.76 0.14 10.22%
30-04-
2016 7.09 - 4.88%
31-05-
2016 6.87 - -3.10%
30-06-
2016 7.73 - 12.52%
31-07-
2016 8.14 - 5.30%
31-08-
2016 7.70 - -5.41%

MANAGING FINANCE
11
30-09-
2016 6.97 0.15 -7.53%
31-10-
2016 5.76 - -17.36%
30-11-
2016 6.24 - 8.33%
31-12-
2016 5.11 - -18.11%
31-01-
2017 5.41 - 5.87%
28-02-
2017 5.78 - 6.84%
31-03-
2017 5.82 0.13 2.94%
30-04-
2017 5.61 - -3.61%
31-05-
2017 5.38 - -4.10%
30-06-
2017 5.61 - 4.28%
31-07-
2017 5.80 - 3.39%
31-08-
2017 5.58 - -3.79%
30-09-
2017 5.48 0.12 0.36%
31-10-
2017 5.20 - -5.11%
30-11-
2017 5.26 - 1.15%
31-12-
2017 5.24 - -0.38%
31-01-
2018 5.77 - 10.11%
28-02-
2018 5.41 - -6.24%
31-03-
2018 5.65 0.14 7.02%
30-04-
2018 5.53 - -2.12%
31-05-
2018 5.75 - 3.98%
Average 0.45%
Date Sandon Capital Investments Ltd Dividends Returns
30-11-
2013 0.96 -
31-12- 0.95 - -2.02%
⊘ This is a preview!⊘
Do you want full access?
Subscribe today to unlock all pages.
Trusted by 1+ million students worldwide
1 out of 21
Related Documents


Your All-in-One AI-Powered Toolkit for Academic Success.
+13062052269
info@desklib.com
Available 24*7 on WhatsApp / Email
![[object Object]](/_next/static/media/star-bottom.7253800d.svg)
Unlock your academic potential
Copyright © 2020–2026 A2Z Services. All Rights Reserved. Developed and managed by ZUCOL.