Financial Resources and Decision Making Report for Sweet Menu Business
VerifiedAdded on 2020/01/15
|23
|5606
|154
Report
AI Summary
This report provides a comprehensive analysis of financial resource management and decision-making strategies for the Sweet Menu restaurant. It begins by identifying various sources of finance, including share capital, bank loans, retained earnings, hire purchase, venture capital, and debentures, while evaluating their implications, advantages, and disadvantages. The report then assesses the cost of appropriate financing options, such as bank loans and retained earnings, and emphasizes the importance of financial planning for effective resource allocation and business expansion. Furthermore, it examines the information needs of different decision-makers within the organization and analyzes the impact of financing choices on financial statements, including income statements and balance sheets. The report also delves into budgeting, unit cost calculations, and the application of investment appraisal tools like payback period and net present value. Finally, it discusses the essential elements of financial statements, compares statement formats for different business types, and provides a ratio analysis to evaluate the financial health and performance of the restaurant, offering valuable insights for strategic financial management.

MANAGING FINANCIAL
RESOURCES AND DECISION
MAKING
RESOURCES AND DECISION
MAKING
Paraphrase This Document
Need a fresh take? Get an instant paraphrase of this document with our AI Paraphraser
TABLE OF CONTENTS
INTRODUCTION ..........................................................................................................................1
TASK 1............................................................................................................................................1
1.1 Identification of the sources of finance which are available to the Sweet menu in order to
expand their business operations.................................................................................................1
1.2 Implications of sources of finance........................................................................................2
1.3 Appropriate source of finance for Sweet menu restaurant....................................................4
TASK 2............................................................................................................................................4
2.1 Cost of sources of finance.....................................................................................................4
2.2 Importance of financial planning..........................................................................................5
2.3 Assessment of the information needs of the different decision maker of Sweet menu........5
2.4 Impact of the sources of finance upon the financial statements of Sweet menu which are
undertaken by them to meet their financial needs.......................................................................6
TASK 3............................................................................................................................................7
3.1 Analysis of the budget and appropriate business decision based upon it.............................7
3.2 Calculation of the unit cost to determine the pricing of the product and services offered by
Blue Island restaurant..................................................................................................................8
3.3 Assessing the viability of the project by taking into consideration the investment appraisal
tools.............................................................................................................................................8
TASK 4............................................................................................................................................9
4.1 Discussing the essential or main elements of the financial statements.................................9
4.2 Comparing the formats of financial statements for the different types of business
organization...............................................................................................................................10
4.3 Interpretation of the financial statements by making analysis of the ratios of both the
restaurants.................................................................................................................................16
CONCLSUION..............................................................................................................................18
REFERENCES..............................................................................................................................19
INDEX OF TABLES
Table 1: Income statement of Sweet menu......................................................................................6
Table 2: Balance sheet of Sweet menu............................................................................................6
Table 3: Percentage change in budget elements..............................................................................7
Table 4: Calculation of payback period method..............................................................................8
Table 5: Calculation of NPV............................................................................................................9
Table 6: Ratio analysis...................................................................................................................16
ILLUSTRATION INDEX
Illustration 1: Balance sheet for sole trader...................................................................................10
Illustration 2: Income statement of sole trader..............................................................................11
Illustration 3: Income statement of partnership.............................................................................12
Illustration 4: Balance sheet of partnership...................................................................................13
Illustration 5: Company balance sheet...........................................................................................14
Illustration 6: Income statement of company.................................................................................15
⊘ This is a preview!⊘
Do you want full access?
Subscribe today to unlock all pages.
Trusted by 1+ million students worldwide
INTRODUCTION
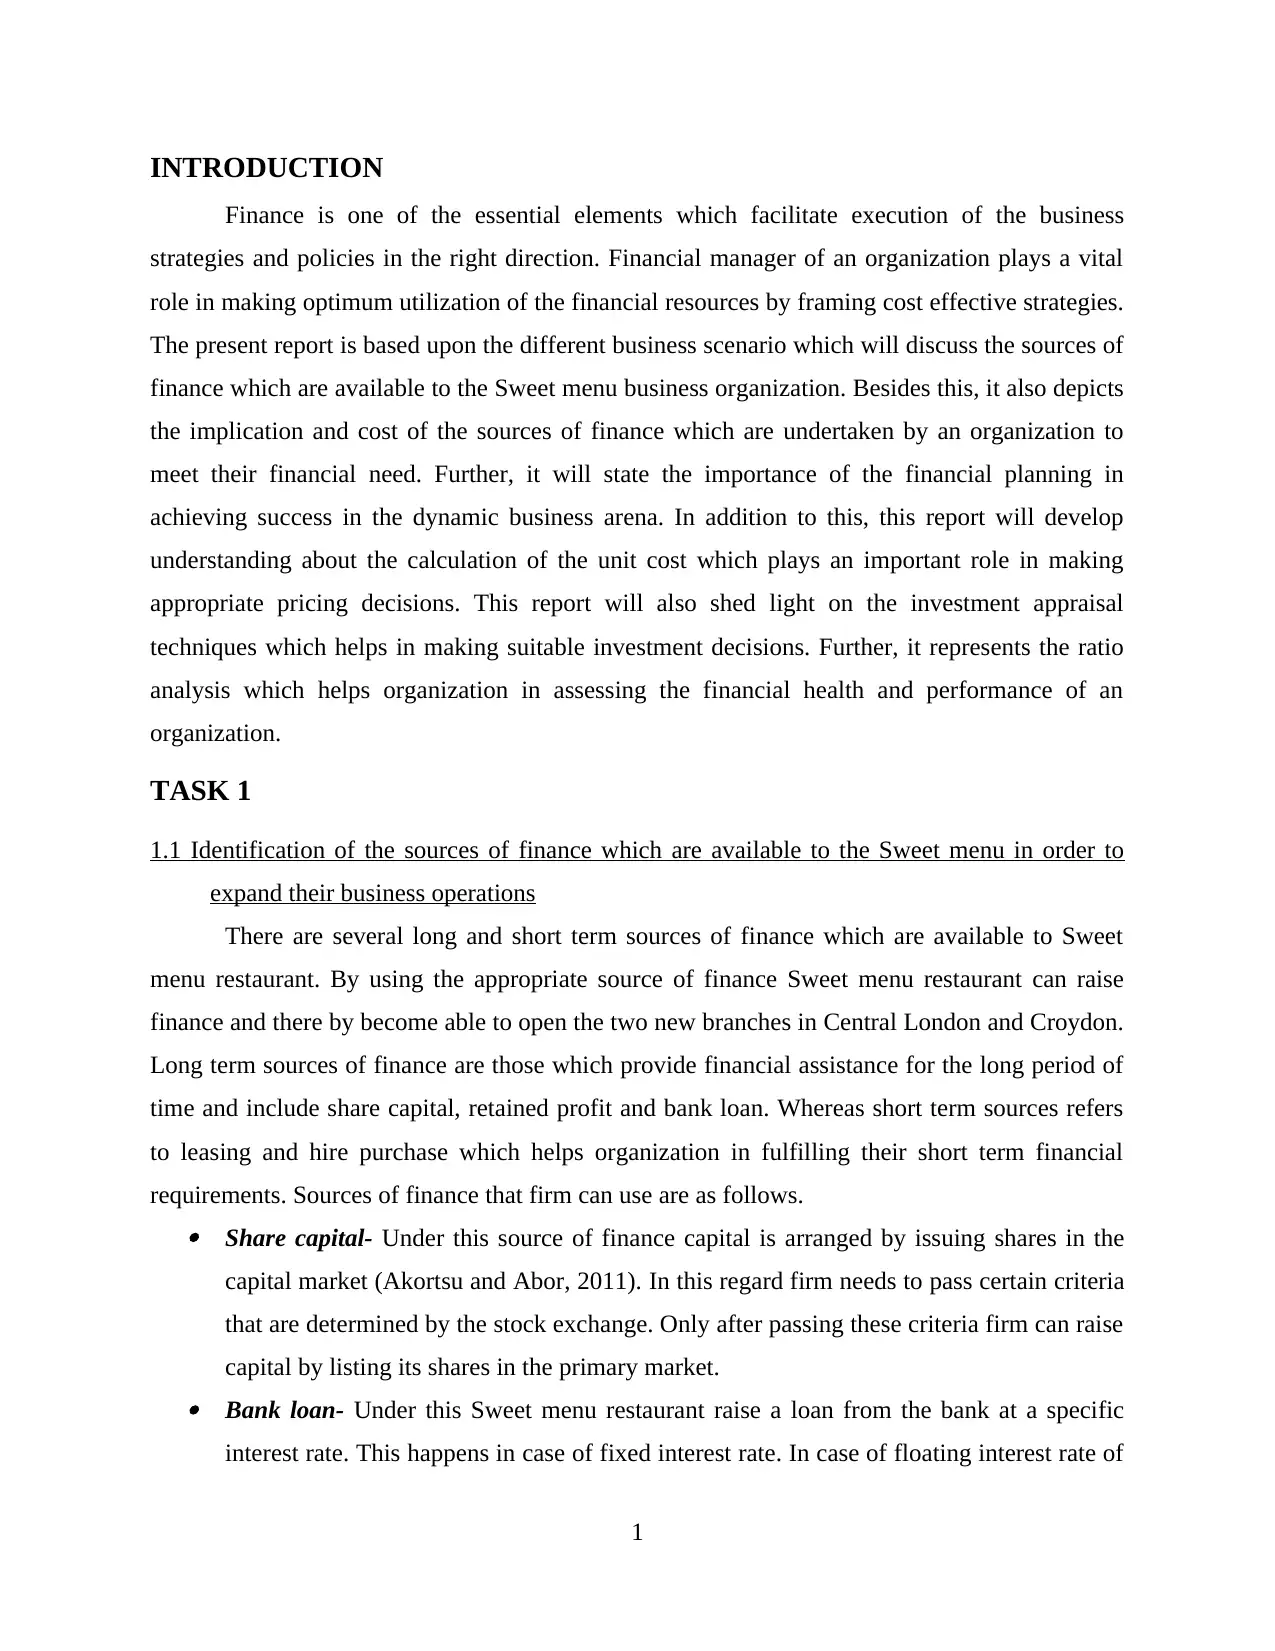
Finance is one of the essential elements which facilitate execution of the business
strategies and policies in the right direction. Financial manager of an organization plays a vital
role in making optimum utilization of the financial resources by framing cost effective strategies.
The present report is based upon the different business scenario which will discuss the sources of
finance which are available to the Sweet menu business organization. Besides this, it also depicts
the implication and cost of the sources of finance which are undertaken by an organization to
meet their financial need. Further, it will state the importance of the financial planning in
achieving success in the dynamic business arena. In addition to this, this report will develop
understanding about the calculation of the unit cost which plays an important role in making
appropriate pricing decisions. This report will also shed light on the investment appraisal
techniques which helps in making suitable investment decisions. Further, it represents the ratio
analysis which helps organization in assessing the financial health and performance of an
organization.
TASK 1
1.1 Identification of the sources of finance which are available to the Sweet menu in order to
expand their business operations
There are several long and short term sources of finance which are available to Sweet
menu restaurant. By using the appropriate source of finance Sweet menu restaurant can raise
finance and there by become able to open the two new branches in Central London and Croydon.
Long term sources of finance are those which provide financial assistance for the long period of
time and include share capital, retained profit and bank loan. Whereas short term sources refers
to leasing and hire purchase which helps organization in fulfilling their short term financial
requirements. Sources of finance that firm can use are as follows. Share capital- Under this source of finance capital is arranged by issuing shares in the
capital market (Akortsu and Abor, 2011). In this regard firm needs to pass certain criteria
that are determined by the stock exchange. Only after passing these criteria firm can raise
capital by listing its shares in the primary market. Bank loan- Under this Sweet menu restaurant raise a loan from the bank at a specific
interest rate. This happens in case of fixed interest rate. In case of floating interest rate of
1
Paraphrase This Document
Need a fresh take? Get an instant paraphrase of this document with our AI Paraphraser
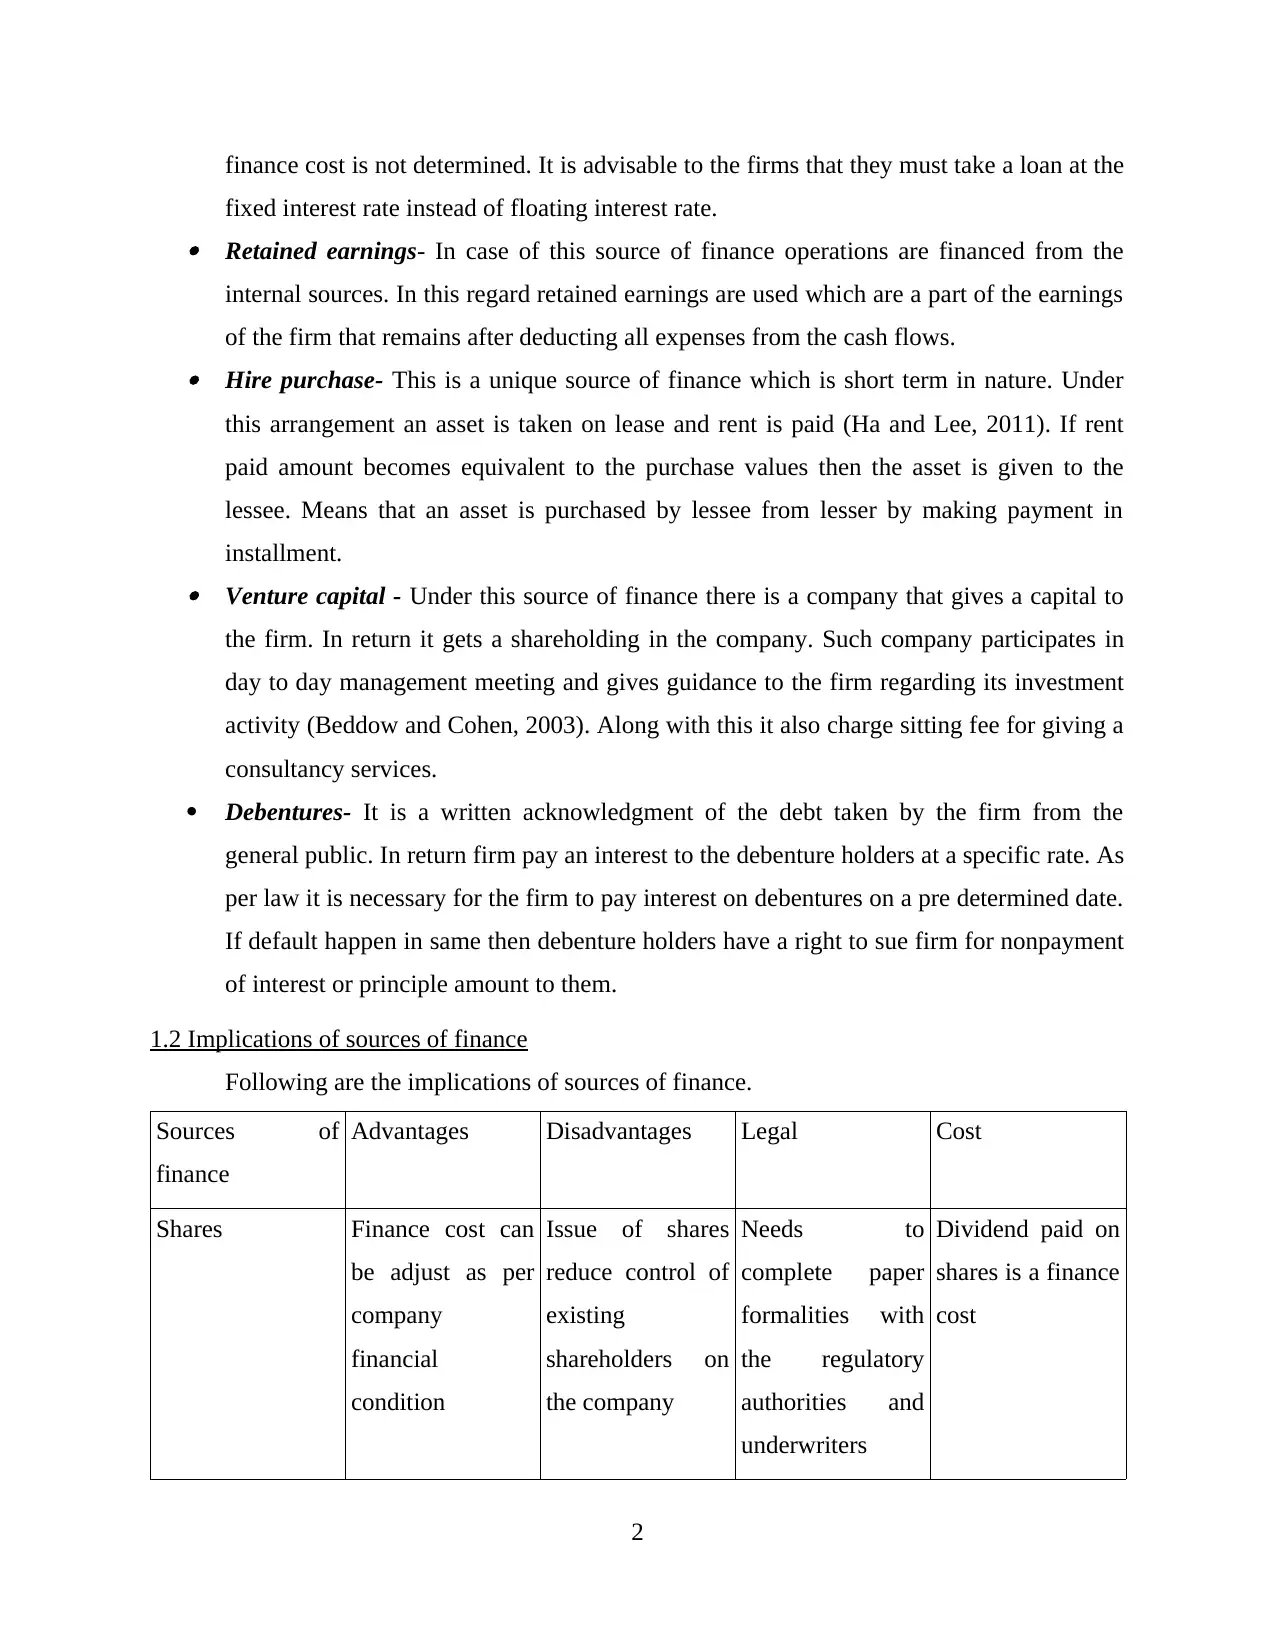
finance cost is not determined. It is advisable to the firms that they must take a loan at the
fixed interest rate instead of floating interest rate. Retained earnings- In case of this source of finance operations are financed from the
internal sources. In this regard retained earnings are used which are a part of the earnings
of the firm that remains after deducting all expenses from the cash flows. Hire purchase- This is a unique source of finance which is short term in nature. Under
this arrangement an asset is taken on lease and rent is paid (Ha and Lee, 2011). If rent
paid amount becomes equivalent to the purchase values then the asset is given to the
lessee. Means that an asset is purchased by lessee from lesser by making payment in
installment. Venture capital - Under this source of finance there is a company that gives a capital to
the firm. In return it gets a shareholding in the company. Such company participates in
day to day management meeting and gives guidance to the firm regarding its investment
activity (Beddow and Cohen, 2003). Along with this it also charge sitting fee for giving a
consultancy services.
Debentures- It is a written acknowledgment of the debt taken by the firm from the
general public. In return firm pay an interest to the debenture holders at a specific rate. As
per law it is necessary for the firm to pay interest on debentures on a pre determined date.
If default happen in same then debenture holders have a right to sue firm for nonpayment
of interest or principle amount to them.
1.2 Implications of sources of finance
Following are the implications of sources of finance.
Sources of
finance
Advantages Disadvantages Legal Cost
Shares Finance cost can
be adjust as per
company
financial
condition
Issue of shares
reduce control of
existing
shareholders on
the company
Needs to
complete paper
formalities with
the regulatory
authorities and
underwriters
Dividend paid on
shares is a finance
cost
2
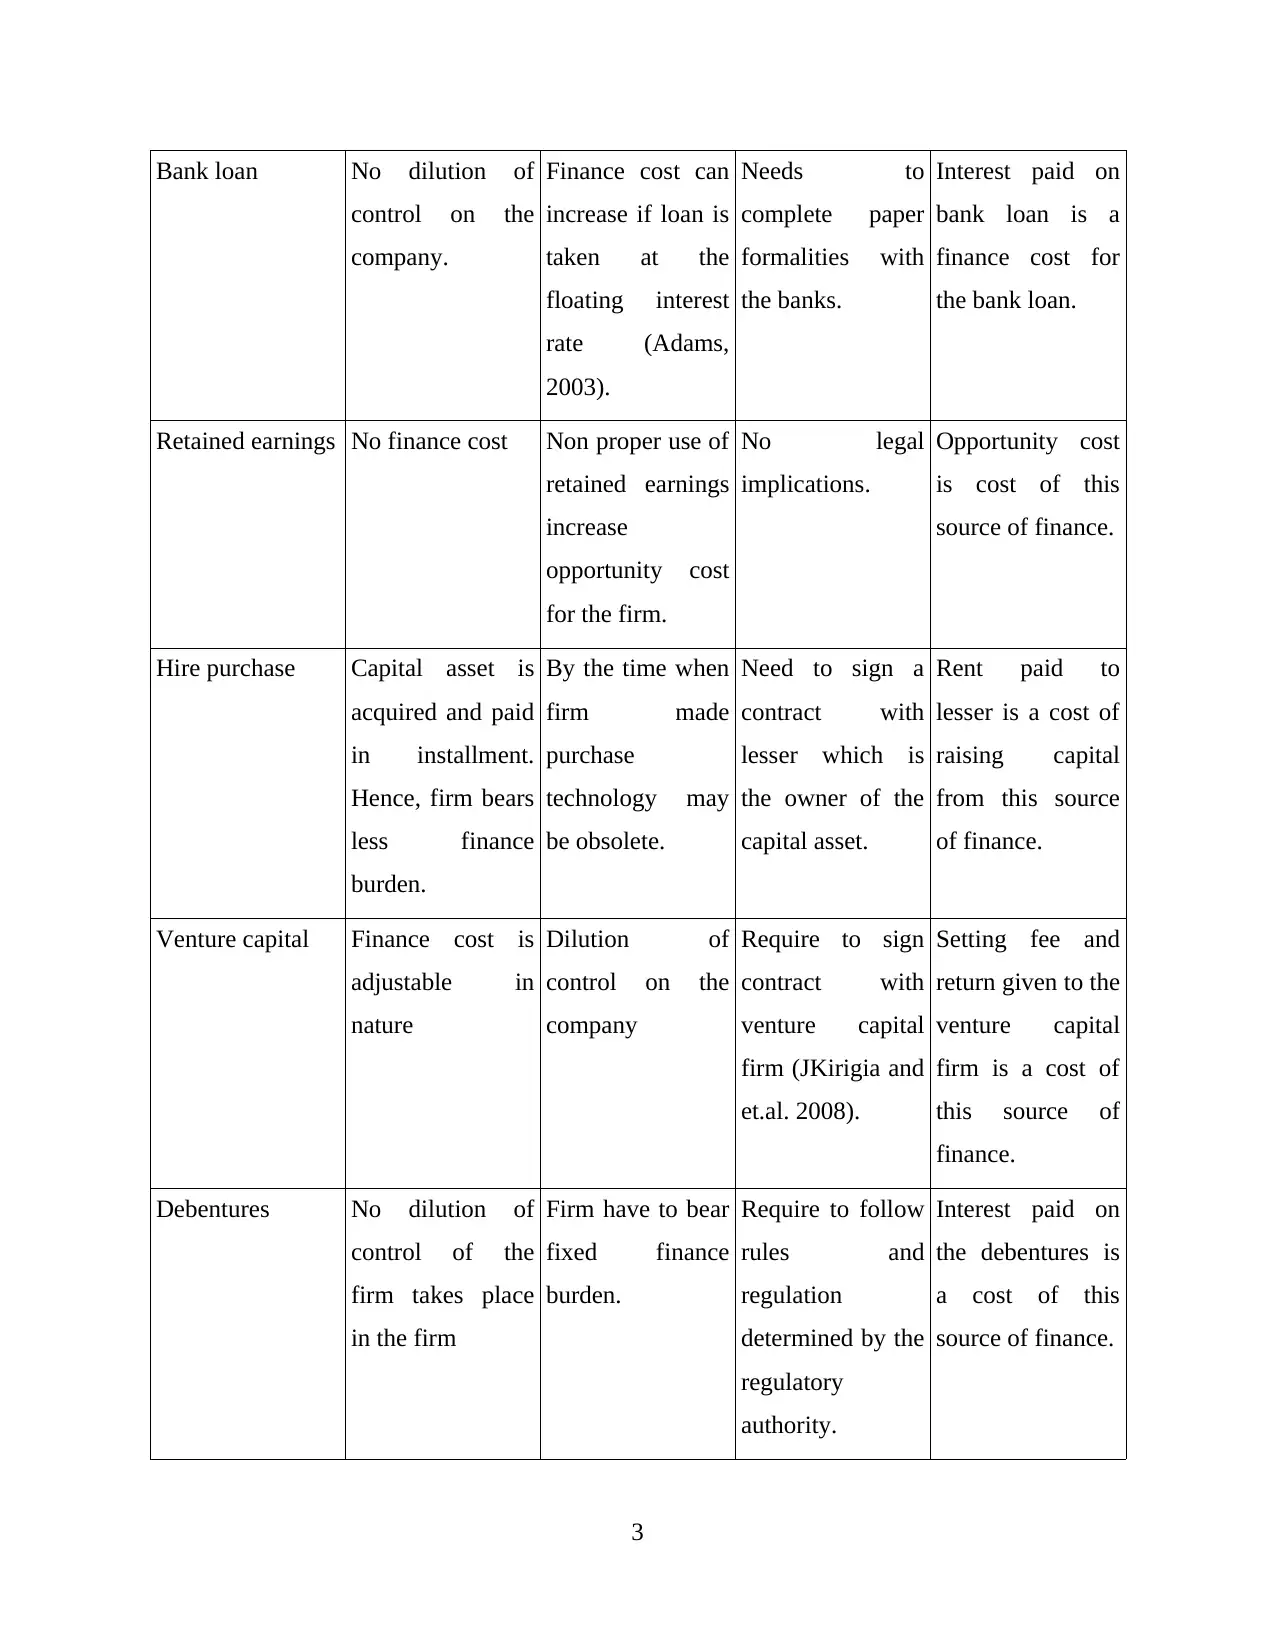
Bank loan No dilution of
control on the
company.
Finance cost can
increase if loan is
taken at the
floating interest
rate (Adams,
2003).
Needs to
complete paper
formalities with
the banks.
Interest paid on
bank loan is a
finance cost for
the bank loan.
Retained earnings No finance cost Non proper use of
retained earnings
increase
opportunity cost
for the firm.
No legal
implications.
Opportunity cost
is cost of this
source of finance.
Hire purchase Capital asset is
acquired and paid
in installment.
Hence, firm bears
less finance
burden.
By the time when
firm made
purchase
technology may
be obsolete.
Need to sign a
contract with
lesser which is
the owner of the
capital asset.
Rent paid to
lesser is a cost of
raising capital
from this source
of finance.
Venture capital Finance cost is
adjustable in
nature
Dilution of
control on the
company
Require to sign
contract with
venture capital
firm (JKirigia and
et.al. 2008).
Setting fee and
return given to the
venture capital
firm is a cost of
this source of
finance.
Debentures No dilution of
control of the
firm takes place
in the firm
Firm have to bear
fixed finance
burden.
Require to follow
rules and
regulation
determined by the
regulatory
authority.
Interest paid on
the debentures is
a cost of this
source of finance.
3
control on the
company.
Finance cost can
increase if loan is
taken at the
floating interest
rate (Adams,
2003).
Needs to
complete paper
formalities with
the banks.
Interest paid on
bank loan is a
finance cost for
the bank loan.
Retained earnings No finance cost Non proper use of
retained earnings
increase
opportunity cost
for the firm.
No legal
implications.
Opportunity cost
is cost of this
source of finance.
Hire purchase Capital asset is
acquired and paid
in installment.
Hence, firm bears
less finance
burden.
By the time when
firm made
purchase
technology may
be obsolete.
Need to sign a
contract with
lesser which is
the owner of the
capital asset.
Rent paid to
lesser is a cost of
raising capital
from this source
of finance.
Venture capital Finance cost is
adjustable in
nature
Dilution of
control on the
company
Require to sign
contract with
venture capital
firm (JKirigia and
et.al. 2008).
Setting fee and
return given to the
venture capital
firm is a cost of
this source of
finance.
Debentures No dilution of
control of the
firm takes place
in the firm
Firm have to bear
fixed finance
burden.
Require to follow
rules and
regulation
determined by the
regulatory
authority.
Interest paid on
the debentures is
a cost of this
source of finance.
3
⊘ This is a preview!⊘
Do you want full access?
Subscribe today to unlock all pages.
Trusted by 1+ million students worldwide
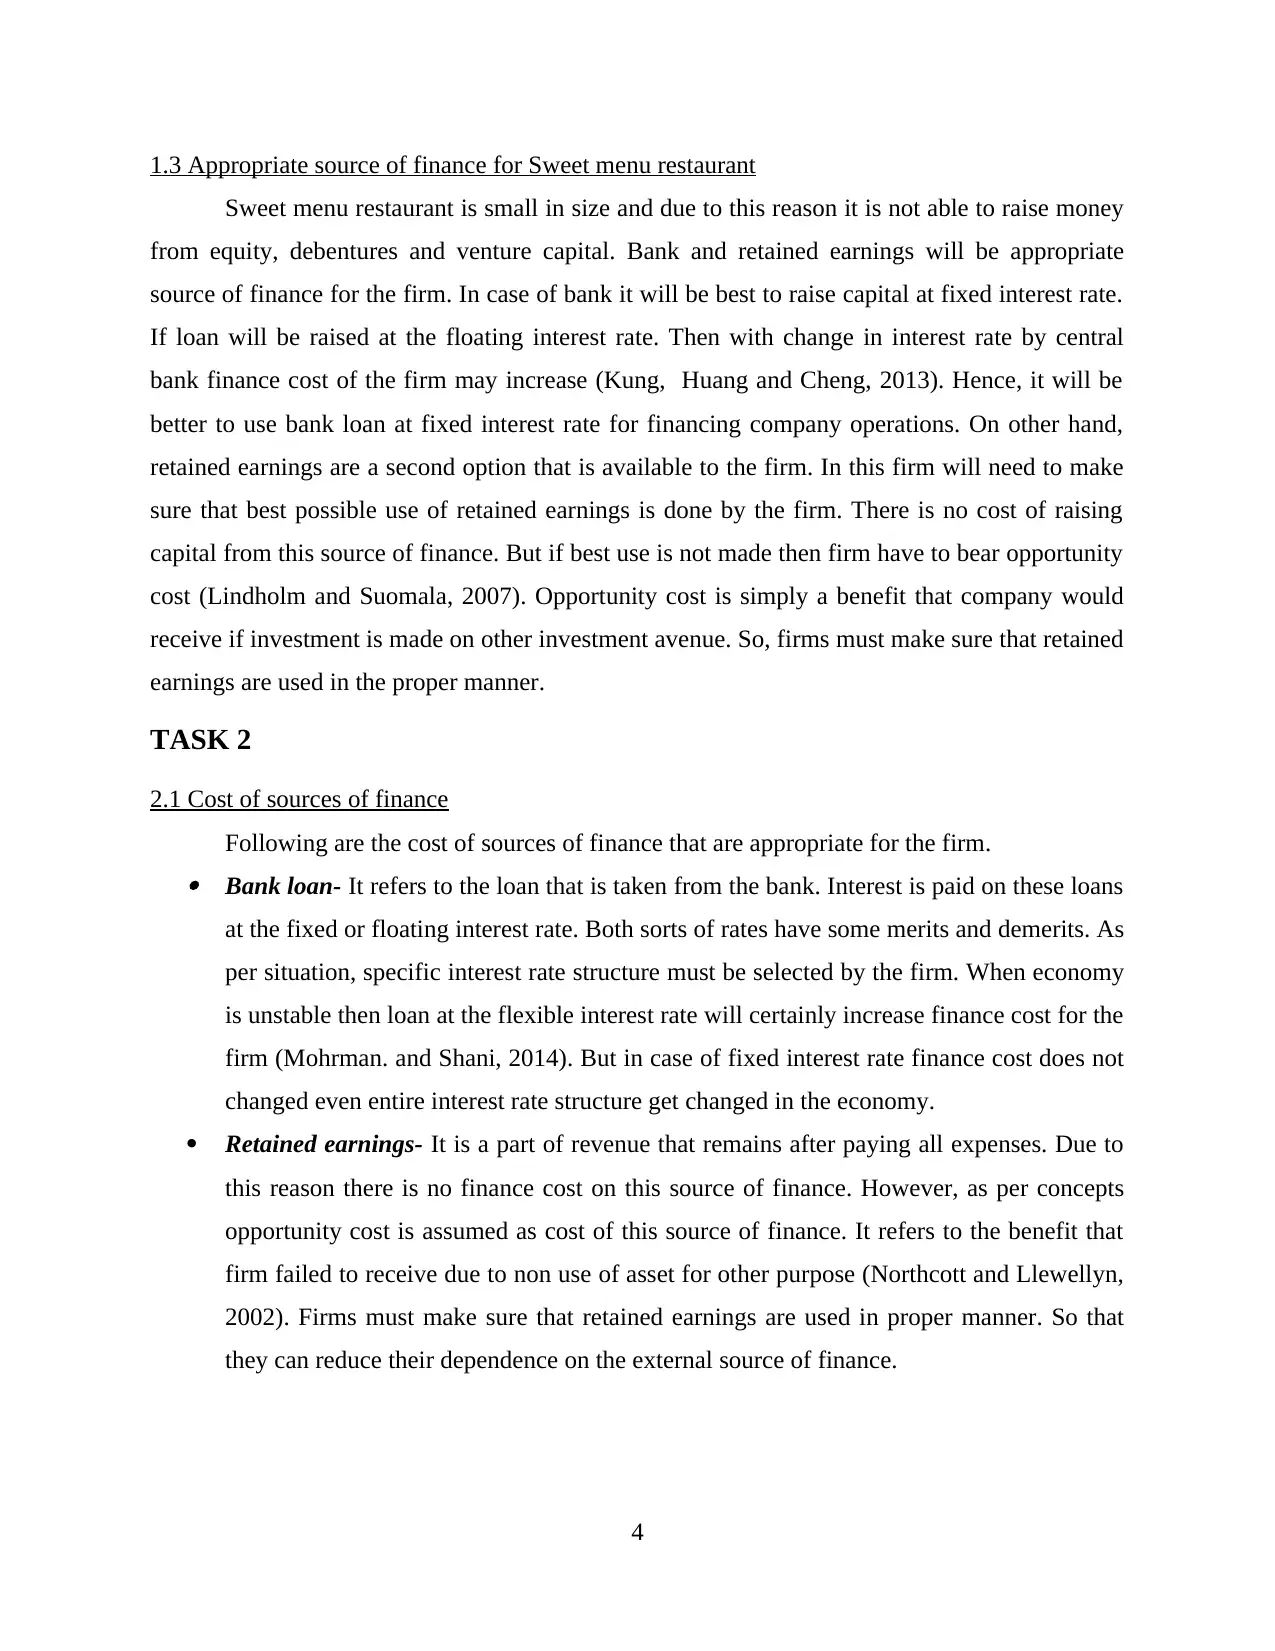
1.3 Appropriate source of finance for Sweet menu restaurant
Sweet menu restaurant is small in size and due to this reason it is not able to raise money
from equity, debentures and venture capital. Bank and retained earnings will be appropriate
source of finance for the firm. In case of bank it will be best to raise capital at fixed interest rate.
If loan will be raised at the floating interest rate. Then with change in interest rate by central
bank finance cost of the firm may increase (Kung, Huang and Cheng, 2013). Hence, it will be
better to use bank loan at fixed interest rate for financing company operations. On other hand,
retained earnings are a second option that is available to the firm. In this firm will need to make
sure that best possible use of retained earnings is done by the firm. There is no cost of raising
capital from this source of finance. But if best use is not made then firm have to bear opportunity
cost (Lindholm and Suomala, 2007). Opportunity cost is simply a benefit that company would
receive if investment is made on other investment avenue. So, firms must make sure that retained
earnings are used in the proper manner.
TASK 2
2.1 Cost of sources of finance
Following are the cost of sources of finance that are appropriate for the firm. Bank loan- It refers to the loan that is taken from the bank. Interest is paid on these loans
at the fixed or floating interest rate. Both sorts of rates have some merits and demerits. As
per situation, specific interest rate structure must be selected by the firm. When economy
is unstable then loan at the flexible interest rate will certainly increase finance cost for the
firm (Mohrman. and Shani, 2014). But in case of fixed interest rate finance cost does not
changed even entire interest rate structure get changed in the economy.
Retained earnings- It is a part of revenue that remains after paying all expenses. Due to
this reason there is no finance cost on this source of finance. However, as per concepts
opportunity cost is assumed as cost of this source of finance. It refers to the benefit that
firm failed to receive due to non use of asset for other purpose (Northcott and Llewellyn,
2002). Firms must make sure that retained earnings are used in proper manner. So that
they can reduce their dependence on the external source of finance.
4
Paraphrase This Document
Need a fresh take? Get an instant paraphrase of this document with our AI Paraphraser
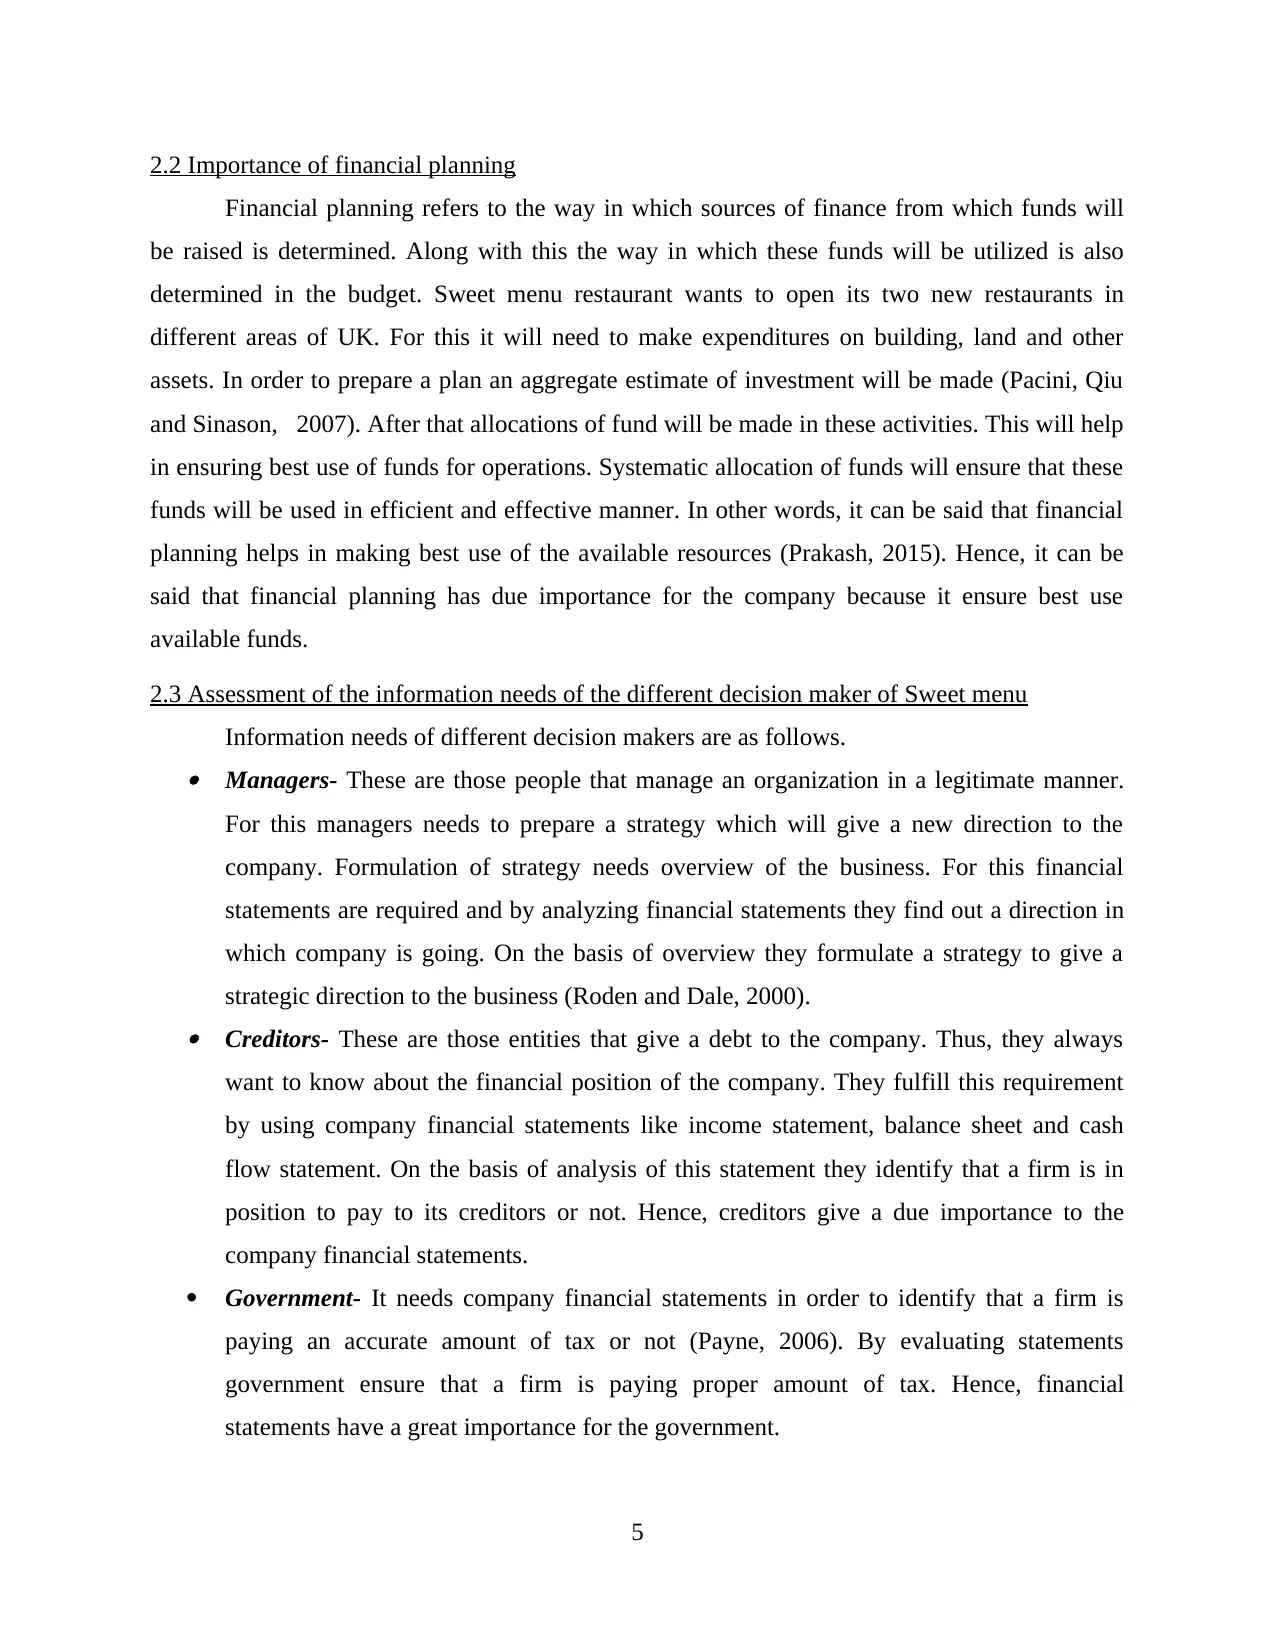
2.2 Importance of financial planning
Financial planning refers to the way in which sources of finance from which funds will
be raised is determined. Along with this the way in which these funds will be utilized is also
determined in the budget. Sweet menu restaurant wants to open its two new restaurants in
different areas of UK. For this it will need to make expenditures on building, land and other
assets. In order to prepare a plan an aggregate estimate of investment will be made (Pacini, Qiu
and Sinason, 2007). After that allocations of fund will be made in these activities. This will help
in ensuring best use of funds for operations. Systematic allocation of funds will ensure that these
funds will be used in efficient and effective manner. In other words, it can be said that financial
planning helps in making best use of the available resources (Prakash, 2015). Hence, it can be
said that financial planning has due importance for the company because it ensure best use
available funds.
2.3 Assessment of the information needs of the different decision maker of Sweet menu
Information needs of different decision makers are as follows. Managers- These are those people that manage an organization in a legitimate manner.
For this managers needs to prepare a strategy which will give a new direction to the
company. Formulation of strategy needs overview of the business. For this financial
statements are required and by analyzing financial statements they find out a direction in
which company is going. On the basis of overview they formulate a strategy to give a
strategic direction to the business (Roden and Dale, 2000). Creditors- These are those entities that give a debt to the company. Thus, they always
want to know about the financial position of the company. They fulfill this requirement
by using company financial statements like income statement, balance sheet and cash
flow statement. On the basis of analysis of this statement they identify that a firm is in
position to pay to its creditors or not. Hence, creditors give a due importance to the
company financial statements.
Government- It needs company financial statements in order to identify that a firm is
paying an accurate amount of tax or not (Payne, 2006). By evaluating statements
government ensure that a firm is paying proper amount of tax. Hence, financial
statements have a great importance for the government.
5
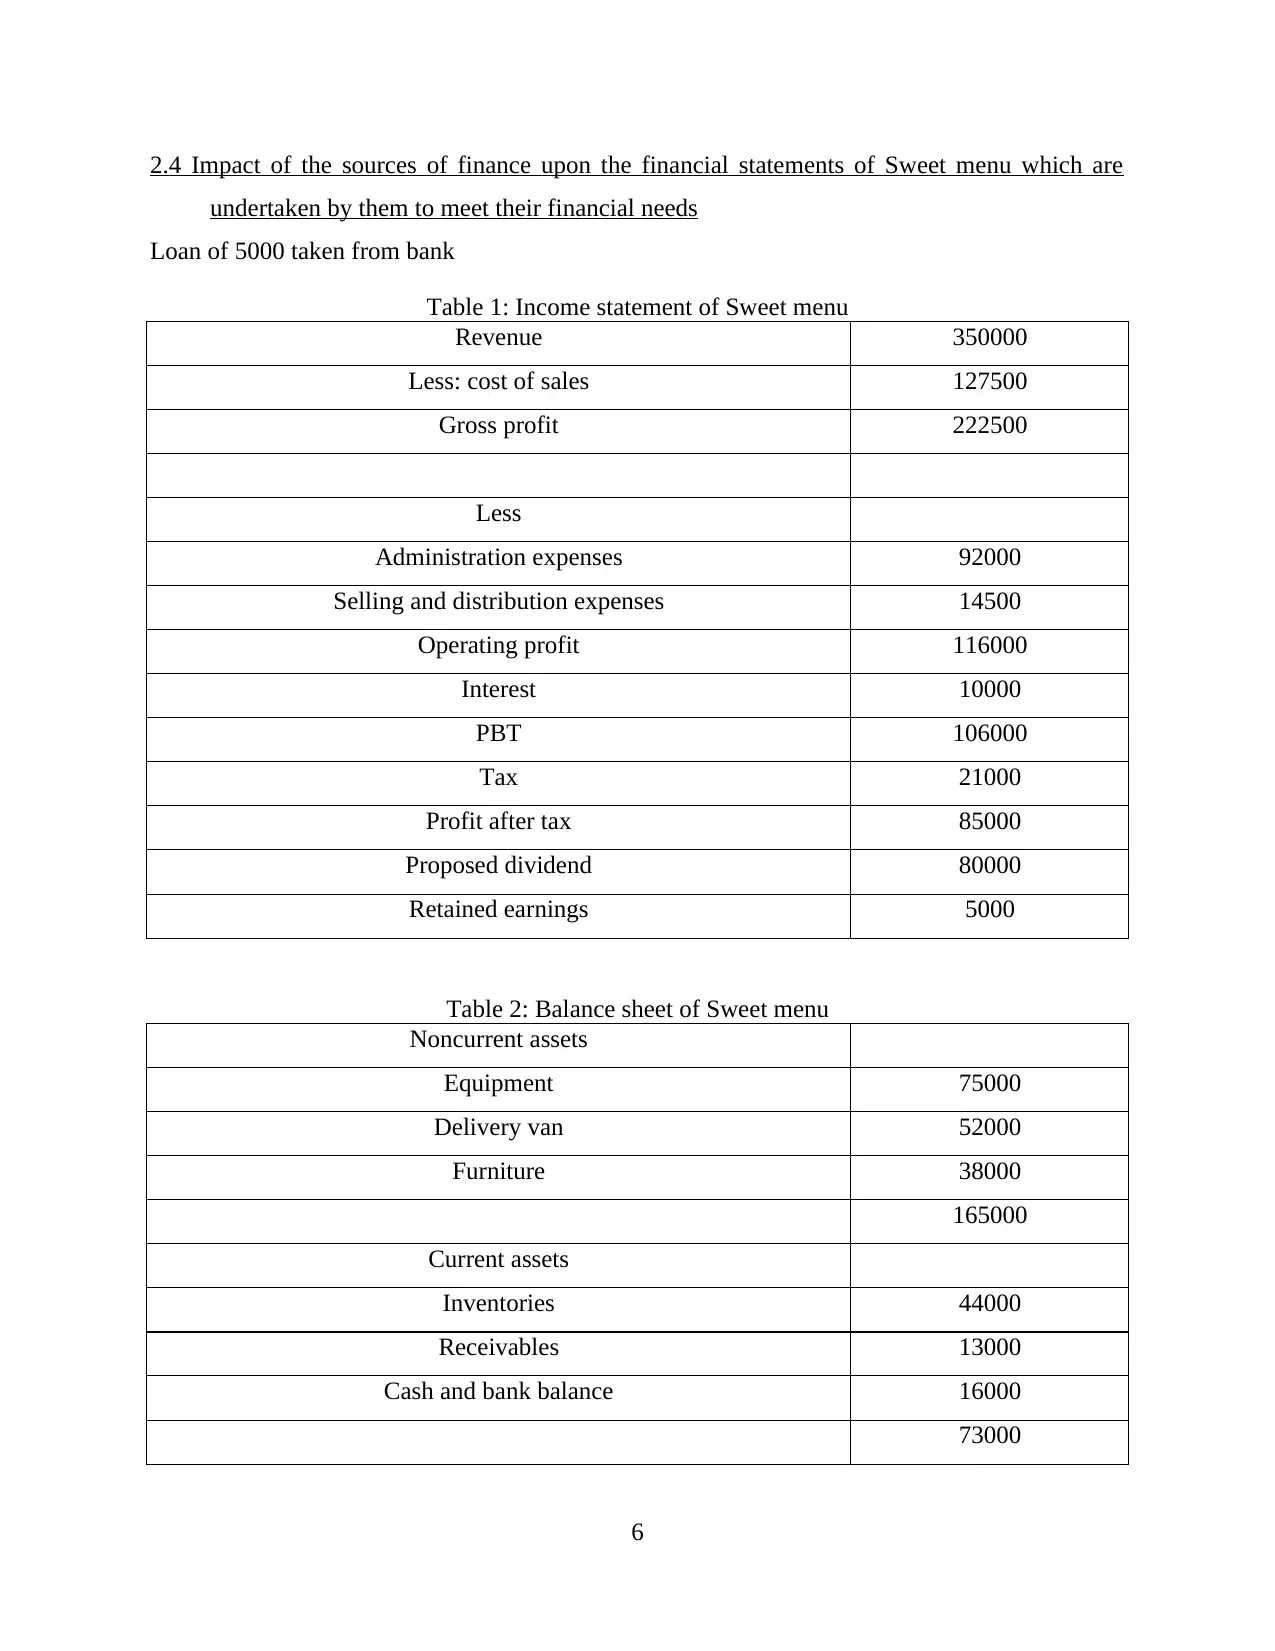
2.4 Impact of the sources of finance upon the financial statements of Sweet menu which are
undertaken by them to meet their financial needs
Loan of 5000 taken from bank
Table 1: Income statement of Sweet menu
Revenue 350000
Less: cost of sales 127500
Gross profit 222500
Less
Administration expenses 92000
Selling and distribution expenses 14500
Operating profit 116000
Interest 10000
PBT 106000
Tax 21000
Profit after tax 85000
Proposed dividend 80000
Retained earnings 5000
Table 2: Balance sheet of Sweet menu
Noncurrent assets
Equipment 75000
Delivery van 52000
Furniture 38000
165000
Current assets
Inventories 44000
Receivables 13000
Cash and bank balance 16000
73000
6
⊘ This is a preview!⊘
Do you want full access?
Subscribe today to unlock all pages.
Trusted by 1+ million students worldwide
Current liabilities
Payable 38000
Net current assets 35000
200000
Equity
60,000 ordinary shares @ 1 capital 60000
Revenue reserves 104000
Noncurrent liability
Long term loan 36000
Net assets 200000
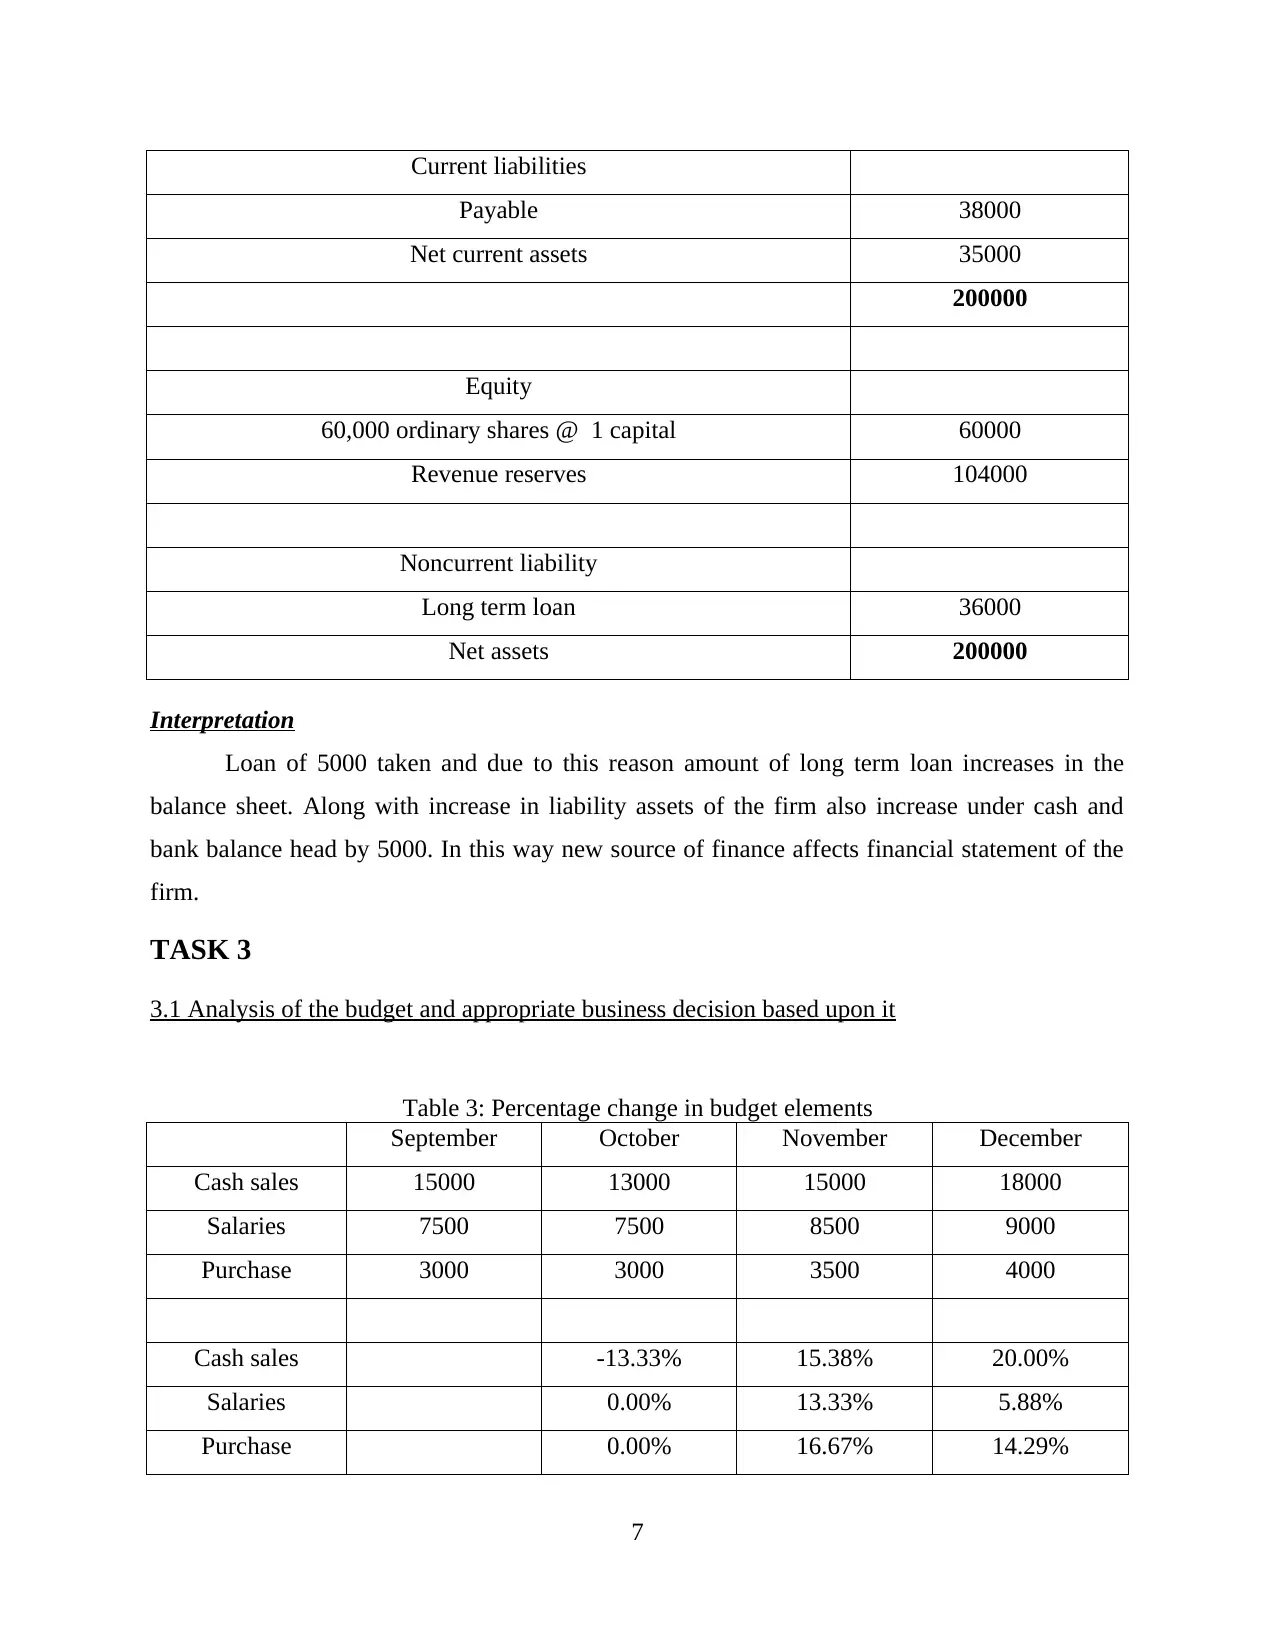
Interpretation
Loan of 5000 taken and due to this reason amount of long term loan increases in the
balance sheet. Along with increase in liability assets of the firm also increase under cash and
bank balance head by 5000. In this way new source of finance affects financial statement of the
firm.
TASK 3
3.1 Analysis of the budget and appropriate business decision based upon it
Table 3: Percentage change in budget elements
September October November December
Cash sales 15000 13000 15000 18000
Salaries 7500 7500 8500 9000
Purchase 3000 3000 3500 4000
Cash sales -13.33% 15.38% 20.00%
Salaries 0.00% 13.33% 5.88%
Purchase 0.00% 16.67% 14.29%
7
Payable 38000
Net current assets 35000
200000
Equity
60,000 ordinary shares @ 1 capital 60000
Revenue reserves 104000
Noncurrent liability
Long term loan 36000
Net assets 200000
Interpretation
Loan of 5000 taken and due to this reason amount of long term loan increases in the
balance sheet. Along with increase in liability assets of the firm also increase under cash and
bank balance head by 5000. In this way new source of finance affects financial statement of the
firm.
TASK 3
3.1 Analysis of the budget and appropriate business decision based upon it
Table 3: Percentage change in budget elements
September October November December
Cash sales 15000 13000 15000 18000
Salaries 7500 7500 8500 9000
Purchase 3000 3000 3500 4000
Cash sales -13.33% 15.38% 20.00%
Salaries 0.00% 13.33% 5.88%
Purchase 0.00% 16.67% 14.29%
7
Paraphrase This Document
Need a fresh take? Get an instant paraphrase of this document with our AI Paraphraser
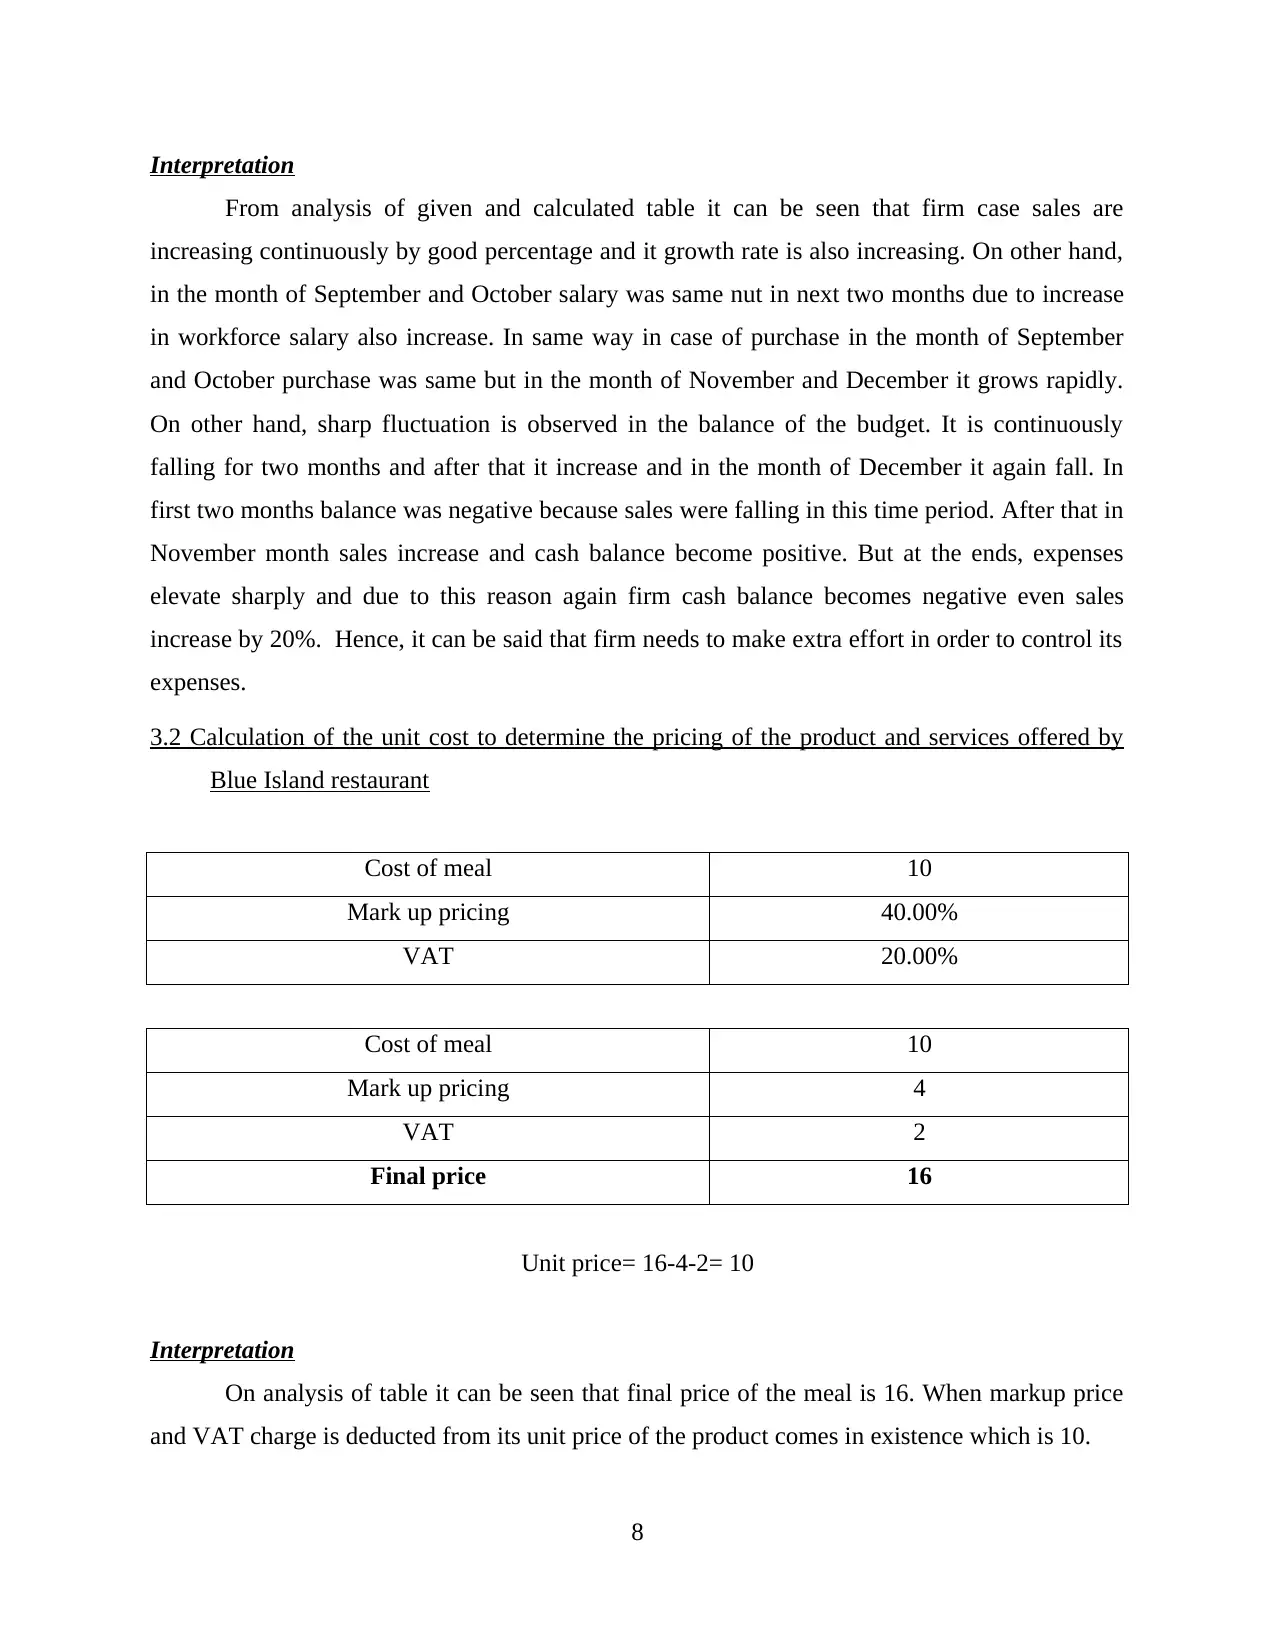
Interpretation
From analysis of given and calculated table it can be seen that firm case sales are
increasing continuously by good percentage and it growth rate is also increasing. On other hand,
in the month of September and October salary was same nut in next two months due to increase
in workforce salary also increase. In same way in case of purchase in the month of September
and October purchase was same but in the month of November and December it grows rapidly.
On other hand, sharp fluctuation is observed in the balance of the budget. It is continuously
falling for two months and after that it increase and in the month of December it again fall. In
first two months balance was negative because sales were falling in this time period. After that in
November month sales increase and cash balance become positive. But at the ends, expenses
elevate sharply and due to this reason again firm cash balance becomes negative even sales
increase by 20%. Hence, it can be said that firm needs to make extra effort in order to control its
expenses.
3.2 Calculation of the unit cost to determine the pricing of the product and services offered by
Blue Island restaurant
Cost of meal 10
Mark up pricing 40.00%
VAT 20.00%
Cost of meal 10
Mark up pricing 4
VAT 2
Final price 16
Unit price= 16-4-2= 10
Interpretation
On analysis of table it can be seen that final price of the meal is 16. When markup price
and VAT charge is deducted from its unit price of the product comes in existence which is 10.
8
3.3 Assessing the viability of the project by taking into consideration the investment appraisal
tools
Table 4: Calculation of payback period method
Project A Project B
Initial investment -1200 -1200
1 800 -400 300 -900
2 600 200 400 -500
3 400 600 500 0
4 200 800 600 600
5 50 850 550 1150
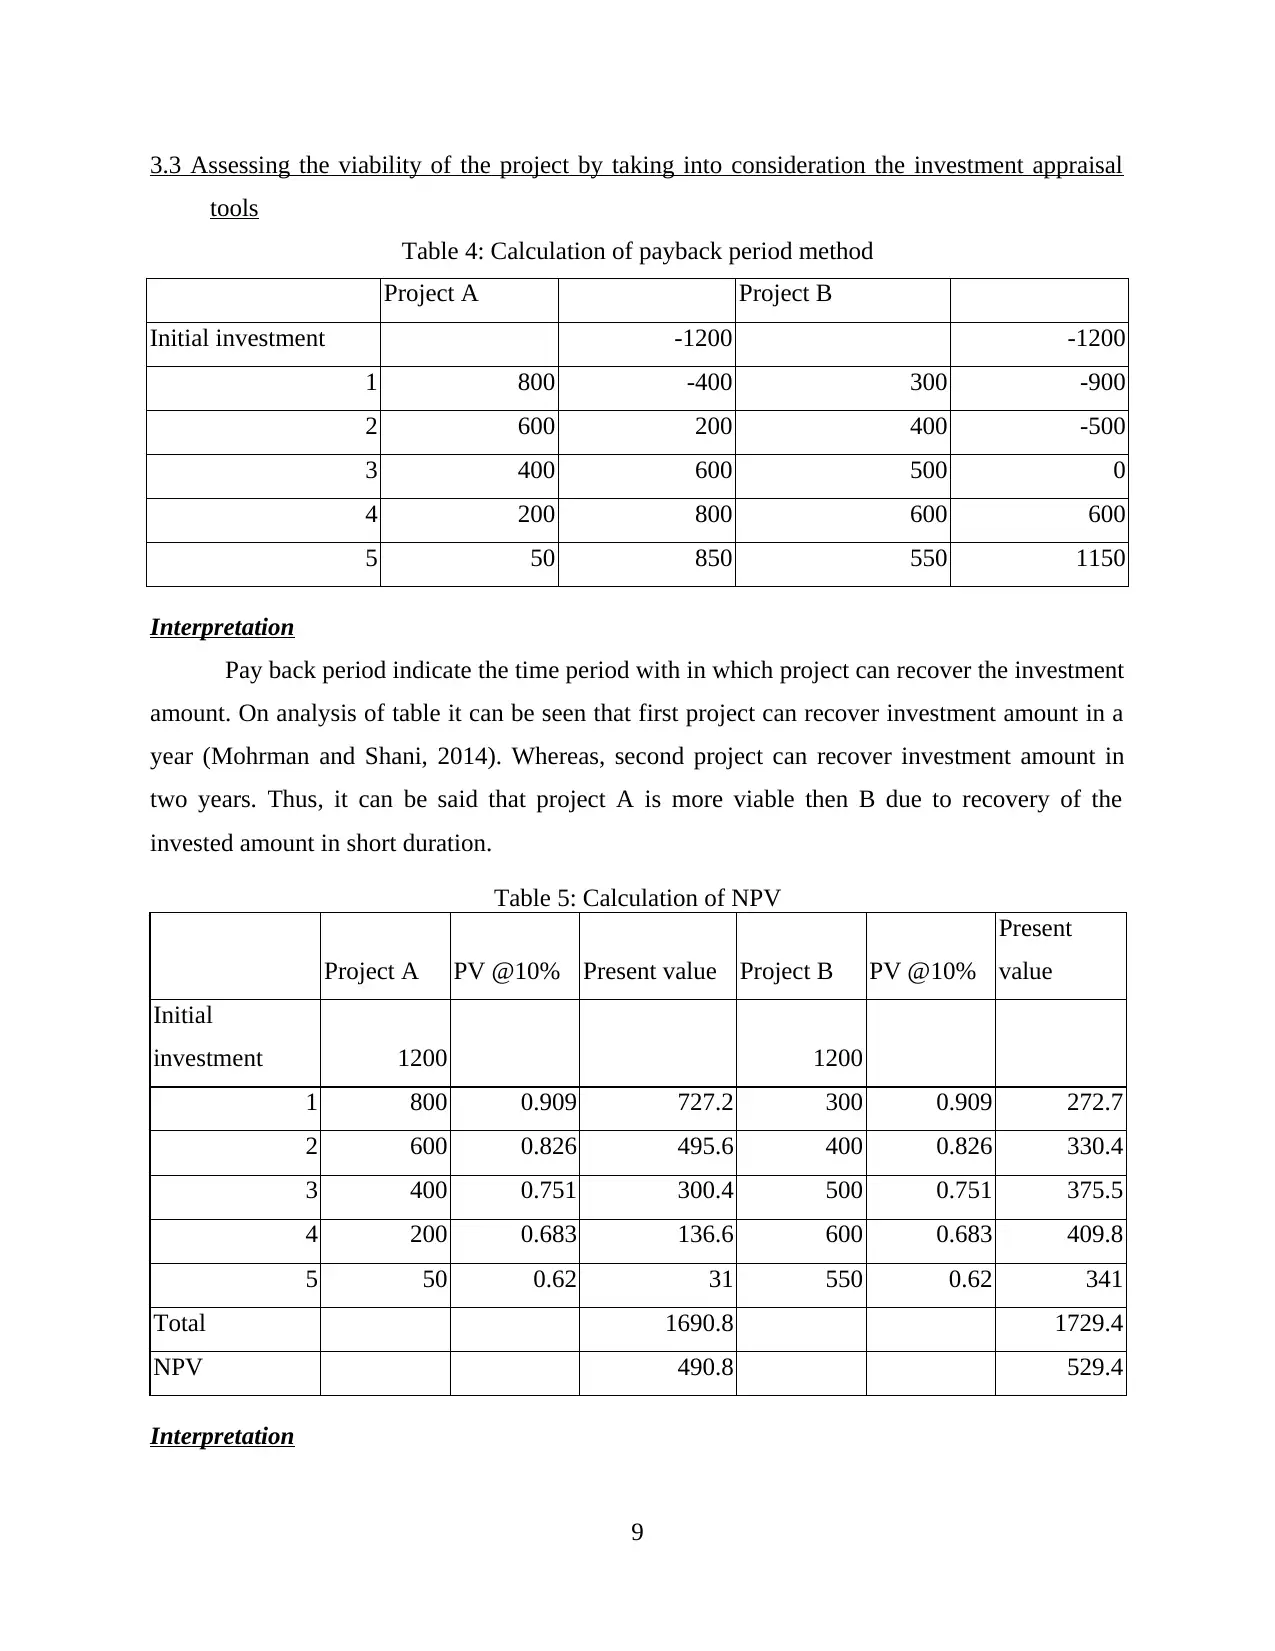
Interpretation
Pay back period indicate the time period with in which project can recover the investment
amount. On analysis of table it can be seen that first project can recover investment amount in a
year (Mohrman and Shani, 2014). Whereas, second project can recover investment amount in
two years. Thus, it can be said that project A is more viable then B due to recovery of the
invested amount in short duration.
Table 5: Calculation of NPV
Project A PV @10% Present value Project B PV @10%
Present
value
Initial
investment 1200 1200
1 800 0.909 727.2 300 0.909 272.7
2 600 0.826 495.6 400 0.826 330.4
3 400 0.751 300.4 500 0.751 375.5
4 200 0.683 136.6 600 0.683 409.8
5 50 0.62 31 550 0.62 341
Total 1690.8 1729.4
NPV 490.8 529.4
Interpretation
9
tools
Table 4: Calculation of payback period method
Project A Project B
Initial investment -1200 -1200
1 800 -400 300 -900
2 600 200 400 -500
3 400 600 500 0
4 200 800 600 600
5 50 850 550 1150
Interpretation
Pay back period indicate the time period with in which project can recover the investment
amount. On analysis of table it can be seen that first project can recover investment amount in a
year (Mohrman and Shani, 2014). Whereas, second project can recover investment amount in
two years. Thus, it can be said that project A is more viable then B due to recovery of the
invested amount in short duration.
Table 5: Calculation of NPV
Project A PV @10% Present value Project B PV @10%
Present
value
Initial
investment 1200 1200
1 800 0.909 727.2 300 0.909 272.7
2 600 0.826 495.6 400 0.826 330.4
3 400 0.751 300.4 500 0.751 375.5
4 200 0.683 136.6 600 0.683 409.8
5 50 0.62 31 550 0.62 341
Total 1690.8 1729.4
NPV 490.8 529.4
Interpretation
9
⊘ This is a preview!⊘
Do you want full access?
Subscribe today to unlock all pages.
Trusted by 1+ million students worldwide
1 out of 23
Related Documents


Your All-in-One AI-Powered Toolkit for Academic Success.
+13062052269
info@desklib.com
Available 24*7 on WhatsApp / Email
![[object Object]](/_next/static/media/star-bottom.7253800d.svg)
Unlock your academic potential
Copyright © 2020–2026 A2Z Services. All Rights Reserved. Developed and managed by ZUCOL.