Financial Performance Analysis: Contribution and Investment Decisions

Verified

Added on  2022/09/07

|9
|1717
|21
Report
AI Summary
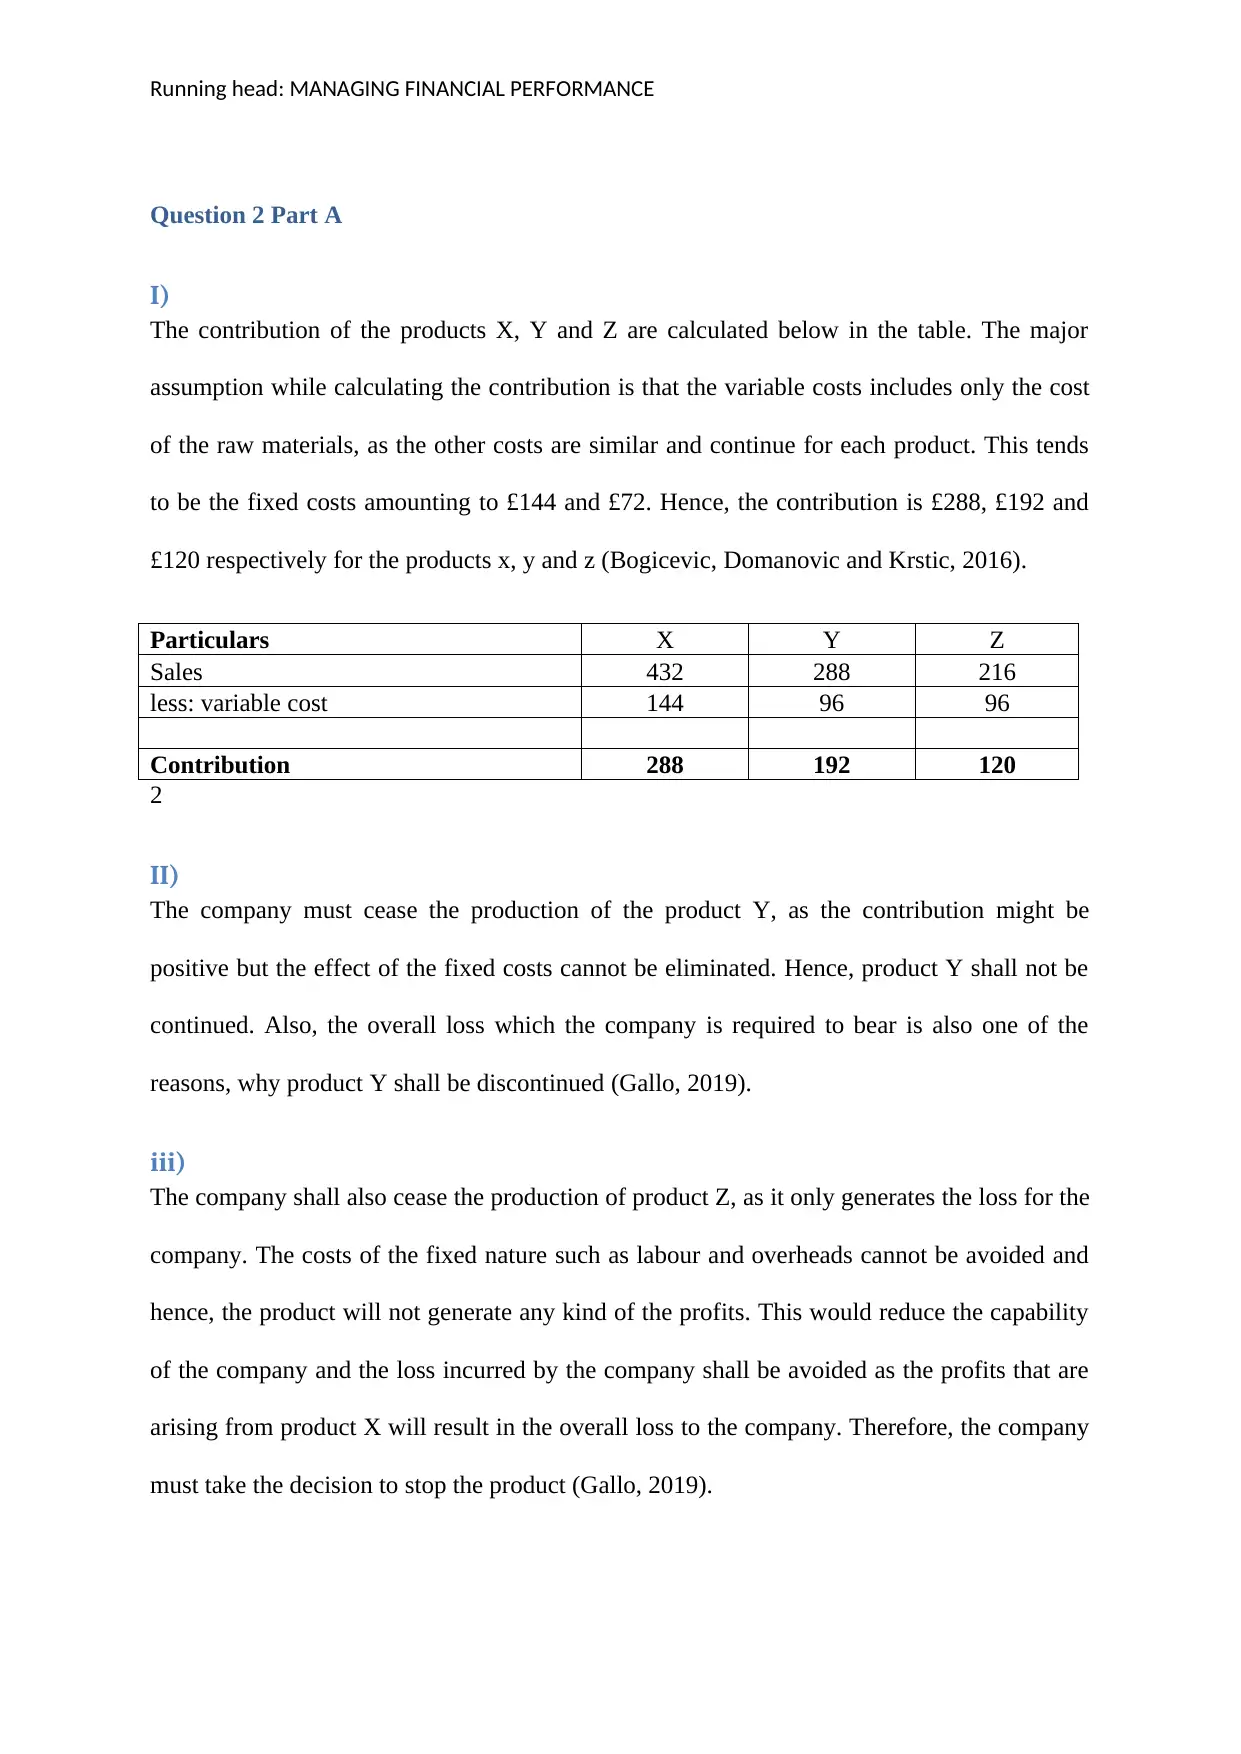
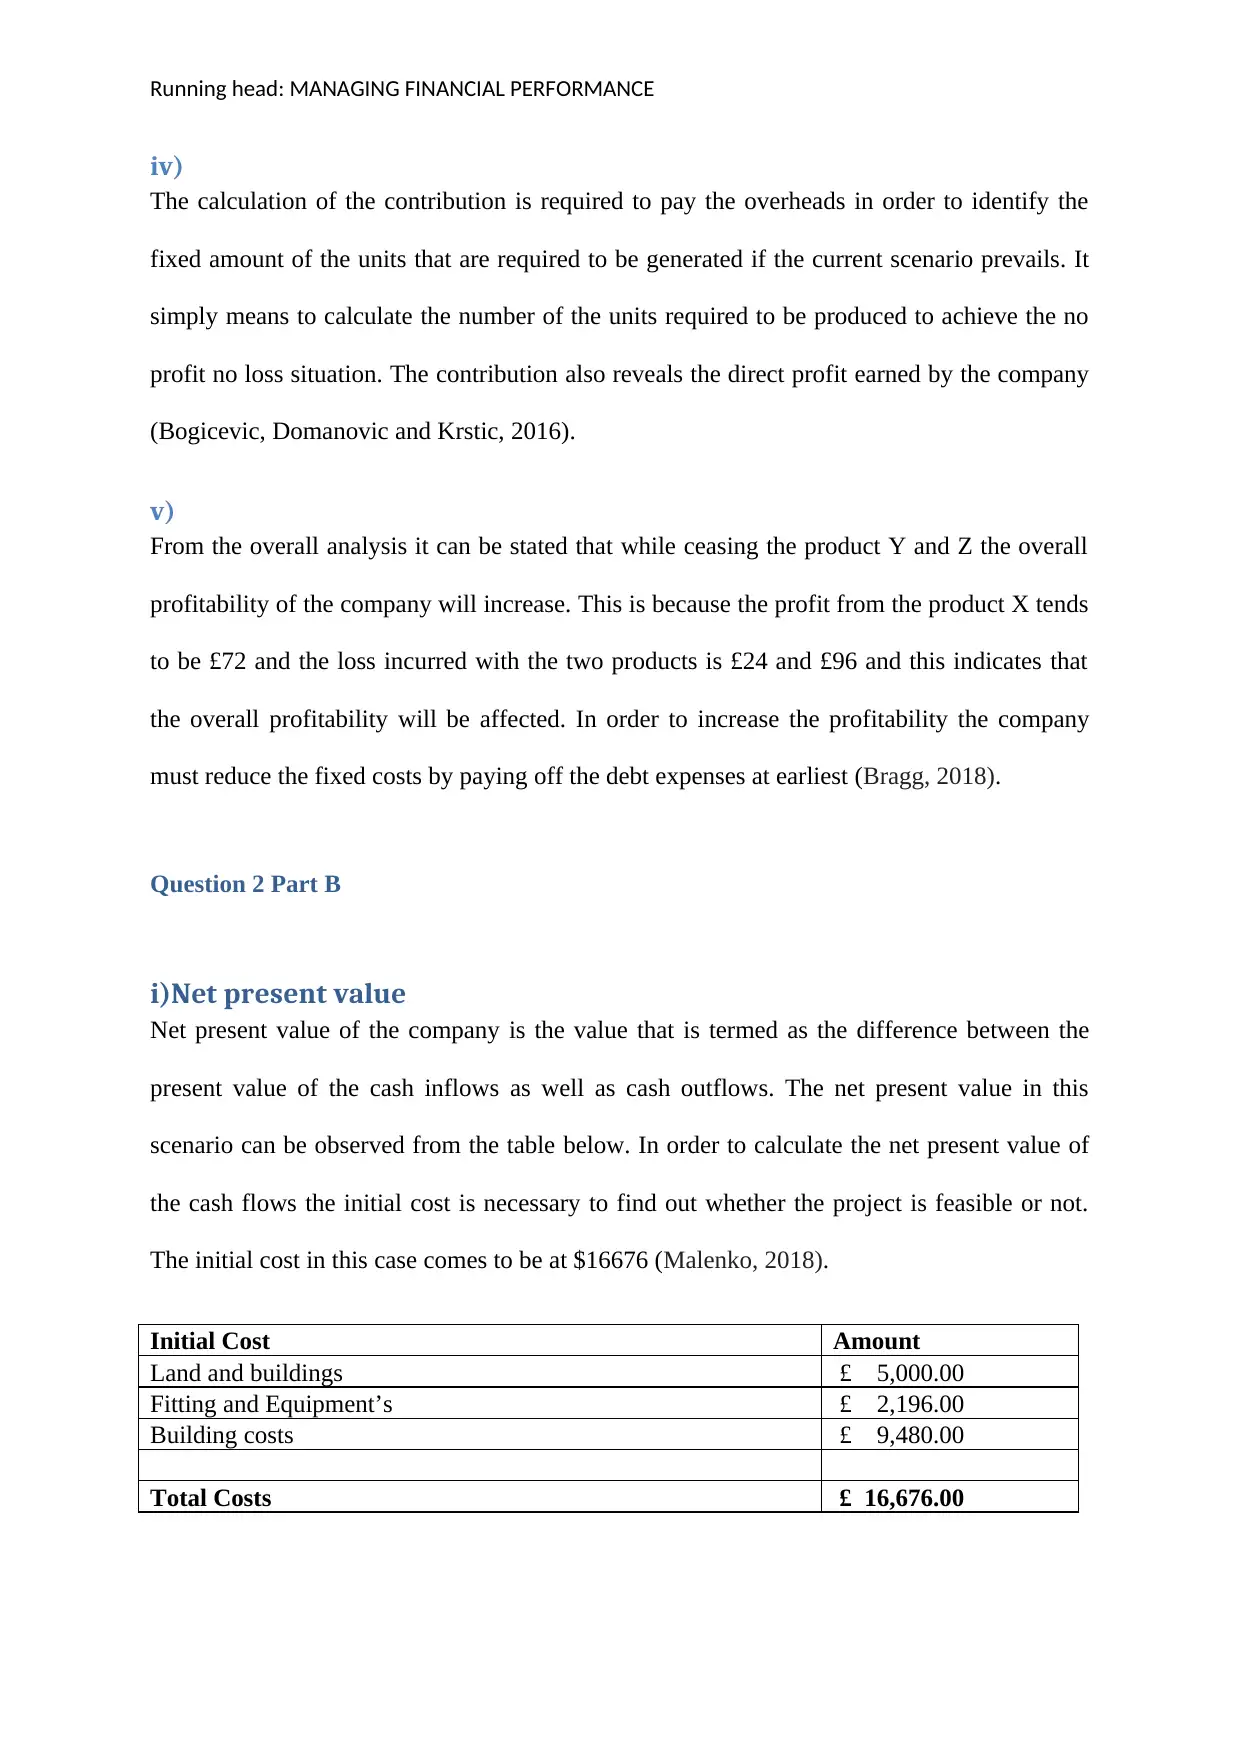
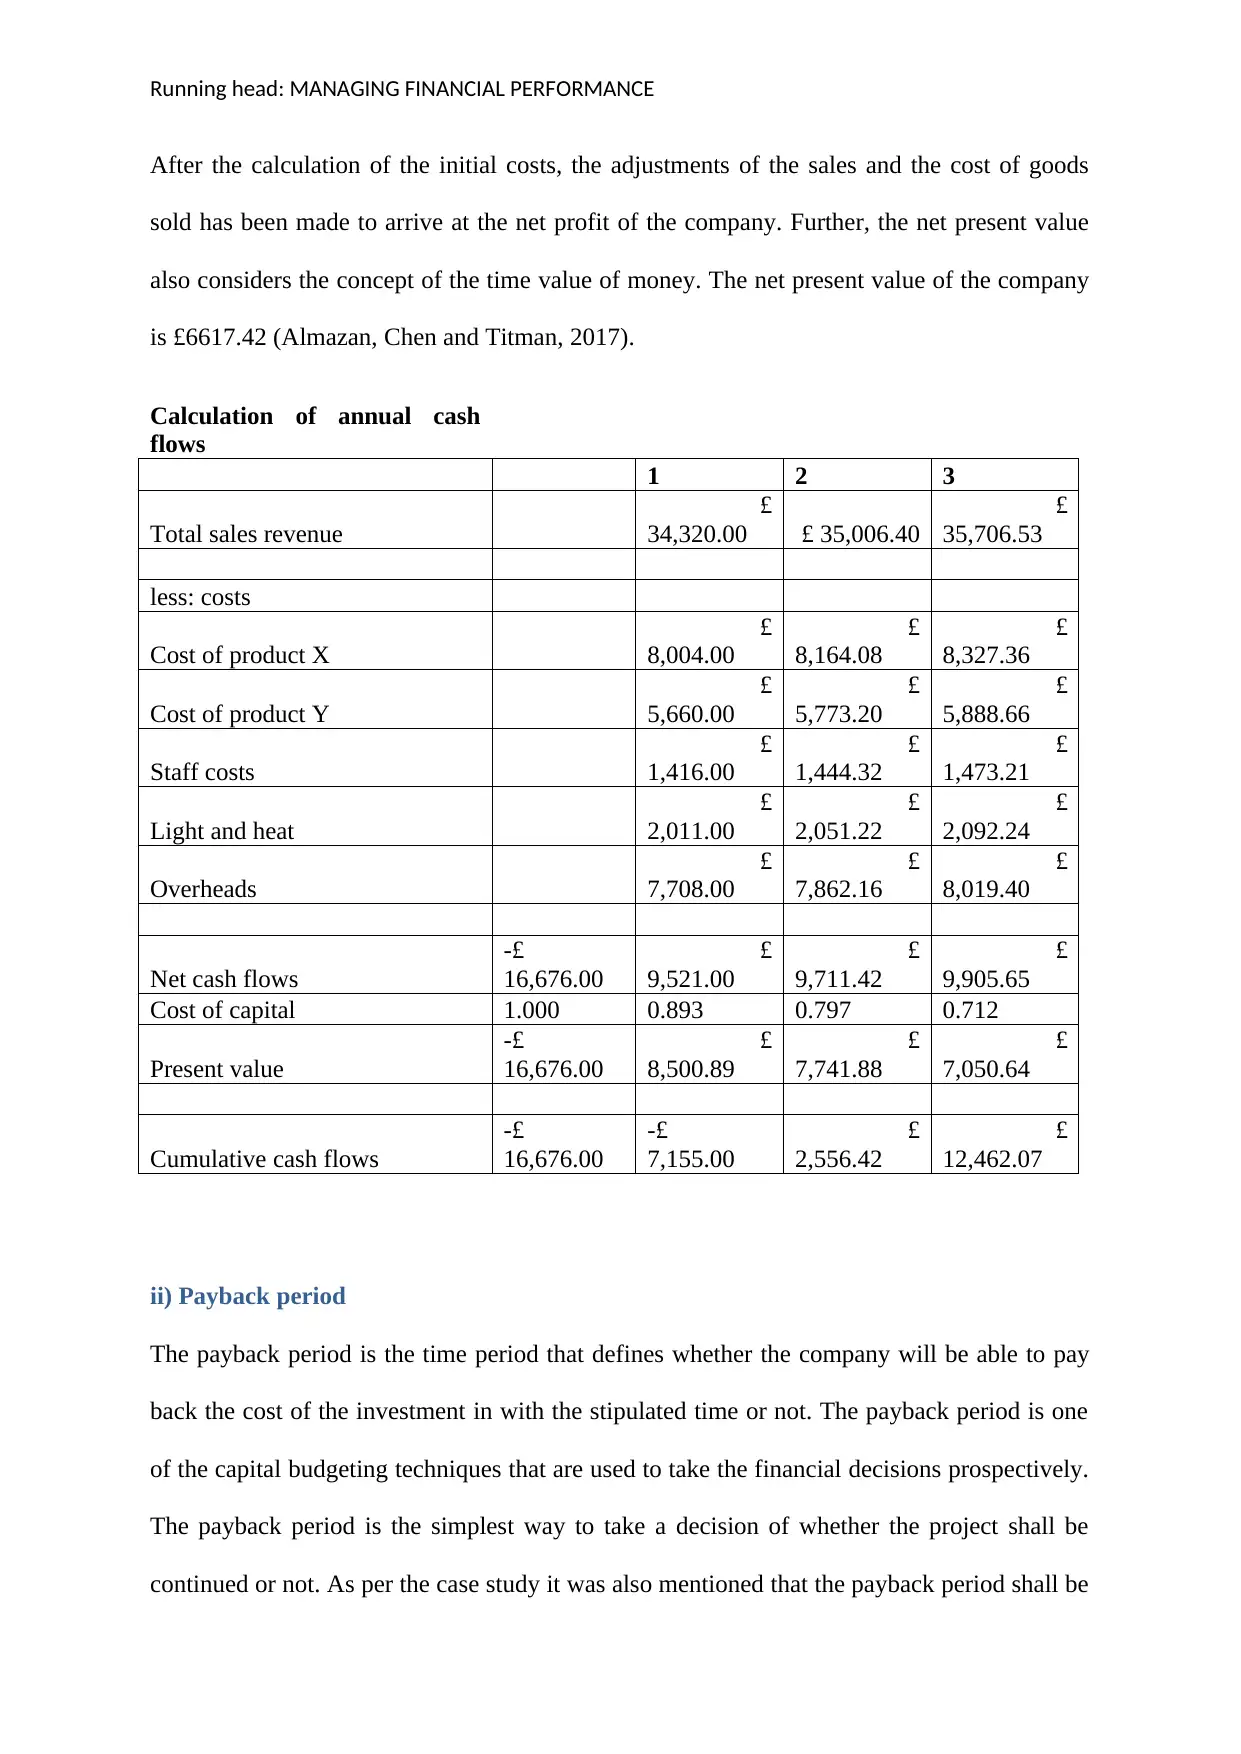
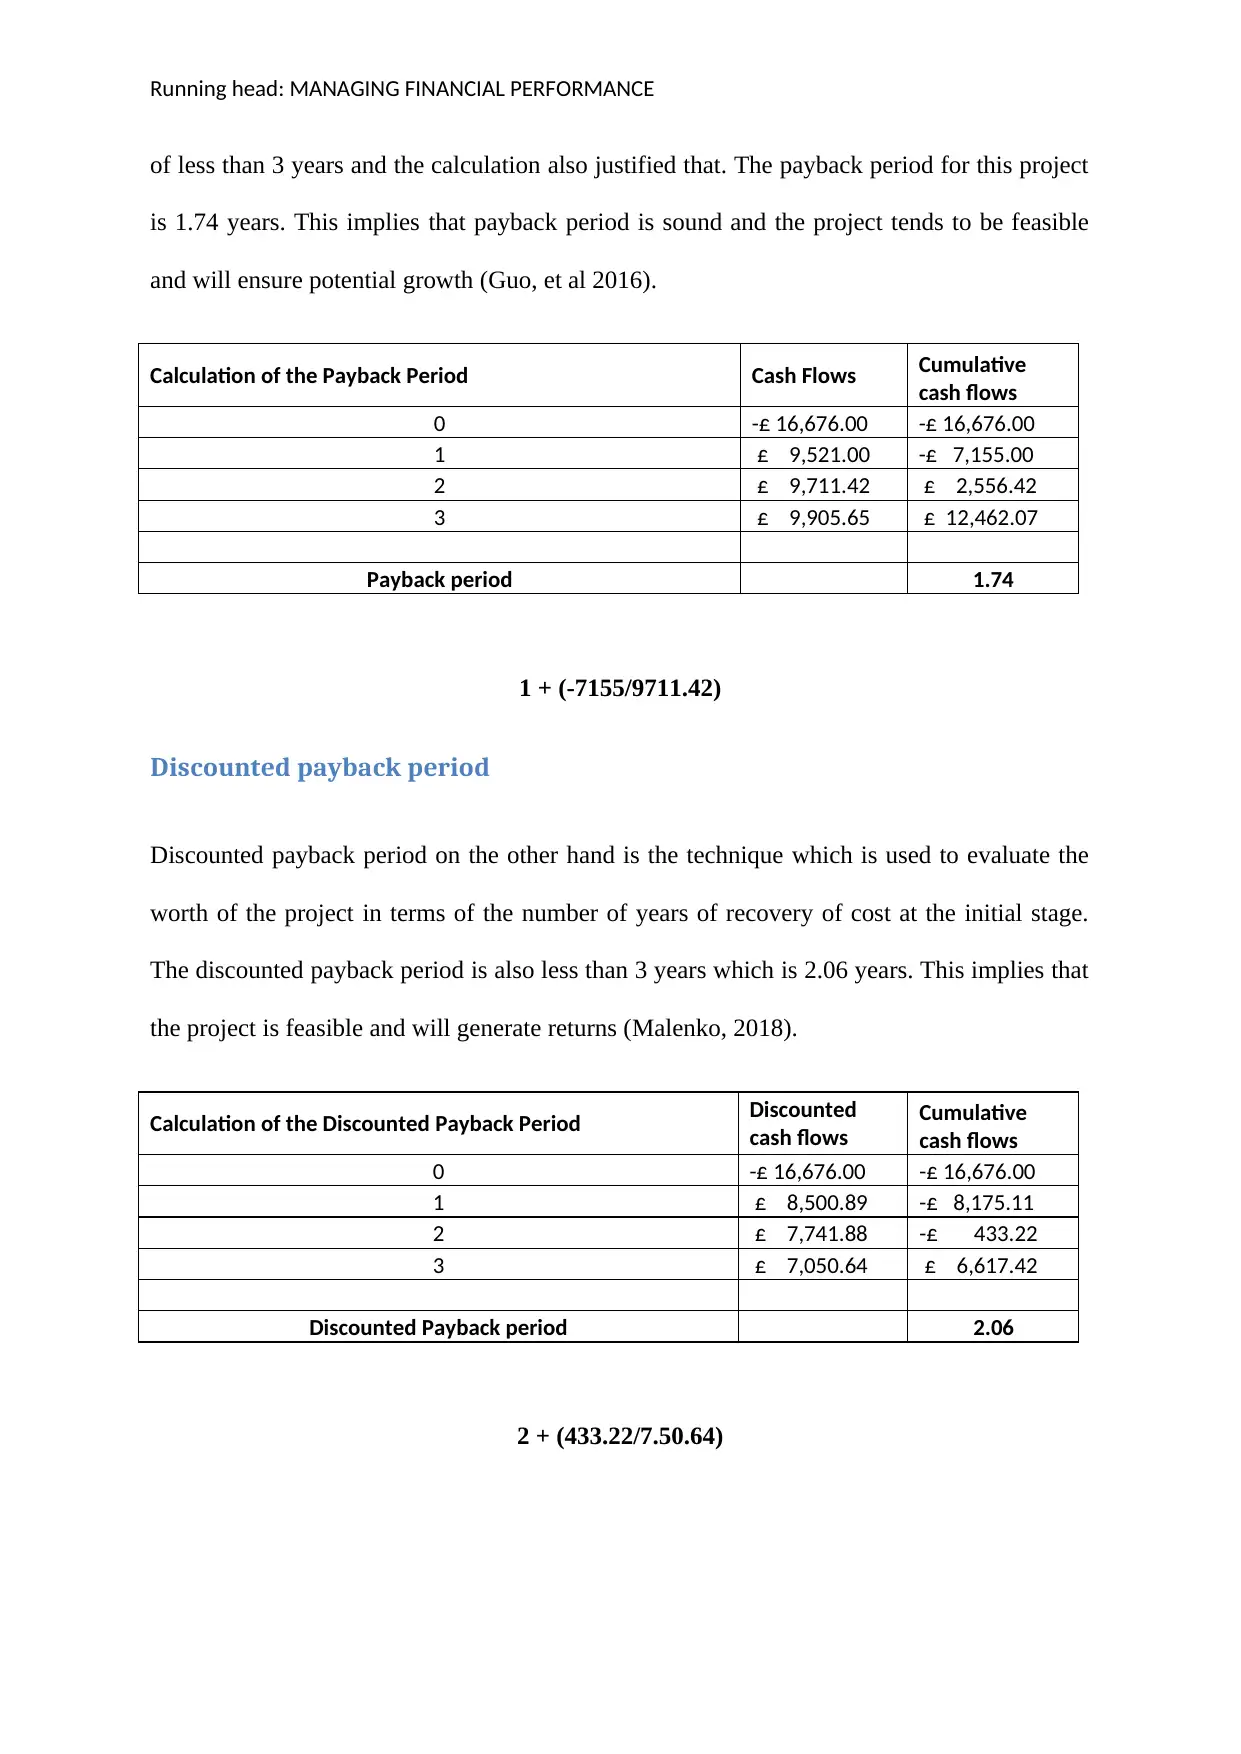
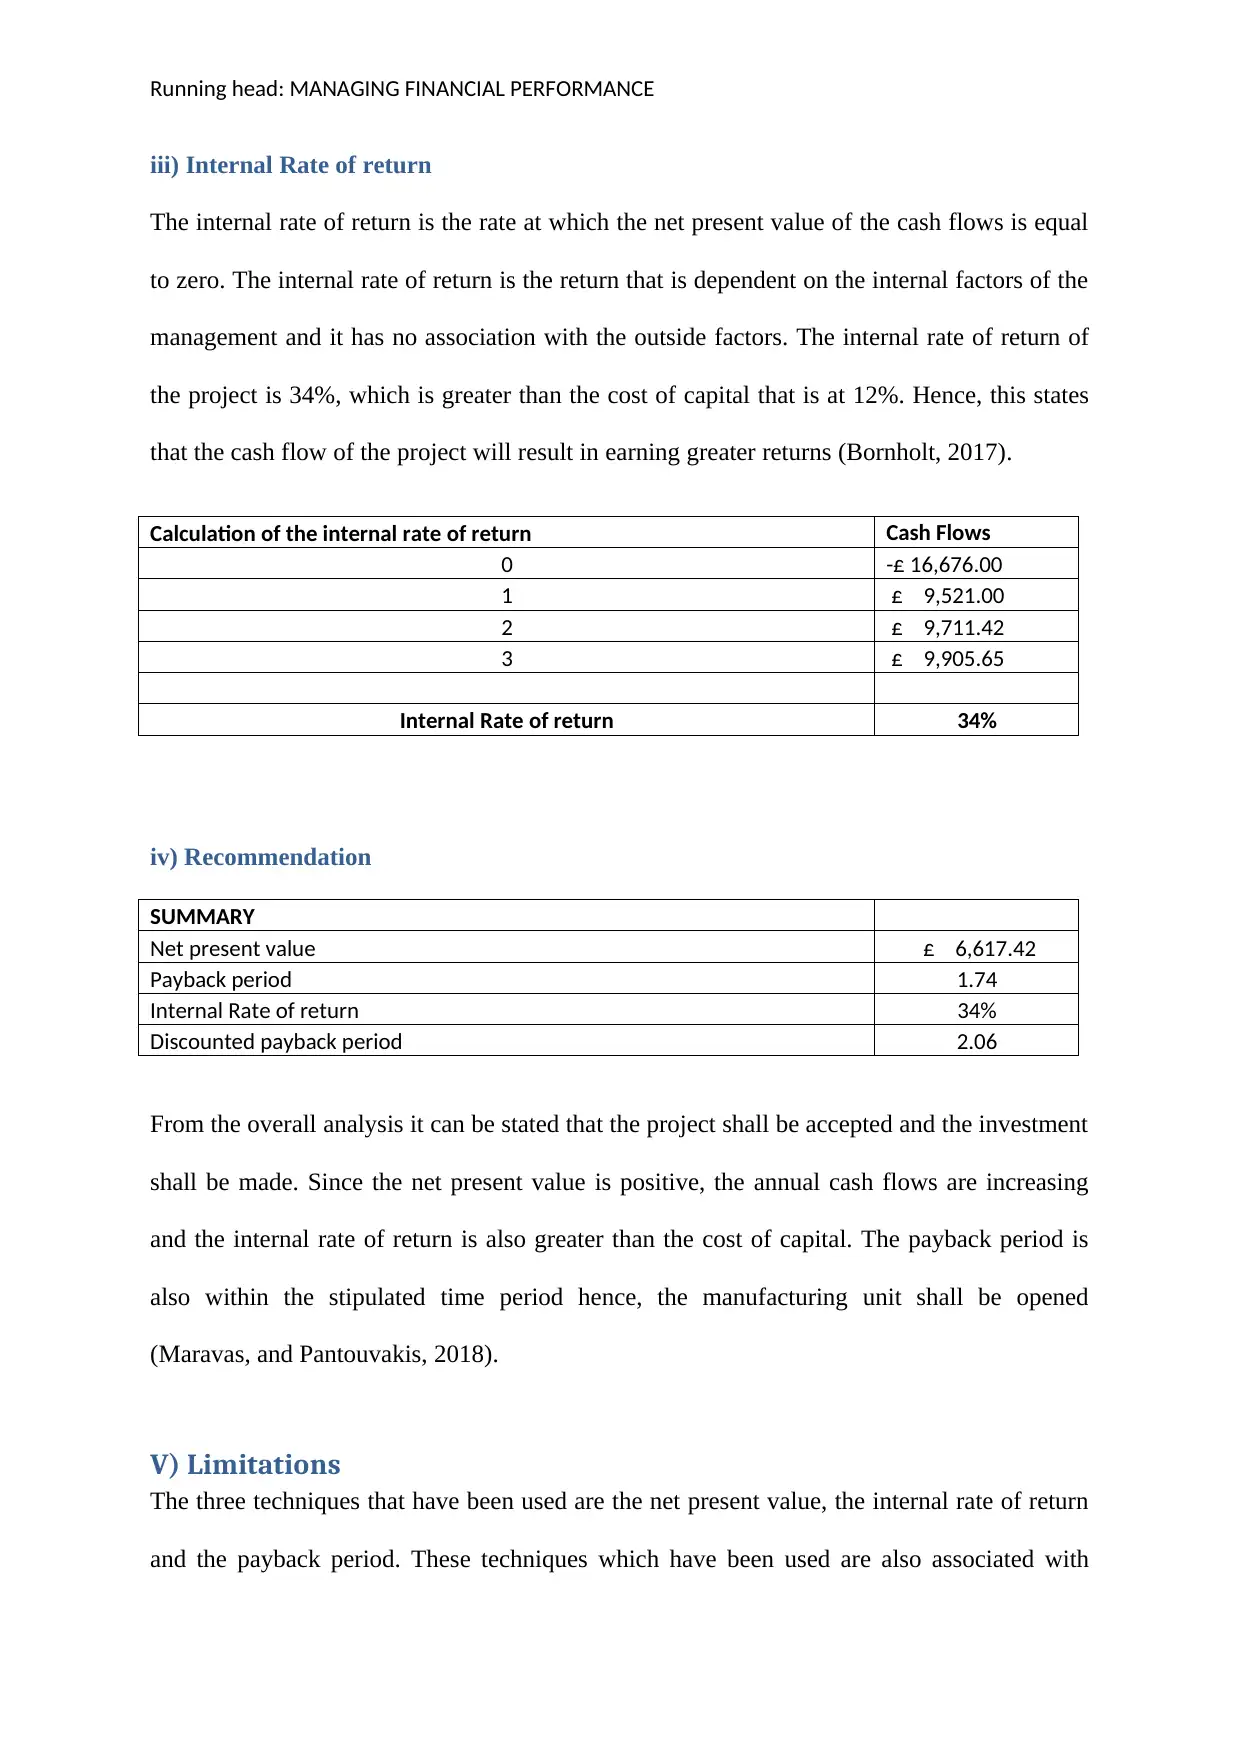
This report presents a comprehensive financial analysis of a company's performance, focusing on product profitability and investment appraisal. The analysis begins with calculating the contribution of each product (X, Y, and Z), considering sales and variable costs, and evaluating whether the company should cease production of certain products based on their contribution margins and impact on overall profitability. The report then delves into capital budgeting techniques, including the calculation of net present value (NPV), payback period, discounted payback period, and internal rate of return (IRR) for a potential investment. The analysis evaluates the feasibility of the investment by comparing these metrics against the cost of capital and other benchmarks. The report concludes with recommendations regarding the investment decision and acknowledges the limitations of the methods employed, providing a well-rounded perspective on financial decision-making.
tabler-icon-diamond-filled.svg

Contribute Materials

Your contribution can guide someone’s learning journey. Share your documents today.
Document Page
Running head: MANAGING FINANCIAL PERFORMANCE
1
MANAGING FINANCIAL PERFORMANCE
tabler-icon-diamond-filled.svg

Secure Best Marks with AI Grader

Need help grading? Try our AI Grader for instant feedback on your assignments.
Document Page
Running head: MANAGING FINANCIAL PERFORMANCE
Table of Contents
Question 2 Part A.......................................................................................................................3
I).............................................................................................................................................3
II)............................................................................................................................................3
iii)...........................................................................................................................................3
iv)............................................................................................................................................4
v).............................................................................................................................................4
Question 2 Part B.......................................................................................................................4
i)Net present value.....................................................................................................................4
ii) Payback period......................................................................................................................5
Discounted payback period....................................................................................................6
iii) Internal Rate of return..........................................................................................................7
iv) Recommendation..................................................................................................................7
V) Limitations............................................................................................................................7
References..................................................................................................................................9
Document Page
Running head: MANAGING FINANCIAL PERFORMANCE
Question 2 Part A
I)
The contribution of the products X, Y and Z are calculated below in the table. The major
assumption while calculating the contribution is that the variable costs includes only the cost
of the raw materials, as the other costs are similar and continue for each product. This tends
to be the fixed costs amounting to £144 and £72. Hence, the contribution is £288, £192 and
£120 respectively for the products x, y and z (Bogicevic, Domanovic and Krstic, 2016).
Particulars X Y Z
Sales 432 288 216
less: variable cost 144 96 96
Contribution 288 192 120
2
II)
The company must cease the production of the product Y, as the contribution might be
positive but the effect of the fixed costs cannot be eliminated. Hence, product Y shall not be
continued. Also, the overall loss which the company is required to bear is also one of the
reasons, why product Y shall be discontinued (Gallo, 2019).
iii)
The company shall also cease the production of product Z, as it only generates the loss for the
company. The costs of the fixed nature such as labour and overheads cannot be avoided and
hence, the product will not generate any kind of the profits. This would reduce the capability
of the company and the loss incurred by the company shall be avoided as the profits that are
arising from product X will result in the overall loss to the company. Therefore, the company
must take the decision to stop the product (Gallo, 2019).
Document Page
Running head: MANAGING FINANCIAL PERFORMANCE
iv)
The calculation of the contribution is required to pay the overheads in order to identify the
fixed amount of the units that are required to be generated if the current scenario prevails. It
simply means to calculate the number of the units required to be produced to achieve the no
profit no loss situation. The contribution also reveals the direct profit earned by the company
(Bogicevic, Domanovic and Krstic, 2016).
v)
From the overall analysis it can be stated that while ceasing the product Y and Z the overall
profitability of the company will increase. This is because the profit from the product X tends
to be £72 and the loss incurred with the two products is £24 and £96 and this indicates that
the overall profitability will be affected. In order to increase the profitability the company
must reduce the fixed costs by paying off the debt expenses at earliest (Bragg, 2018).
Question 2 Part B
i)Net present value
Net present value of the company is the value that is termed as the difference between the
present value of the cash inflows as well as cash outflows. The net present value in this
scenario can be observed from the table below. In order to calculate the net present value of
the cash flows the initial cost is necessary to find out whether the project is feasible or not.
The initial cost in this case comes to be at $16676 (Malenko, 2018).
Initial Cost Amount
Land and buildings £ 5,000.00
Fitting and Equipment’s £ 2,196.00
Building costs £ 9,480.00
Total Costs £ 16,676.00
tabler-icon-diamond-filled.svg

Secure Best Marks with AI Grader

Need help grading? Try our AI Grader for instant feedback on your assignments.
Document Page
Running head: MANAGING FINANCIAL PERFORMANCE
After the calculation of the initial costs, the adjustments of the sales and the cost of goods
sold has been made to arrive at the net profit of the company. Further, the net present value
also considers the concept of the time value of money. The net present value of the company
is £6617.42 (Almazan, Chen and Titman, 2017).
Calculation of annual cash
flows
1 2 3
Total sales revenue
£
34,320.00 £ 35,006.40
£
35,706.53
less: costs
Cost of product X
£
8,004.00
£
8,164.08
£
8,327.36
Cost of product Y
£
5,660.00
£
5,773.20
£
5,888.66
Staff costs
£
1,416.00
£
1,444.32
£
1,473.21
Light and heat
£
2,011.00
£
2,051.22
£
2,092.24
Overheads
£
7,708.00
£
7,862.16
£
8,019.40
Net cash flows

16,676.00
£
9,521.00
£
9,711.42
£
9,905.65
Cost of capital 1.000 0.893 0.797 0.712
Present value

16,676.00
£
8,500.89
£
7,741.88
£
7,050.64
Cumulative cash flows

16,676.00

7,155.00
£
2,556.42
£
12,462.07
ii) Payback period
The payback period is the time period that defines whether the company will be able to pay
back the cost of the investment in with the stipulated time or not. The payback period is one
of the capital budgeting techniques that are used to take the financial decisions prospectively.
The payback period is the simplest way to take a decision of whether the project shall be
continued or not. As per the case study it was also mentioned that the payback period shall be
Document Page
Running head: MANAGING FINANCIAL PERFORMANCE
of less than 3 years and the calculation also justified that. The payback period for this project
is 1.74 years. This implies that payback period is sound and the project tends to be feasible
and will ensure potential growth (Guo, et al 2016).
Calculation of the Payback Period Cash Flows Cumulative
cash flows
0 -£ 16,676.00 -£ 16,676.00
1 £ 9,521.00 7,155.00
2 £ 9,711.42 £ 2,556.42
3 £ 9,905.65 £ 12,462.07
Payback period 1.74
1 + (-7155/9711.42)
Discounted payback period
Discounted payback period on the other hand is the technique which is used to evaluate the
worth of the project in terms of the number of years of recovery of cost at the initial stage.
The discounted payback period is also less than 3 years which is 2.06 years. This implies that
the project is feasible and will generate returns (Malenko, 2018).
Calculation of the Discounted Payback Period Discounted
cash flows
Cumulative
cash flows
0 -£ 16,676.00 -£ 16,676.00
1 £ 8,500.89 8,175.11
2 £ 7,741.88 433.22
3 £ 7,050.64 £ 6,617.42
Discounted Payback period 2.06
2 + (433.22/7.50.64)
Document Page
Running head: MANAGING FINANCIAL PERFORMANCE
iii) Internal Rate of return
The internal rate of return is the rate at which the net present value of the cash flows is equal
to zero. The internal rate of return is the return that is dependent on the internal factors of the
management and it has no association with the outside factors. The internal rate of return of
the project is 34%, which is greater than the cost of capital that is at 12%. Hence, this states
that the cash flow of the project will result in earning greater returns (Bornholt, 2017).
Calculation of the internal rate of return Cash Flows
0 -£ 16,676.00
1 £ 9,521.00
2 £ 9,711.42
3 £ 9,905.65
Internal Rate of return 34%
iv) Recommendation
SUMMARY
Net present value £ 6,617.42
Payback period 1.74
Internal Rate of return 34%
Discounted payback period 2.06
From the overall analysis it can be stated that the project shall be accepted and the investment
shall be made. Since the net present value is positive, the annual cash flows are increasing
and the internal rate of return is also greater than the cost of capital. The payback period is
also within the stipulated time period hence, the manufacturing unit shall be opened
(Maravas, and Pantouvakis, 2018).
V) Limitations
The three techniques that have been used are the net present value, the internal rate of return
and the payback period. These techniques which have been used are also associated with
tabler-icon-diamond-filled.svg

Paraphrase This Document

Need a fresh take? Get an instant paraphrase of this document with our AI Paraphraser
Document Page
Running head: MANAGING FINANCIAL PERFORMANCE
certain kind of limitations which are determined below. The major limitation of the net profit
is that it is a complex process to calculate. The payback period alone is not sufficient ot
decide whether the project shall be accepted or not. Lastly the internal rate of return is that it
ignores the factors like future costs and the duration of the project.
Document Page
Running head: MANAGING FINANCIAL PERFORMANCE
References
Almazan, A., Chen, Z. and Titman, S., 2017. Firm Investment and Stakeholder Choices: A
Top‐Down Theory of Capital Budgeting. The Journal of Finance, 72(5), pp.2179-2228.
Bogicevic, J., Domanovic, V. and Krstic, B., 2016. The role of financial and non-financial
performance indicators in enterprise sustainability evaluation. Ekonomika, 62(3), pp.1-13.
Bornholt, G., 2017. What is an Investment Project's Implied Rate of Return?. Abacus, 53(4),
pp.513-526.
Bragg, S.M., 2018. The Interpretation of Financial Statements. AccountingTools,
Incorporated.
Gallo, A. 2019 Contribution Margin: What It Is, How to Calculate It, and Why You Need It
[Online] Available from https://hbr.org/2017/10/contribution-margin-what-it-is-how-to-
calculate-it-and-why-you-need-it [Accessed on 4th January 2019].
Guo, Y., Zhou, W., Luo, C., Liu, C. and Xiong, H., 2016. Instance-based credit risk
assessment for investment decisions in P2P lending. European Journal of Operational
Research, 249(2), pp.417-426.
Malenko, A., 2018. Optimal dynamic capital budgeting. Available at SSRN 1710884.
Maravas, A. and Pantouvakis, J.P., 2018. A New Approach to Studying Net Present Value
and the Internal Rate of Return of Engineering Projects under Uncertainty with Three-
Dimensional Graphs. Advances in Civil Engineering, 2018.
chevron_up_icon
1 out of 9
circle_padding
hide_on_mobile
zoom_out_icon
logo.png

Your All-in-One AI-Powered Toolkit for Academic Success.

Available 24*7 on WhatsApp / Email

[object Object]