Managing Financial Resources Report: Ratio Analysis and Variance
VerifiedAdded on 2022/12/14
|10
|2051
|264
Report
AI Summary
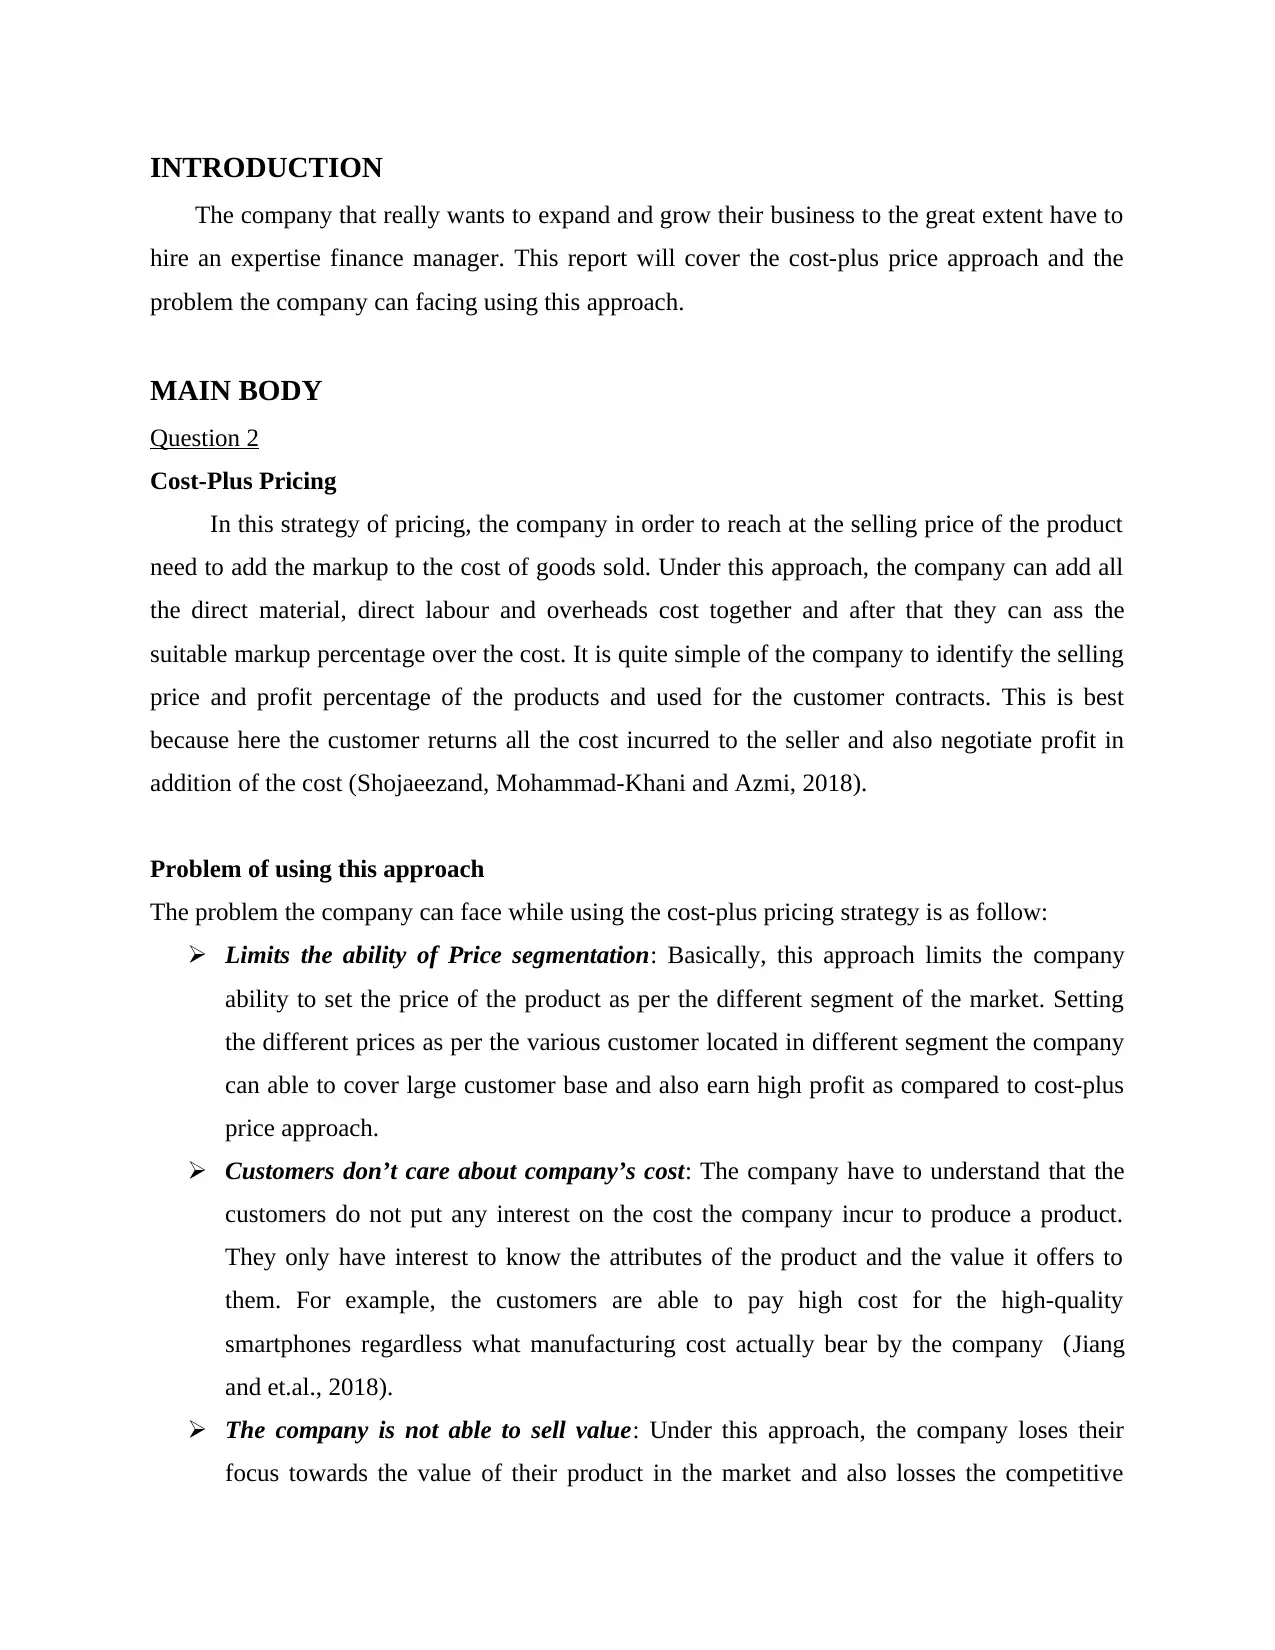
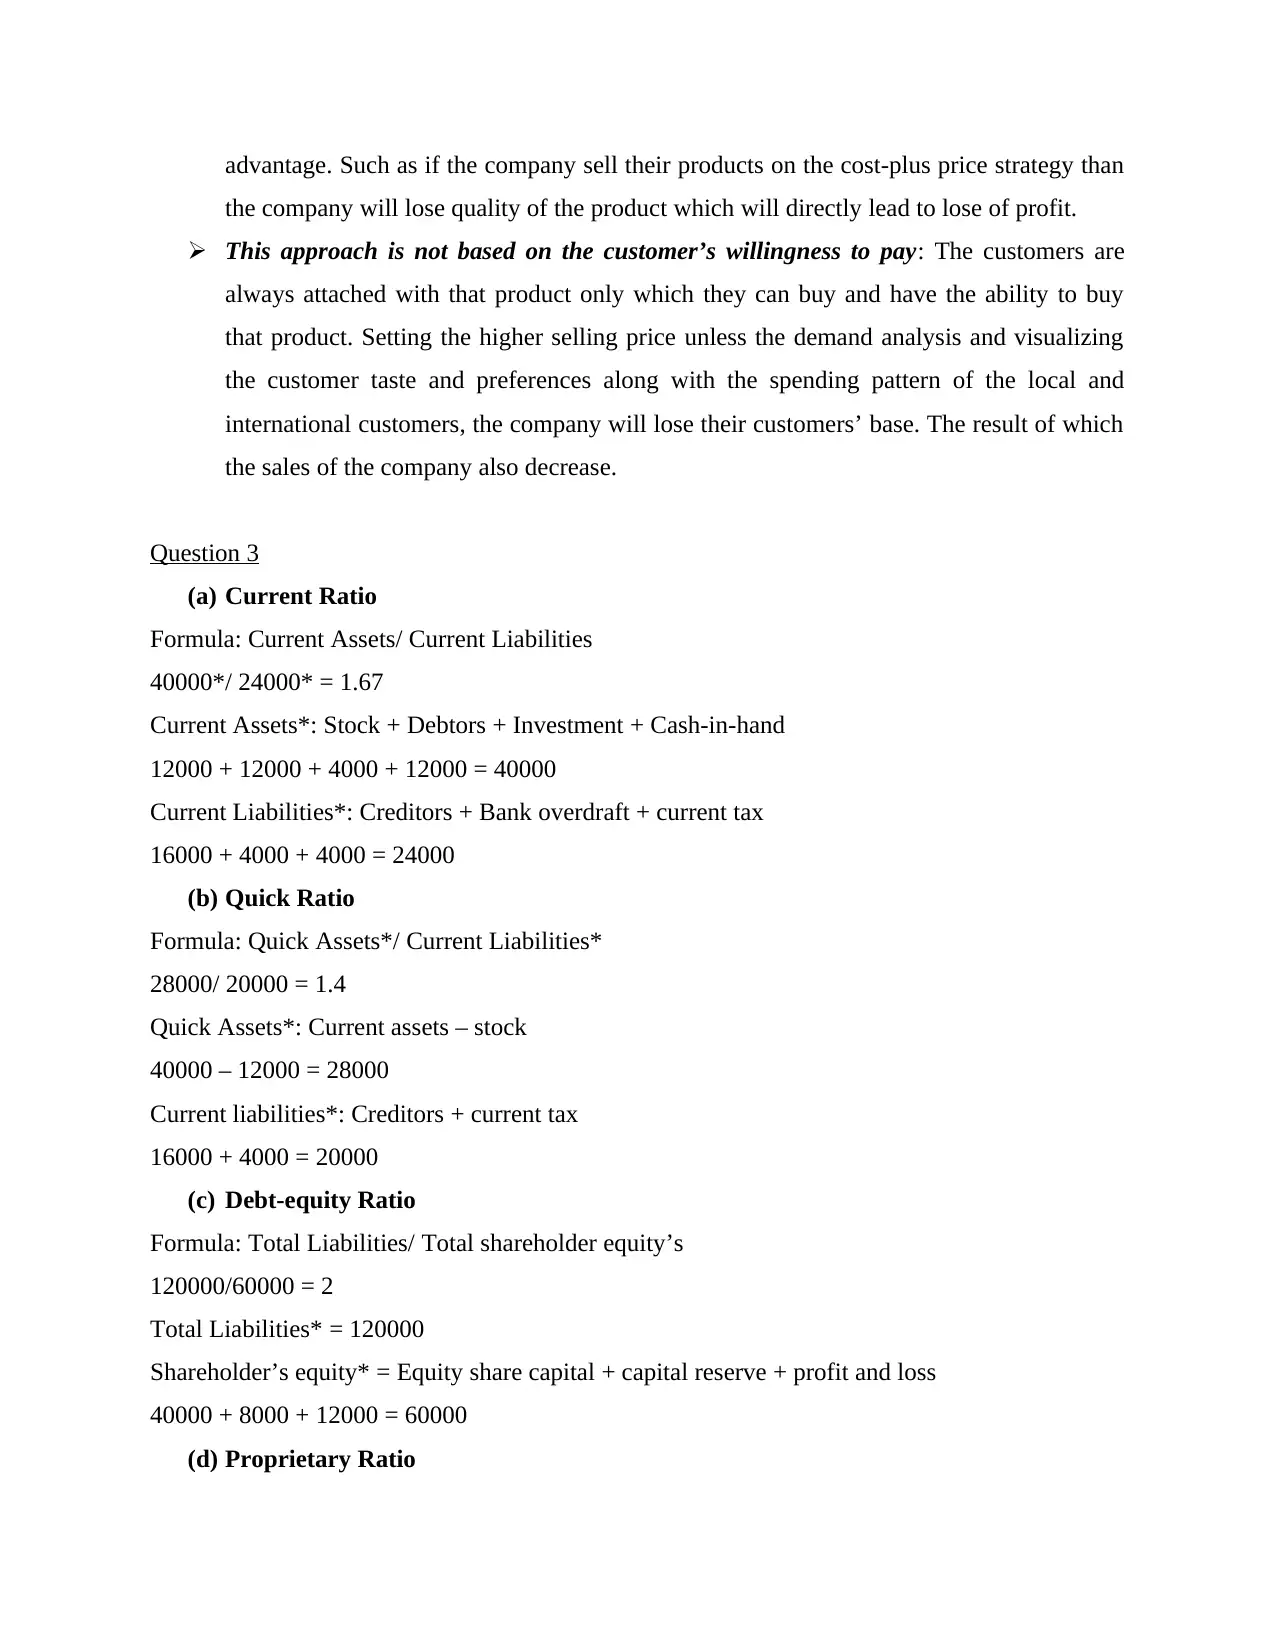
This report delves into the critical aspects of managing financial resources, providing a comprehensive analysis of key concepts. It begins by examining the cost-plus pricing approach, outlining its application and potential drawbacks for businesses, such as limitations in price segmentation and a disconnect from customer value. The report then proceeds to calculate and interpret various financial ratios, including the current ratio, quick ratio, debt-equity ratio, and proprietary ratio, using provided financial data. Furthermore, it explores the significance of financial budgets, including sales revenue, production, and cash budgets, as tools for resource allocation and cash flow management. The report also offers detailed explanations and examples of variance analysis, differentiating between adverse and favorable variances and their implications on business performance. Finally, it discusses direct labor variance analysis, highlighting its importance in assessing workforce efficiency and identifying areas for improvement. The report concludes by emphasizing the importance of proactive strategies to minimize variances and optimize financial outcomes, making it a valuable resource for students on Desklib.

MANAGING FINANCIAL
RESOURCES
RESOURCES
Secure Best Marks with AI Grader
Need help grading? Try our AI Grader for instant feedback on your assignments.

Table of Contents
INTRODUCTION...........................................................................................................................3
MAIN BODY..................................................................................................................................3
Question 2....................................................................................................................................3
Question 3....................................................................................................................................4
Question 3....................................................................................................................................5
CONCLUSION................................................................................................................................8
REFERENCES................................................................................................................................1

INTRODUCTION
The company that really wants to expand and grow their business to the great extent have to
hire an expertise finance manager. This report will cover the cost-plus price approach and the
problem the company can facing using this approach.
MAIN BODY
Question 2
Cost-Plus Pricing
In this strategy of pricing, the company in order to reach at the selling price of the product
need to add the markup to the cost of goods sold. Under this approach, the company can add all
the direct material, direct labour and overheads cost together and after that they can ass the
suitable markup percentage over the cost. It is quite simple of the company to identify the selling
price and profit percentage of the products and used for the customer contracts. This is best
because here the customer returns all the cost incurred to the seller and also negotiate profit in
addition of the cost (Shojaeezand, Mohammad-Khani and Azmi, 2018).
Problem of using this approach
The problem the company can face while using the cost-plus pricing strategy is as follow:
Limits the ability of Price segmentation: Basically, this approach limits the company
ability to set the price of the product as per the different segment of the market. Setting
the different prices as per the various customer located in different segment the company
can able to cover large customer base and also earn high profit as compared to cost-plus
price approach.
Customers don’t care about company’s cost: The company have to understand that the
customers do not put any interest on the cost the company incur to produce a product.
They only have interest to know the attributes of the product and the value it offers to
them. For example, the customers are able to pay high cost for the high-quality
smartphones regardless what manufacturing cost actually bear by the company (Jiang
and et.al., 2018).
The company is not able to sell value: Under this approach, the company loses their
focus towards the value of their product in the market and also losses the competitive

advantage. Such as if the company sell their products on the cost-plus price strategy than
the company will lose quality of the product which will directly lead to lose of profit.
This approach is not based on the customer’s willingness to pay: The customers are
always attached with that product only which they can buy and have the ability to buy
that product. Setting the higher selling price unless the demand analysis and visualizing
the customer taste and preferences along with the spending pattern of the local and
international customers, the company will lose their customers’ base. The result of which
the sales of the company also decrease.
Question 3
(a) Current Ratio
Formula: Current Assets/ Current Liabilities
40000*/ 24000* = 1.67
Current Assets*: Stock + Debtors + Investment + Cash-in-hand
12000 + 12000 + 4000 + 12000 = 40000
Current Liabilities*: Creditors + Bank overdraft + current tax
16000 + 4000 + 4000 = 24000
(b) Quick Ratio
Formula: Quick Assets*/ Current Liabilities*
28000/ 20000 = 1.4
Quick Assets*: Current assets – stock
40000 – 12000 = 28000
Current liabilities*: Creditors + current tax
16000 + 4000 = 20000
(c) Debt-equity Ratio
Formula: Total Liabilities/ Total shareholder equity’s
120000/60000 = 2
Total Liabilities* = 120000
Shareholder’s equity* = Equity share capital + capital reserve + profit and loss
40000 + 8000 + 12000 = 60000
(d) Proprietary Ratio
Secure Best Marks with AI Grader
Need help grading? Try our AI Grader for instant feedback on your assignments.

Formula: Shareholder’s fund/ Total Assets* 100
60000/ 120000* 100 = 50%
Shareholders’ Funds*: Share capital + reserve and surplus
40000 + 8000 + 12000 = 60000
Total Assets*: 120000
Question 3
Financial Budgets analysis with example
Basically, financial budgets are a big term in which different budgets are prepared by the
company’s managers in order to know the financial performance of the business. Here, the
income and expenses of the business on the both long-term and short-term basis is identified and
get analysis. With the help of this budgets, the company are able to allocate the resources among
the different department and units. This is also preparing and manage by the company in order to
manage the cash flows in the company in a best manner possible (Matsuoka, 2018).
For example:
Particulars Amount
Sales Revenue budget 100000
Production budget 200000
Raw material purchase budget 150000
Capital expenditure budget 50000
Cash budget 250000
Marketing budget 300000
Administration budget 225000
Variance Analysis with example
Variance means the gap between the actual and expected amount. It might be positive
and negative depends upon the circumstances and business production ability. This analysis
helps the management of the company in identifying the key areas from where the gap has been
arises. The company is able to know the reason behind occurrence of this variances where the
actual income will be high and actual expenses will be low. For example, the negative variance
arises when bargaining power of the suppliers increases and positive variance arises when
marketing expenses is low as compared to budgets (Marzlin Marzuki and Ismail, 2019).

Adverse Variance Analysis with example
This case arises when the actual income of the company is less than the budgeted one and
the actual expenses of the business is higher than expected expense. This indicate that the
company need to adopt proper strategy such a pricing strategy to improve their business
performance and productivity. It might be arising because of the overall increase in the market
price of the raw material etc (Felix and et.al., 2020).
For example:
Budgeted sales unit: 1500
Budgeted selling price: 25
Actual units sold: 1200
Actual selling price: 20
Sales variance: 1200*20 – 1500* 25
24000 – 37500 = (13500) Adverse
Favourable Variance Analysis with example
Favourable variance analysis means that the actual figure of the income is higher than the
budgeted figure of the income and vice versa for expense. This is basically a positive gap
between the actual amount and expected amount of a respective period. This is arising in the
company when company perform better than what it actually expected. Favourable variance
indicates better performance of the business regular activity.
For example:
Budgeted sales unit: 1200
Budgeted selling price: 20
Actual units sold: 1500
Actual selling price: 25
Sales variance: 1500*25 – 1200* 20
37500 – 24000 = 13500 favourable
Positive Variances with example

Every company prepared budgets in order to know the expected sales the company will
made and the expected expenses the company will incur in future. After earning the actual
income and incurring the actual expenses, the company analysis their actual figures with the
budgets. Basically, positive variance is another name of favourable variance. For example; if a
company prepare a budget of 10000 expense and spends 8000 in reality than after subtracting the
actual with budget i.e., 10000 – 8000 = 2000 is a positive variance. And this is causes because
the actual expenses of the company are lower than the budget (Alaica and et.al., 2019).
Negative Variance analysis with example
A negative variance is another name of the adverse and unfavourable variance which
indicate in the form of expenses, net income and revenue. Here, the variance is also calculated
for direct material usage and direct labour etc. If the actual expense of the company is higher
than the expected one for example the budgeted admin expense of the company is 30000 and
actual admin expense of the company is 40000 so this 10000 is a negative variance because of
the high expenses. This can be eliminated by the proper analysis of the expenses and also by
allocation of expected item to another budget line (Özşahin and et.al., 2019).
Direct Labour Variance Analysis with example
It is difference between the actual hours worked by the employee for the production of
units and the expected hours that need to be worked as per the budgets. But because of the
inefficiency of employees and lack of motivation by the management the employees are unable
to do so it is known as adverse labour variance. And if the actual working hours is high than
expected working hours than it is known as favourable labour variance. It may be causes because
of the unskilled labour or high wage rate. If the company assigned the high-level task to the
poorly trained employees than such unfavourable variance is definitely arises. That’s why it is
advisable to the company’s manager that they must manage a strong relation with each of the
worker to know their strength and weaknesses. By doing so the managers can motivate the
employee to work hard (Rodrigues and Rodrigues, 2018).
For example:
Standard hours worked: 1800 hours
Standard labour rate per hour: 6.50
Paraphrase This Document
Need a fresh take? Get an instant paraphrase of this document with our AI Paraphraser

Actual labour rate per hour: 6.75
Actual hours worked: 1900 hours
Direct labour efficiency variance: 1900*6.50 – 1800* 6.50
12350 – 11700 = 650 favourable
CONCLUSION
The report concludes the variance analysis along with the concept of favourable and
unfavourable analysis with an example. The report further concludes the ratio calculation and the
direct labour variance concept and their example. Further, the report states that all managers have
to adopt proper strategy to minimize the variance and gap between actual and expected amount.

REFERENCES
Books and journals
Shojaeezand, T., Mohammad-Khani, G. R. and Azmi, P., 2018. Variance analysis of the new
method of applying multiuser detection in a GPS receiver in high dynamic
conditions. Wireless Personal Communications. 98(2). pp.2107-2119.
Jiang, G. and et.al., 2018. Genetic variance analysis and excellent fruit-timber families selection
of half-sib Pinus koraiensis. Bulletin of Botanical Research. 38(5). pp.775-784.
Matsuoka, K., 2018. Variance Analysis in Fixed Revenue Accounting. Fixed Revenue
Accounting: A New Management Accounting Framework. 15. p.69.
Marzlin Marzuki, N. A. R. and Ismail, J., 2019. Benefits and limitations of variance analysis in
management accounting. ACCOUNTING BULLETIN. p.15.
Felix, P. T. and et.al., 2020. Molecular variance analysis (AMOVA) and levels of genetic
diversity of complete genome of SARS-CoV-2 virus from of six South American
Countries.
Rodrigues, L. and Rodrigues, L., 2018. Economic-financial performance of the Brazilian
sugarcane energy industry: An empirical evaluation using financial ratio, cluster and
discriminant analysis. Biomass and bioenergy. 108. pp.289-296.
Alaica, A. K. and et.al., 2019. Variability along the frontier: stable carbon and nitrogen isotope
ratio analysis of human remains from the Late Roman–Early Byzantine cemetery site of
Joan Planells, Ibiza, Spain. Archaeological and Anthropological Sciences. 11(8).
pp.3783-3796.
Özşahin, Ş. and et.al., 2019. Selection of softwood species for structural and non-structural
timber construction by using the analytic hierarchy process (AHP) and the multi-
objective optimization on the basis of ratio analysis (MOORA). Baltic Forestry. 25(2).
pp.281-288.
1

2
1 out of 10
Related Documents

Your All-in-One AI-Powered Toolkit for Academic Success.
+13062052269
info@desklib.com
Available 24*7 on WhatsApp / Email
Unlock your academic potential
© 2024 | Zucol Services PVT LTD | All rights reserved.