Managing Financial Resources: JB HI-FI Financial Analysis Report
VerifiedAdded on 2023/01/13
|14
|3283
|50
Report
AI Summary
This report presents a financial analysis of JB Hi-Fi, examining its performance over the financial years 2017 and 2018. The analysis utilizes horizontal analysis to assess trends in revenue, profitability, and key financial metrics. The report highlights JB Hi-Fi's revenue growth, increased earnings, and expansion strategies, including store openings and acquisitions like The Good Guys. It also discusses the company's strong performance, driven by customer service and online sales. The analysis also covers key areas for improvement, such as addressing the challenges of a changing retail market. Furthermore, the report incorporates both horizontal and ratio analysis to provide a comprehensive understanding of JB Hi-Fi's financial position, including changes in assets, liabilities, and equity. It also provides insights into the company's cash flow activities. The report concludes with an overview of the company's performance and provides recommendations for future strategic decisions.
Executive summary
Managing Financial Resources
Assessment Task One: Financial Statement Analysis
JB HIFI LTD
[Author name]
Managing Financial Resources
Assessment Task One: Financial Statement Analysis
JB HIFI LTD
[Author name]
Paraphrase This Document
Need a fresh take? Get an instant paraphrase of this document with our AI Paraphraser
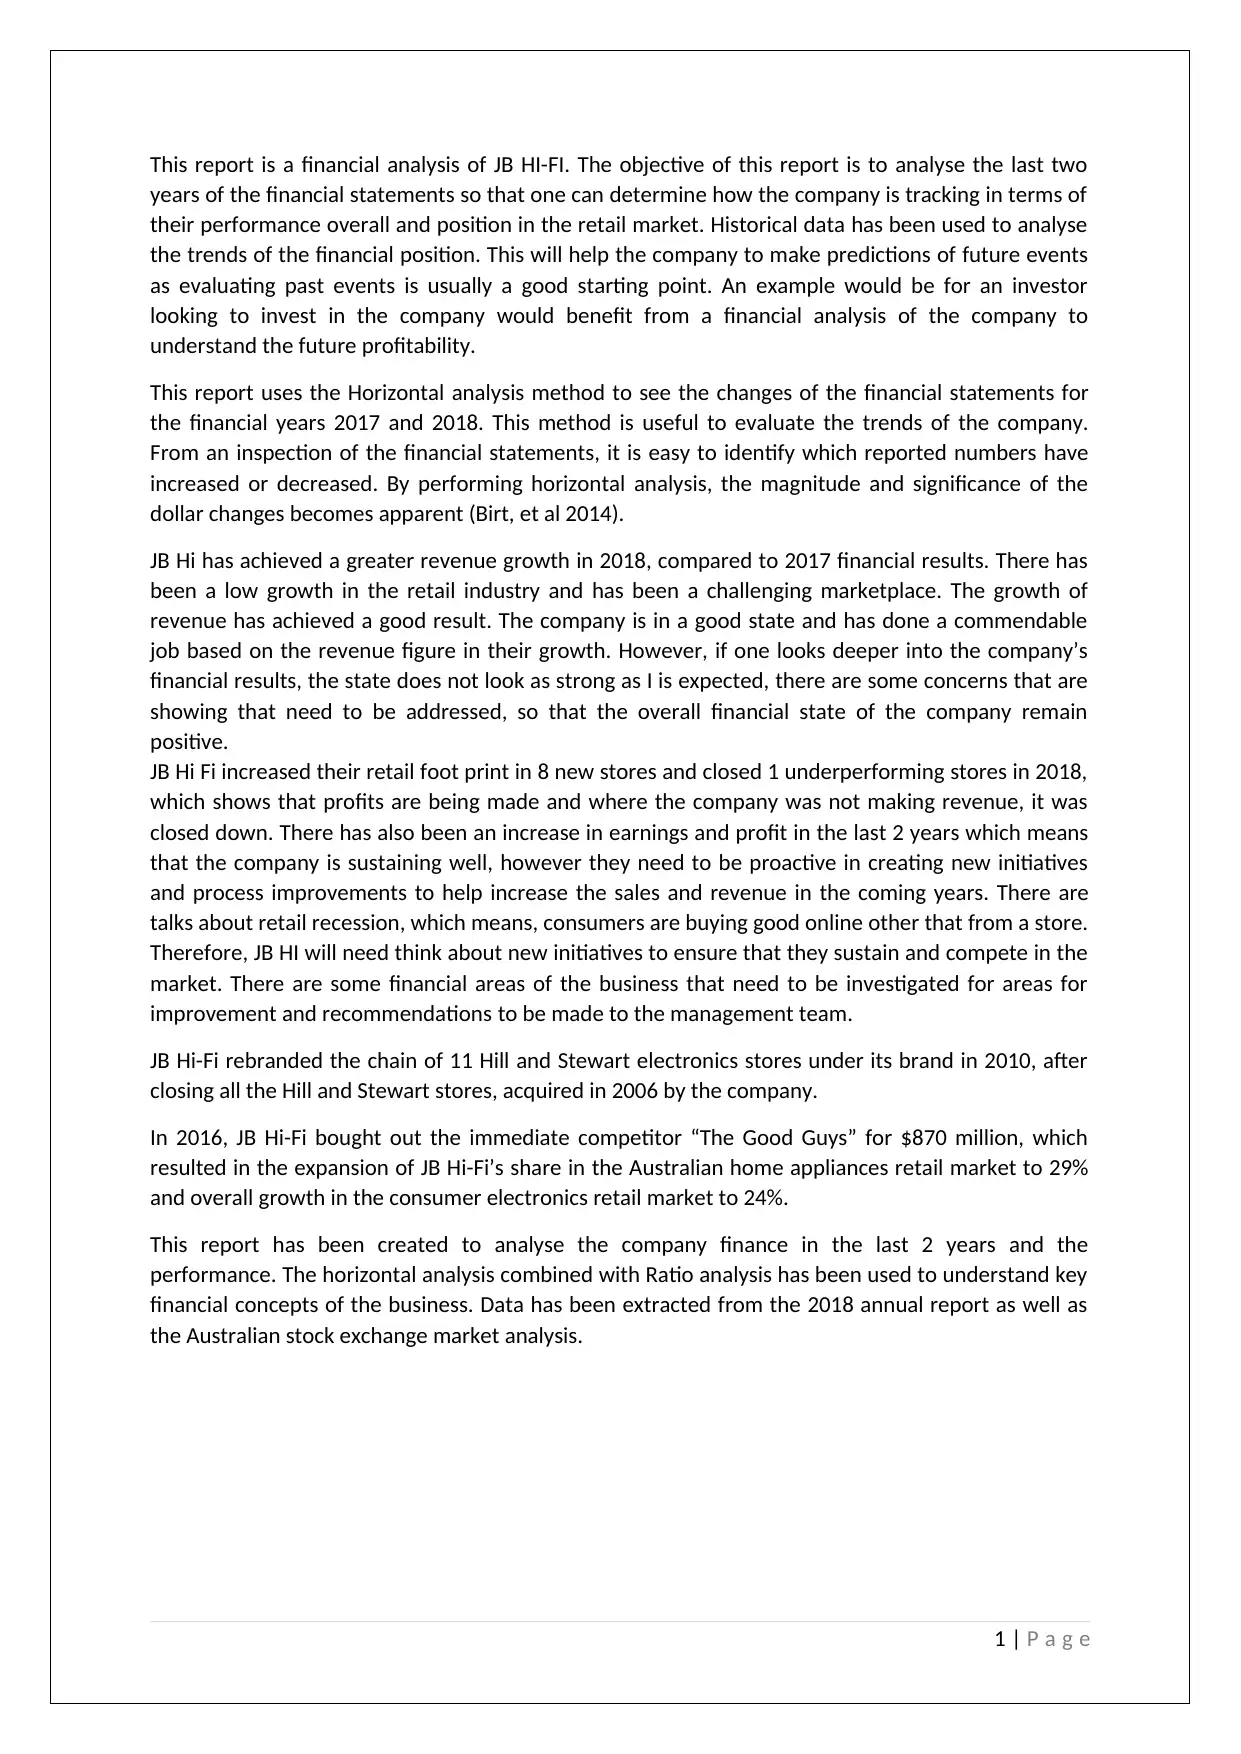
This report is a financial analysis of JB HI-FI. The objective of this report is to analyse the last two
years of the financial statements so that one can determine how the company is tracking in terms of
their performance overall and position in the retail market. Historical data has been used to analyse
the trends of the financial position. This will help the company to make predictions of future events
as evaluating past events is usually a good starting point. An example would be for an investor
looking to invest in the company would benefit from a financial analysis of the company to
understand the future profitability.
This report uses the Horizontal analysis method to see the changes of the financial statements for
the financial years 2017 and 2018. This method is useful to evaluate the trends of the company.
From an inspection of the financial statements, it is easy to identify which reported numbers have
increased or decreased. By performing horizontal analysis, the magnitude and significance of the
dollar changes becomes apparent (Birt, et al 2014).
JB Hi has achieved a greater revenue growth in 2018, compared to 2017 financial results. There has
been a low growth in the retail industry and has been a challenging marketplace. The growth of
revenue has achieved a good result. The company is in a good state and has done a commendable
job based on the revenue figure in their growth. However, if one looks deeper into the company’s
financial results, the state does not look as strong as I is expected, there are some concerns that are
showing that need to be addressed, so that the overall financial state of the company remain
positive.
JB Hi Fi increased their retail foot print in 8 new stores and closed 1 underperforming stores in 2018,
which shows that profits are being made and where the company was not making revenue, it was
closed down. There has also been an increase in earnings and profit in the last 2 years which means
that the company is sustaining well, however they need to be proactive in creating new initiatives
and process improvements to help increase the sales and revenue in the coming years. There are
talks about retail recession, which means, consumers are buying good online other that from a store.
Therefore, JB HI will need think about new initiatives to ensure that they sustain and compete in the
market. There are some financial areas of the business that need to be investigated for areas for
improvement and recommendations to be made to the management team.
JB Hi-Fi rebranded the chain of 11 Hill and Stewart electronics stores under its brand in 2010, after
closing all the Hill and Stewart stores, acquired in 2006 by the company.
In 2016, JB Hi-Fi bought out the immediate competitor “The Good Guys” for $870 million, which
resulted in the expansion of JB Hi-Fi’s share in the Australian home appliances retail market to 29%
and overall growth in the consumer electronics retail market to 24%.
This report has been created to analyse the company finance in the last 2 years and the
performance. The horizontal analysis combined with Ratio analysis has been used to understand key
financial concepts of the business. Data has been extracted from the 2018 annual report as well as
the Australian stock exchange market analysis.
1 | P a g e
Table of Contents
Executive summary...............................................................................................................................1
Introduction..........................................................................................................................................3
Discussion.............................................................................................................................................3
Horizontal Analysis...............................................................................................................................4
Ratio Analysis........................................................................................................................................7
Conclusion.............................................................................................................................................8
References............................................................................................................................................9
Appendix 1..........................................................................................................................................10
Appendix 2..........................................................................................................................................13
2 | P a g e
⊘ This is a preview!⊘
Do you want full access?
Subscribe today to unlock all pages.
Trusted by 1+ million students worldwide
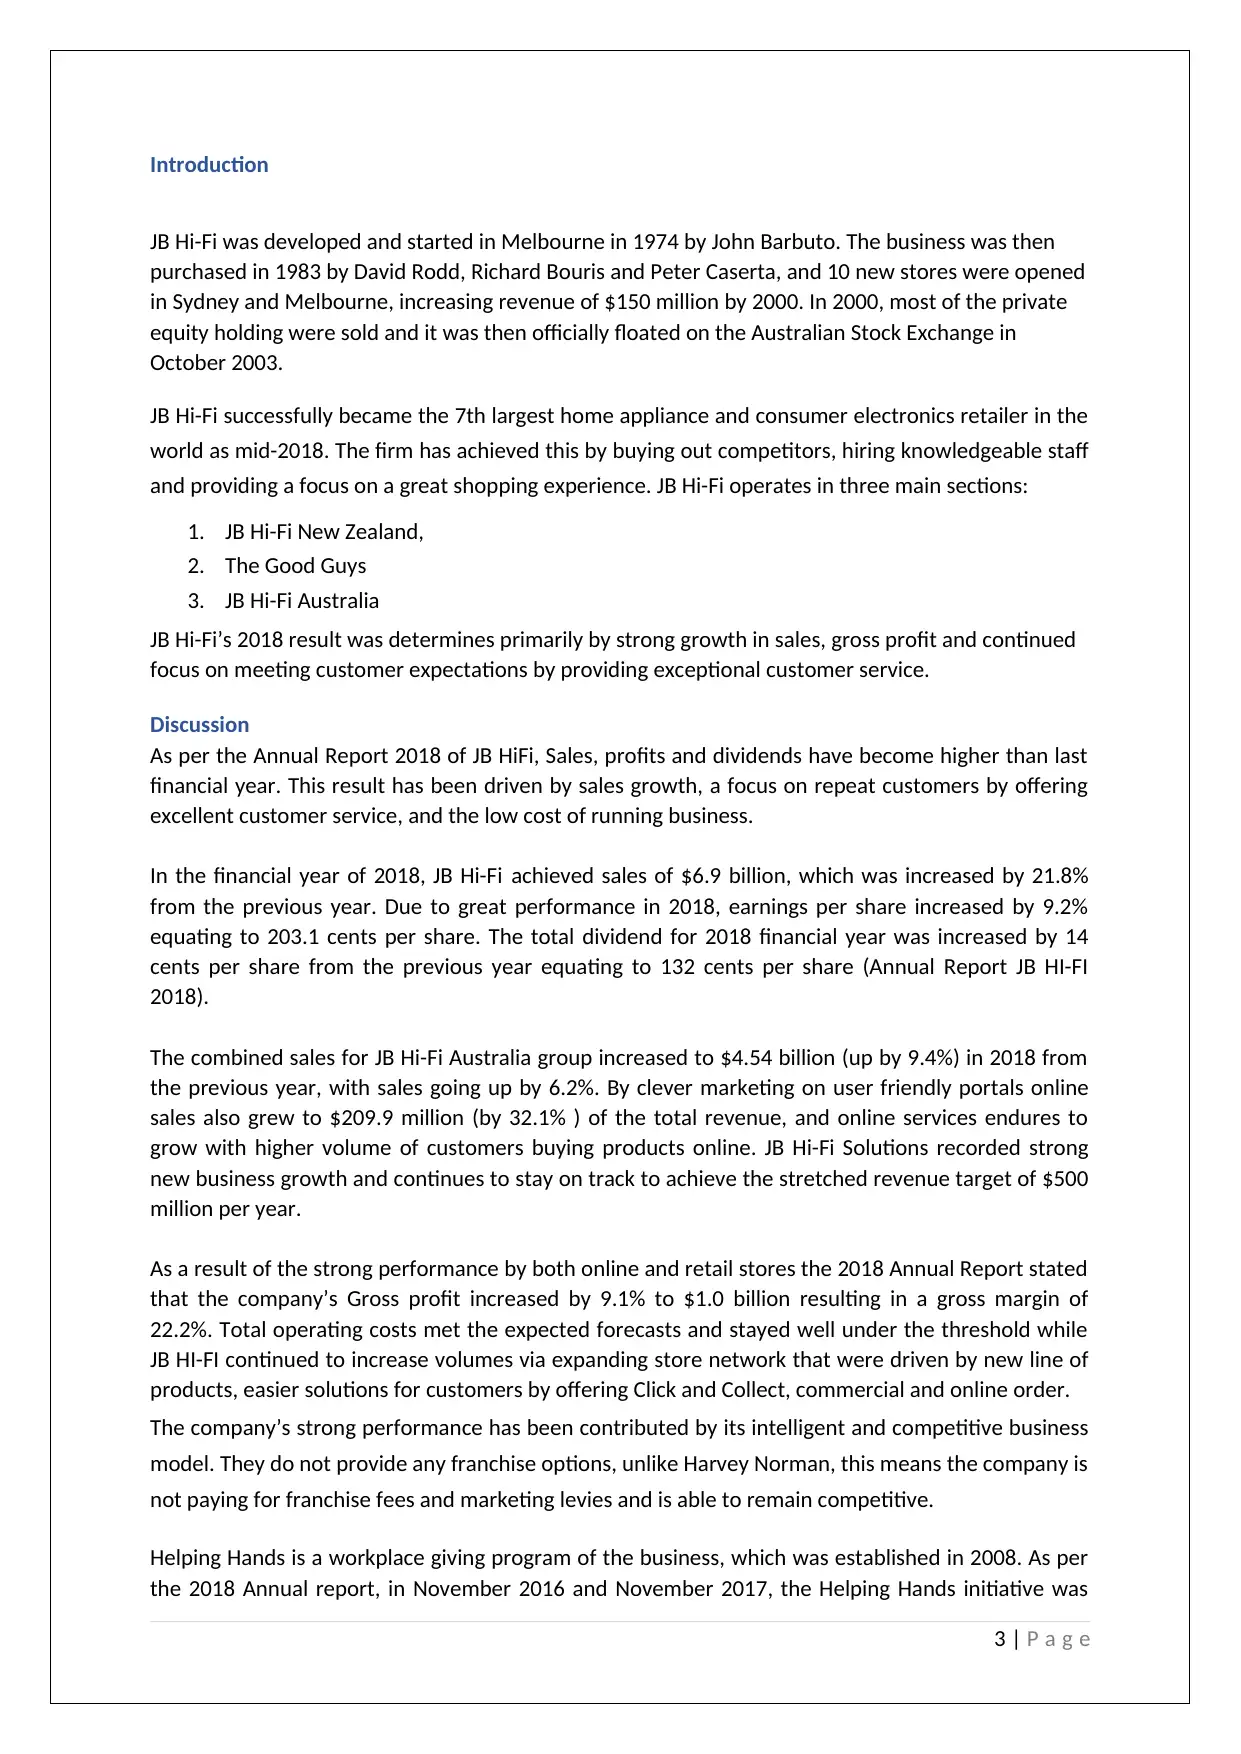
Introduction
JB Hi-Fi was developed and started in Melbourne in 1974 by John Barbuto. The business was then
purchased in 1983 by David Rodd, Richard Bouris and Peter Caserta, and 10 new stores were opened
in Sydney and Melbourne, increasing revenue of $150 million by 2000. In 2000, most of the private
equity holding were sold and it was then officially floated on the Australian Stock Exchange in
October 2003.
JB Hi-Fi successfully became the 7th largest home appliance and consumer electronics retailer in the
world as mid-2018. The firm has achieved this by buying out competitors, hiring knowledgeable staff
and providing a focus on a great shopping experience. JB Hi-Fi operates in three main sections:
1. JB Hi-Fi New Zealand,
2. The Good Guys
3. JB Hi-Fi Australia
JB Hi-Fi’s 2018 result was determines primarily by strong growth in sales, gross profit and continued
focus on meeting customer expectations by providing exceptional customer service.
Discussion
As per the Annual Report 2018 of JB HiFi, Sales, profits and dividends have become higher than last
financial year. This result has been driven by sales growth, a focus on repeat customers by offering
excellent customer service, and the low cost of running business.
In the financial year of 2018, JB Hi-Fi achieved sales of $6.9 billion, which was increased by 21.8%
from the previous year. Due to great performance in 2018, earnings per share increased by 9.2%
equating to 203.1 cents per share. The total dividend for 2018 financial year was increased by 14
cents per share from the previous year equating to 132 cents per share (Annual Report JB HI-FI
2018).
The combined sales for JB Hi-Fi Australia group increased to $4.54 billion (up by 9.4%) in 2018 from
the previous year, with sales going up by 6.2%. By clever marketing on user friendly portals online
sales also grew to $209.9 million (by 32.1% ) of the total revenue, and online services endures to
grow with higher volume of customers buying products online. JB Hi-Fi Solutions recorded strong
new business growth and continues to stay on track to achieve the stretched revenue target of $500
million per year.
As a result of the strong performance by both online and retail stores the 2018 Annual Report stated
that the company’s Gross profit increased by 9.1% to $1.0 billion resulting in a gross margin of
22.2%. Total operating costs met the expected forecasts and stayed well under the threshold while
JB HI-FI continued to increase volumes via expanding store network that were driven by new line of
products, easier solutions for customers by offering Click and Collect, commercial and online order.
The company’s strong performance has been contributed by its intelligent and competitive business
model. They do not provide any franchise options, unlike Harvey Norman, this means the company is
not paying for franchise fees and marketing levies and is able to remain competitive.
Helping Hands is a workplace giving program of the business, which was established in 2008. As per
the 2018 Annual report, in November 2016 and November 2017, the Helping Hands initiative was
3 | P a g e
Paraphrase This Document
Need a fresh take? Get an instant paraphrase of this document with our AI Paraphraser
awarded the best overall initiative and Most Innovative Charity/Employer Partnership at the
Workplace Giving Awards. Above 81% of the Australian employees who work at JB HI-FI contributed
to Helping Hands every week, making the program one of the most successful workplace giving
programs in the country. In 2018 over $2.4 million dollars were raised and from the time that the
program started, the company has raised over $13.7 million dollars for this charity event.
2017 financial report highlighted that JB Hi-Fi incurred a 36.5% lift in profit from financial year 2016
to 2017 to $207.7 million which was far better than expected increase in profits. The result was
slightly above the company’s forecasts as it was boosted by the reduced competition due to a
collapse of Dick Smith and the taking over of The Good Guys announced in September 2016. In 2017
Online sales continued to become a vital part of the business, growing 38.4% to $158.9 million for its
Australia unit.
Horizontal Analysis
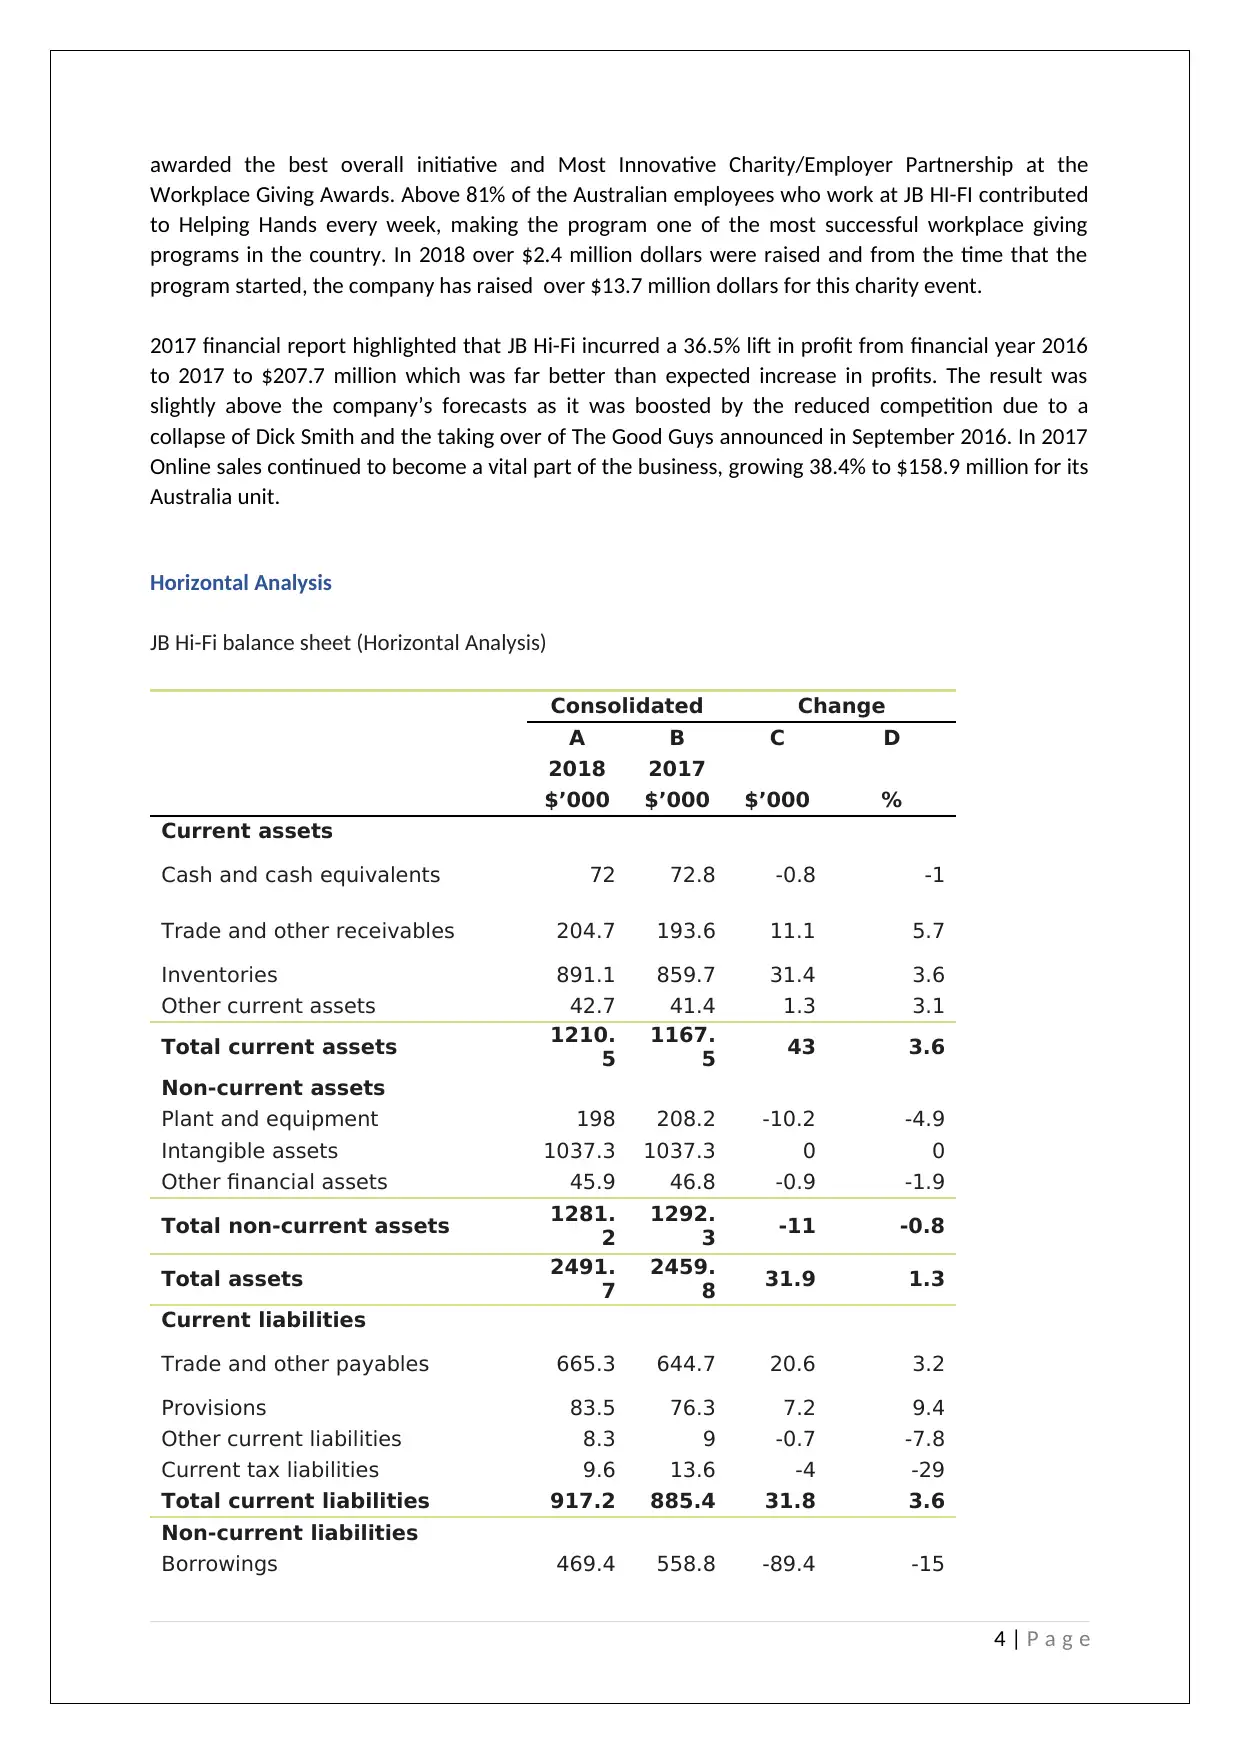
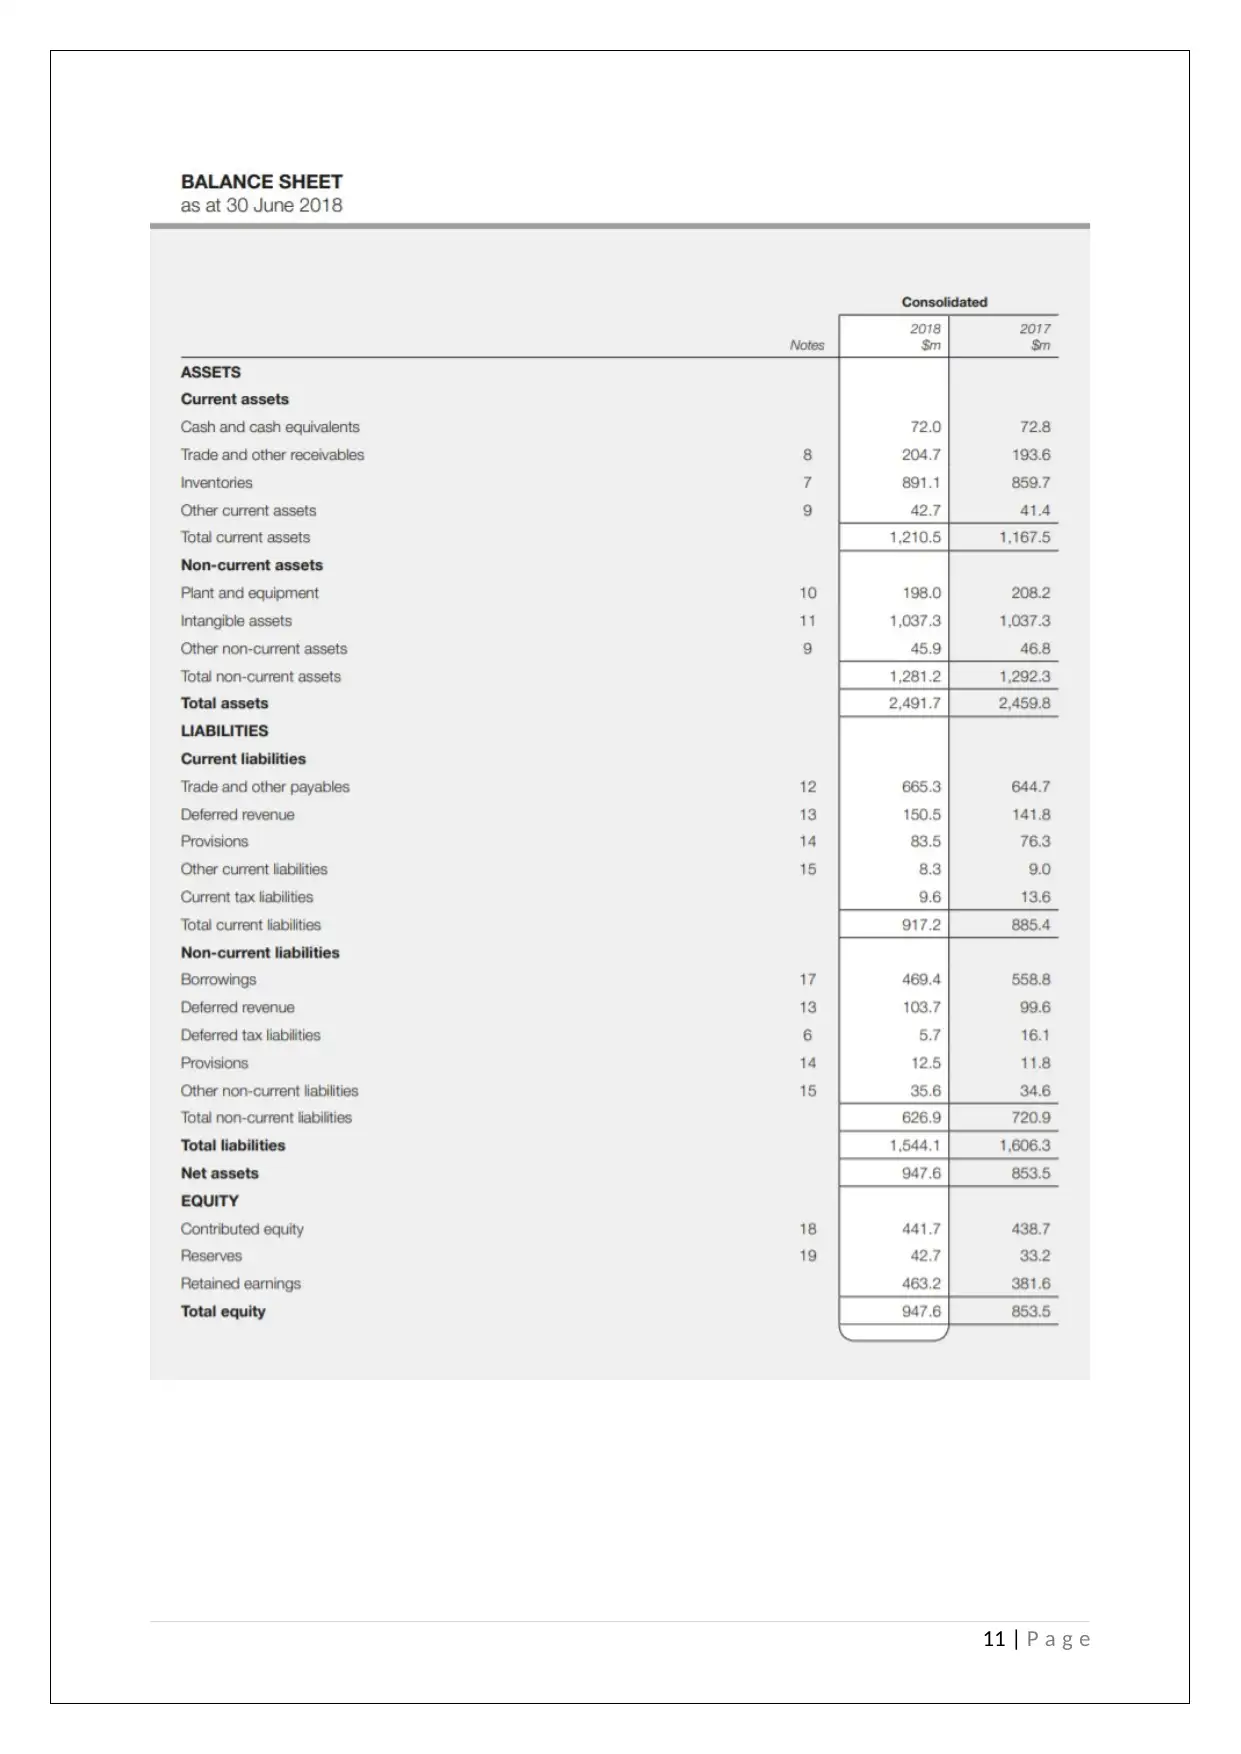
JB Hi-Fi balance sheet (Horizontal Analysis)
Consolidated Change
A B C D
2018 2017
$’000 $’000 $’000 %
Current assets
Cash and cash equivalents 72 72.8 -0.8 -1
Trade and other receivables 204.7 193.6 11.1 5.7
Inventories 891.1 859.7 31.4 3.6
Other current assets 42.7 41.4 1.3 3.1
Total current assets 1210.
5
1167.
5 43 3.6
Non-current assets
Plant and equipment 198 208.2 -10.2 -4.9
Intangible assets 1037.3 1037.3 0 0
Other financial assets 45.9 46.8 -0.9 -1.9
Total non-current assets 1281.
2
1292.
3 -11 -0.8
Total assets 2491.
7
2459.
8 31.9 1.3
Current liabilities
Trade and other payables 665.3 644.7 20.6 3.2
Provisions 83.5 76.3 7.2 9.4
Other current liabilities 8.3 9 -0.7 -7.8
Current tax liabilities 9.6 13.6 -4 -29
Total current liabilities 917.2 885.4 31.8 3.6
Non-current liabilities
Borrowings 469.4 558.8 -89.4 -15
4 | P a g e
Workplace Giving Awards. Above 81% of the Australian employees who work at JB HI-FI contributed
to Helping Hands every week, making the program one of the most successful workplace giving
programs in the country. In 2018 over $2.4 million dollars were raised and from the time that the
program started, the company has raised over $13.7 million dollars for this charity event.
2017 financial report highlighted that JB Hi-Fi incurred a 36.5% lift in profit from financial year 2016
to 2017 to $207.7 million which was far better than expected increase in profits. The result was
slightly above the company’s forecasts as it was boosted by the reduced competition due to a
collapse of Dick Smith and the taking over of The Good Guys announced in September 2016. In 2017
Online sales continued to become a vital part of the business, growing 38.4% to $158.9 million for its
Australia unit.
Horizontal Analysis
JB Hi-Fi balance sheet (Horizontal Analysis)
Consolidated Change
A B C D
2018 2017
$’000 $’000 $’000 %
Current assets
Cash and cash equivalents 72 72.8 -0.8 -1
Trade and other receivables 204.7 193.6 11.1 5.7
Inventories 891.1 859.7 31.4 3.6
Other current assets 42.7 41.4 1.3 3.1
Total current assets 1210.
5
1167.
5 43 3.6
Non-current assets
Plant and equipment 198 208.2 -10.2 -4.9
Intangible assets 1037.3 1037.3 0 0
Other financial assets 45.9 46.8 -0.9 -1.9
Total non-current assets 1281.
2
1292.
3 -11 -0.8
Total assets 2491.
7
2459.
8 31.9 1.3
Current liabilities
Trade and other payables 665.3 644.7 20.6 3.2
Provisions 83.5 76.3 7.2 9.4
Other current liabilities 8.3 9 -0.7 -7.8
Current tax liabilities 9.6 13.6 -4 -29
Total current liabilities 917.2 885.4 31.8 3.6
Non-current liabilities
Borrowings 469.4 558.8 -89.4 -15
4 | P a g e
Provisions 12.5 11.8 0.7 6
Other non-current liabilities 35.6 34.6 12.9 4
Total non-current liabilities 626.9 720.9 -91 -12.6
Total liabilities 1544.
1
1606.
3 -62 -3.9
Net assets 947.6 853.5 94.1 11
Equity
Contributed equity 441.7 438.7 3 0.7
Reserves 42.7 33.2 9.5 28
Retained earnings 463 381 82 21
Total equity 947 853 94 11
As per above figures in the 2017 & 2018 balance sheet of JB HI-FI, using the horizontal analysis one
can see that the total value of assets increased by $31.9 million (1.2%). There has been a decrease in
financial liabilities by $62 million (4%) and an increase in equity by $94 million (11%). As per this
analysis, JB Hi-Fi was holding less cash and cash equivalents as at 30th of June 2018 than at the same
time in 2017 (down by less than 1 million, -1%) and more trade and other receivables, which was up
$11.1 million, 5.7%, while the change in most other asset classes were less than 5%. JB Hi-Fi reduced
its reliance on borrowings in 2018, with borrowings down $89.4 million (15%).
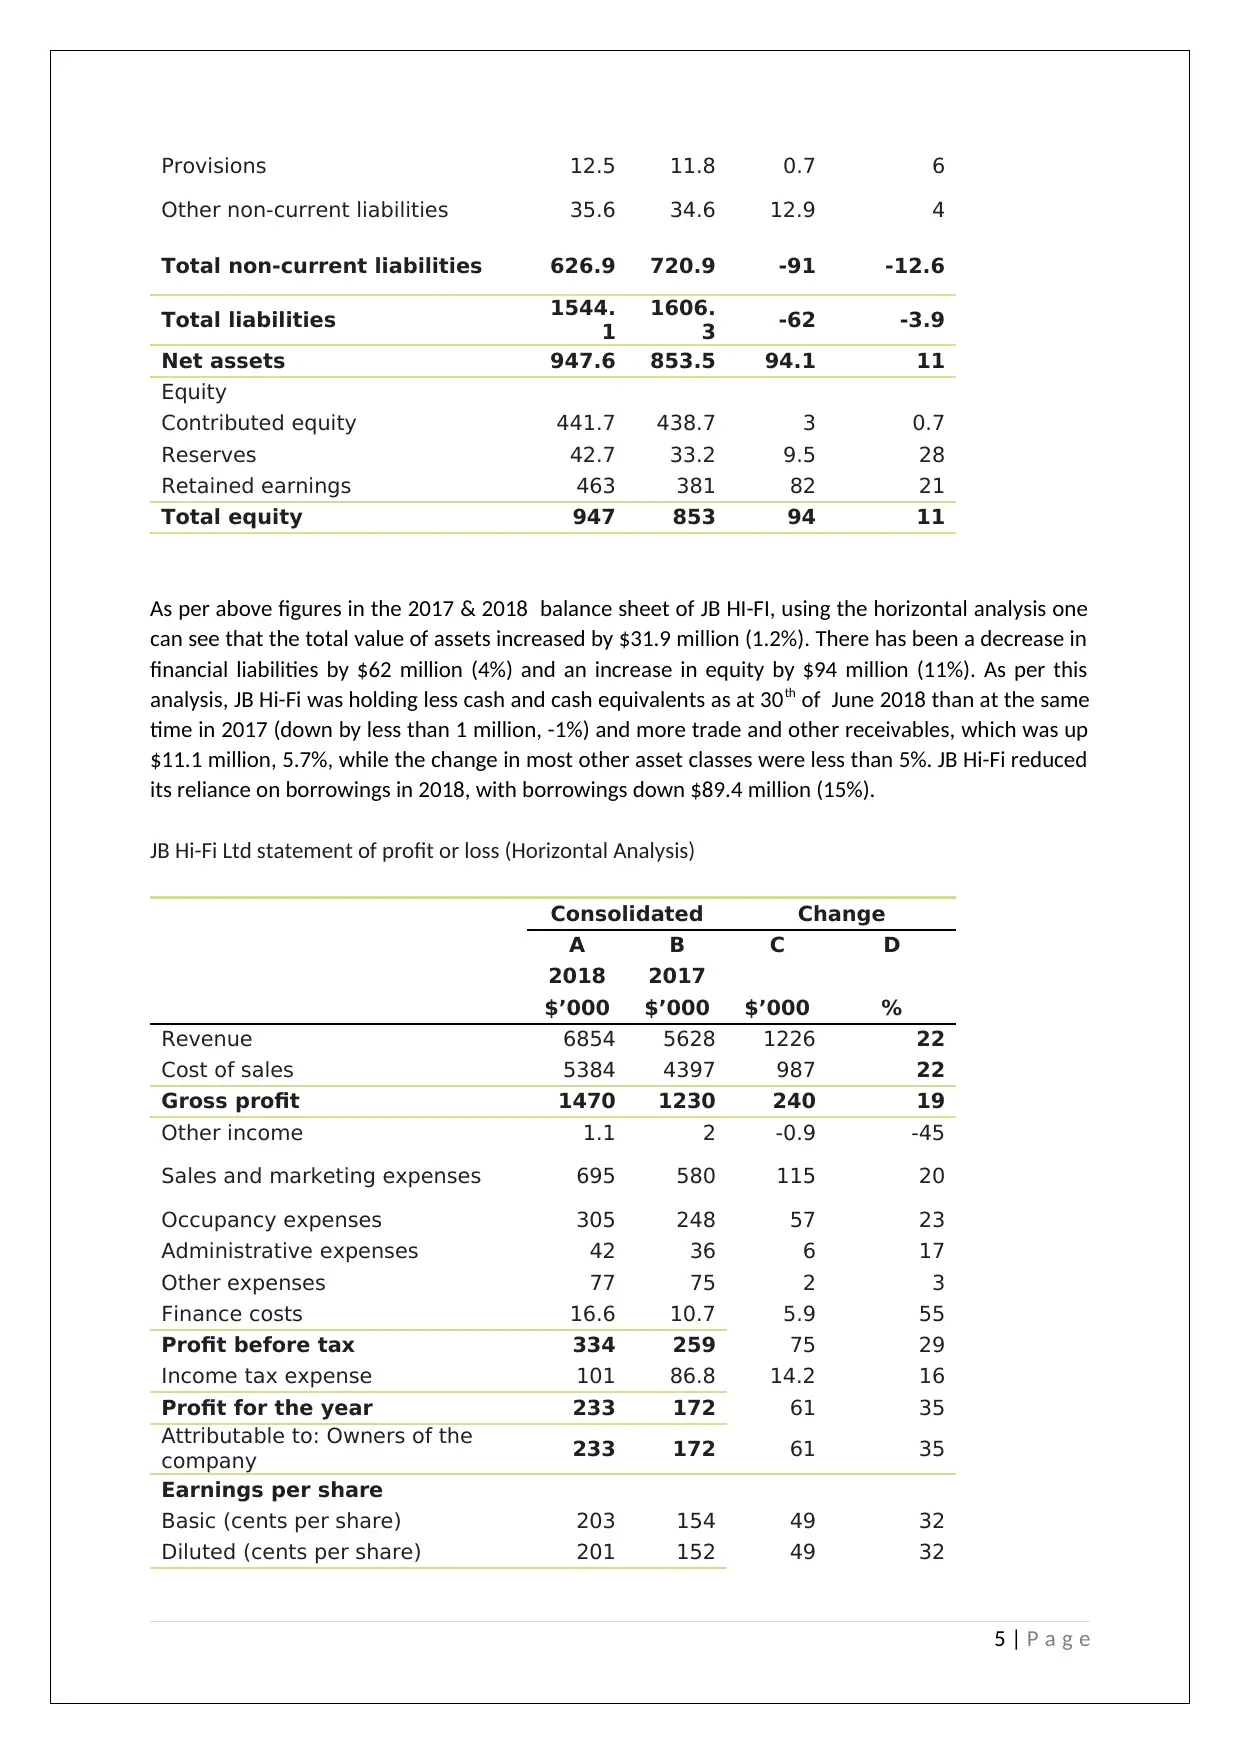
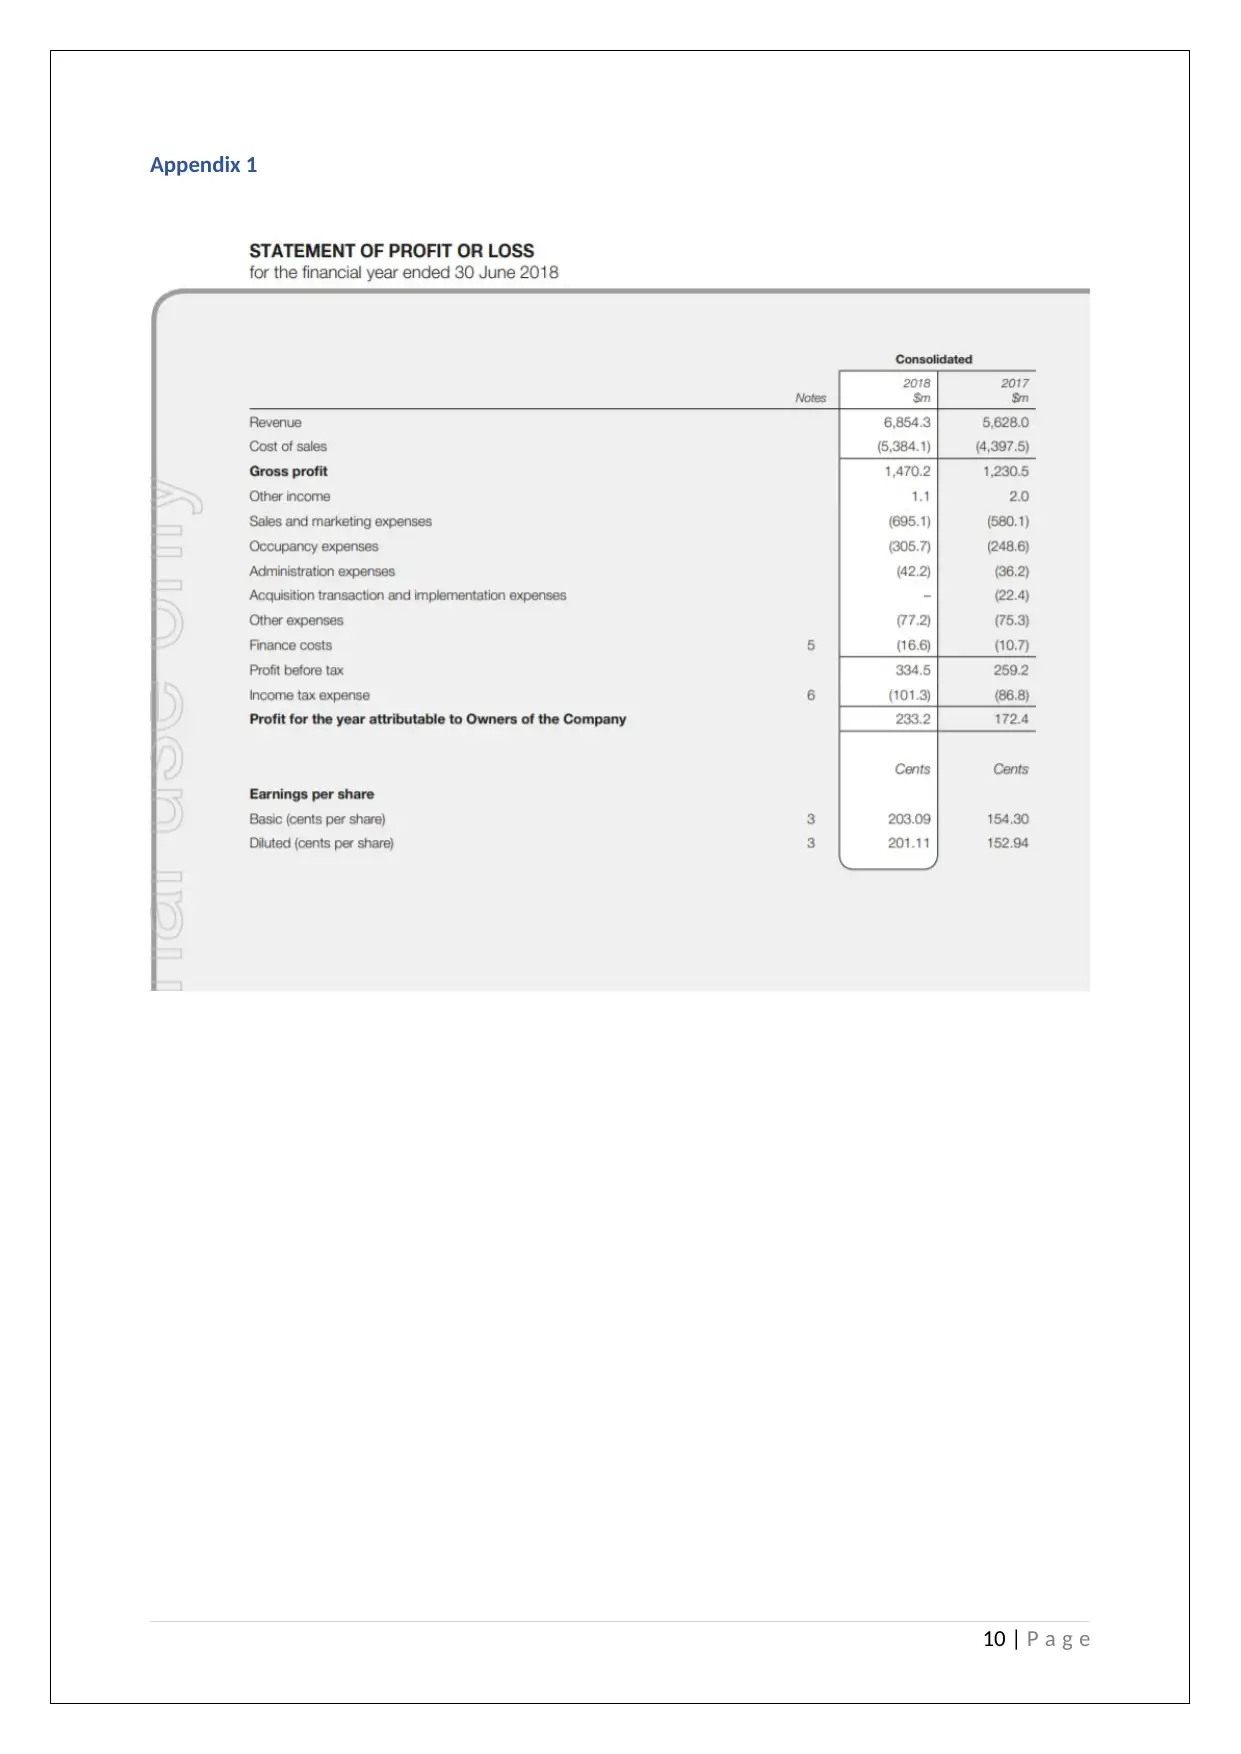
JB Hi-Fi Ltd statement of profit or loss (Horizontal Analysis)
Consolidated Change
A B C D
2018 2017
$’000 $’000 $’000 %
Revenue 6854 5628 1226 22
Cost of sales 5384 4397 987 22
Gross profit 1470 1230 240 19
Other income 1.1 2 -0.9 -45
Sales and marketing expenses 695 580 115 20
Occupancy expenses 305 248 57 23
Administrative expenses 42 36 6 17
Other expenses 77 75 2 3
Finance costs 16.6 10.7 5.9 55
Profit before tax 334 259 75 29
Income tax expense 101 86.8 14.2 16
Profit for the year 233 172 61 35
Attributable to: Owners of the
company 233 172 61 35
Earnings per share
Basic (cents per share) 203 154 49 32
Diluted (cents per share) 201 152 49 32
5 | P a g e
Other non-current liabilities 35.6 34.6 12.9 4
Total non-current liabilities 626.9 720.9 -91 -12.6
Total liabilities 1544.
1
1606.
3 -62 -3.9
Net assets 947.6 853.5 94.1 11
Equity
Contributed equity 441.7 438.7 3 0.7
Reserves 42.7 33.2 9.5 28
Retained earnings 463 381 82 21
Total equity 947 853 94 11
As per above figures in the 2017 & 2018 balance sheet of JB HI-FI, using the horizontal analysis one
can see that the total value of assets increased by $31.9 million (1.2%). There has been a decrease in
financial liabilities by $62 million (4%) and an increase in equity by $94 million (11%). As per this
analysis, JB Hi-Fi was holding less cash and cash equivalents as at 30th of June 2018 than at the same
time in 2017 (down by less than 1 million, -1%) and more trade and other receivables, which was up
$11.1 million, 5.7%, while the change in most other asset classes were less than 5%. JB Hi-Fi reduced
its reliance on borrowings in 2018, with borrowings down $89.4 million (15%).
JB Hi-Fi Ltd statement of profit or loss (Horizontal Analysis)
Consolidated Change
A B C D
2018 2017
$’000 $’000 $’000 %
Revenue 6854 5628 1226 22
Cost of sales 5384 4397 987 22
Gross profit 1470 1230 240 19
Other income 1.1 2 -0.9 -45
Sales and marketing expenses 695 580 115 20
Occupancy expenses 305 248 57 23
Administrative expenses 42 36 6 17
Other expenses 77 75 2 3
Finance costs 16.6 10.7 5.9 55
Profit before tax 334 259 75 29
Income tax expense 101 86.8 14.2 16
Profit for the year 233 172 61 35
Attributable to: Owners of the
company 233 172 61 35
Earnings per share
Basic (cents per share) 203 154 49 32
Diluted (cents per share) 201 152 49 32
5 | P a g e
⊘ This is a preview!⊘
Do you want full access?
Subscribe today to unlock all pages.
Trusted by 1+ million students worldwide
As per above figures in the 2017 & 2018 profit/loss sheet of JB HI-FI, using the horizontal analysis, JB
HI FI’s profit attributable to its owners was up by $61 million (35%). Its gross profit was up $24
million (19%) indicating positive growth in revenue (up $122 million, 22%) in 2018. The increase in
revenue can be associated with the rolling out of JB Hi-Fi Home branded retail stores, newly
launched retail stores, consistent growth of running stores and growth in online retail services. In
line with higher sales volumes, the cost of sales increased by $98.7 million (22%) and sales and
marketing expenses associated with generating higher sales were up $11.5 million, (20%).
Occupancy expenses also increased (up $11.5 million, 20%) and this may be attributable to factors
such as higher store rents and higher utility charges.
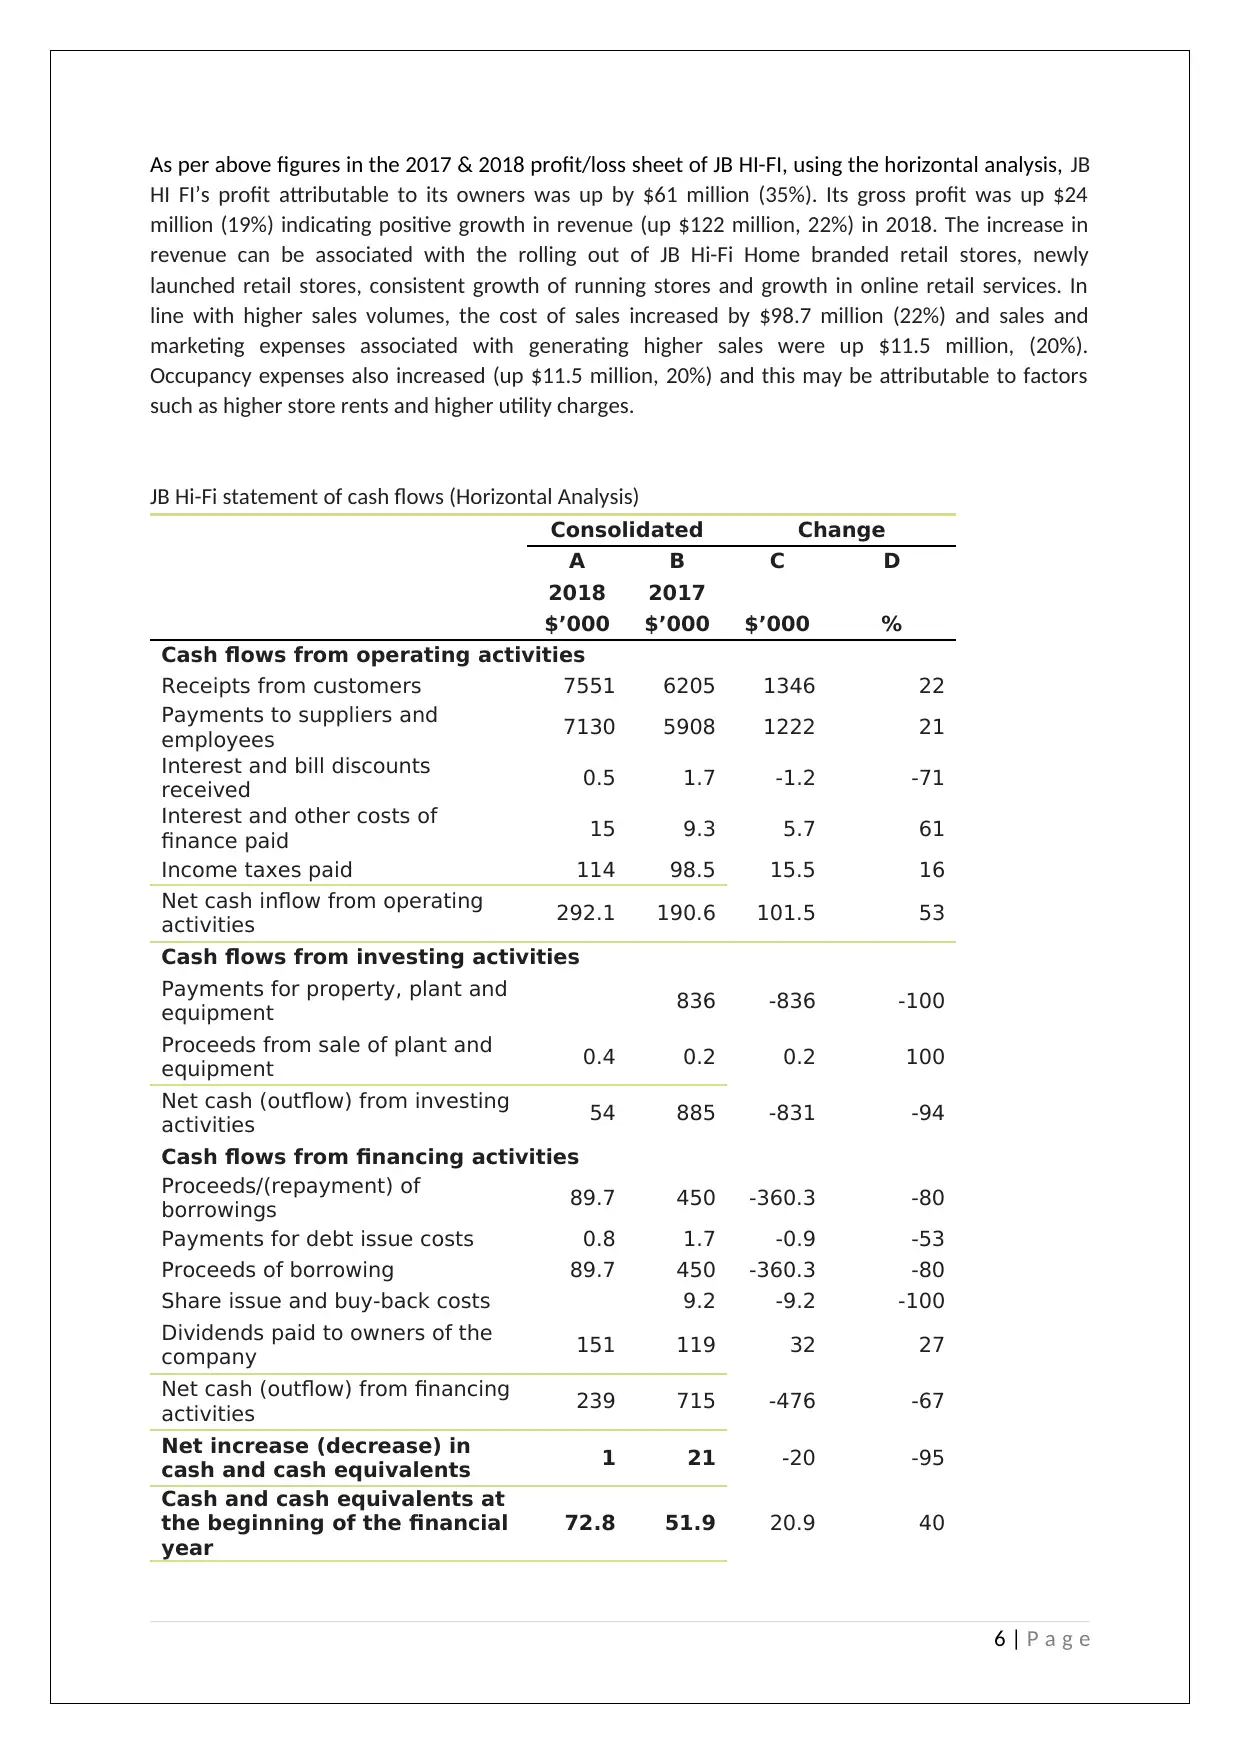
JB Hi-Fi statement of cash flows (Horizontal Analysis)
Consolidated Change
A B C D
2018 2017
$’000 $’000 $’000 %
Cash flows from operating activities
Receipts from customers 7551 6205 1346 22
Payments to suppliers and
employees 7130 5908 1222 21
Interest and bill discounts
received 0.5 1.7 -1.2 -71
Interest and other costs of
finance paid 15 9.3 5.7 61
Income taxes paid 114 98.5 15.5 16
Net cash inflow from operating
activities 292.1 190.6 101.5 53
Cash flows from investing activities
Payments for property, plant and
equipment 836 -836 -100
Proceeds from sale of plant and
equipment 0.4 0.2 0.2 100
Net cash (outflow) from investing
activities 54 885 -831 -94
Cash flows from financing activities
Proceeds/(repayment) of
borrowings 89.7 450 -360.3 -80
Payments for debt issue costs 0.8 1.7 -0.9 -53
Proceeds of borrowing 89.7 450 -360.3 -80
Share issue and buy-back costs 9.2 -9.2 -100
Dividends paid to owners of the
company 151 119 32 27
Net cash (outflow) from financing
activities 239 715 -476 -67
Net increase (decrease) in
cash and cash equivalents 1 21 -20 -95
Cash and cash equivalents at
the beginning of the financial
year
72.8 51.9 20.9 40
6 | P a g e
HI FI’s profit attributable to its owners was up by $61 million (35%). Its gross profit was up $24
million (19%) indicating positive growth in revenue (up $122 million, 22%) in 2018. The increase in
revenue can be associated with the rolling out of JB Hi-Fi Home branded retail stores, newly
launched retail stores, consistent growth of running stores and growth in online retail services. In
line with higher sales volumes, the cost of sales increased by $98.7 million (22%) and sales and
marketing expenses associated with generating higher sales were up $11.5 million, (20%).
Occupancy expenses also increased (up $11.5 million, 20%) and this may be attributable to factors
such as higher store rents and higher utility charges.
JB Hi-Fi statement of cash flows (Horizontal Analysis)
Consolidated Change
A B C D
2018 2017
$’000 $’000 $’000 %
Cash flows from operating activities
Receipts from customers 7551 6205 1346 22
Payments to suppliers and
employees 7130 5908 1222 21
Interest and bill discounts
received 0.5 1.7 -1.2 -71
Interest and other costs of
finance paid 15 9.3 5.7 61
Income taxes paid 114 98.5 15.5 16
Net cash inflow from operating
activities 292.1 190.6 101.5 53
Cash flows from investing activities
Payments for property, plant and
equipment 836 -836 -100
Proceeds from sale of plant and
equipment 0.4 0.2 0.2 100
Net cash (outflow) from investing
activities 54 885 -831 -94
Cash flows from financing activities
Proceeds/(repayment) of
borrowings 89.7 450 -360.3 -80
Payments for debt issue costs 0.8 1.7 -0.9 -53
Proceeds of borrowing 89.7 450 -360.3 -80
Share issue and buy-back costs 9.2 -9.2 -100
Dividends paid to owners of the
company 151 119 32 27
Net cash (outflow) from financing
activities 239 715 -476 -67
Net increase (decrease) in
cash and cash equivalents 1 21 -20 -95
Cash and cash equivalents at
the beginning of the financial
year
72.8 51.9 20.9 40
6 | P a g e
Paraphrase This Document
Need a fresh take? Get an instant paraphrase of this document with our AI Paraphraser
Effect of exchange rate changes
on cash and cash equivalents 0.2 0.1 0.1 100
Cash and cash equivalents at
the end of year 72 72.8 -0.8 -1
As per above figures in the 2017 & 2018 cash flow sheet of JB HI-FI, using the horizontal analysis , the
change in the numbers reported in this statement, reveals that JB Hi-Fi ’s cash at the end of the 2018
year was less than a million lower than the previous year (down by less than 1%). There was also a
positive increase in the net cash inflow from operating activities by $101.5 million (53 per cent).
Ratio Analysis
(See Appendix 2 for formulas)
Profitability
Profit margin ratio
2018 Profit/Sales revenue = 3.4%
2017 Profit/Sales revenue = 3%
We can see from this ration that the Profit ratios for 2018 is slightly higher than both 2017. Even
though there was an increase in revenue, there was also an increase in the Cost of Sales which may
have led to the profit margin being similar.
Efficiency
Days inventory ratio
2018 = 60 days
2017 = 71 days
In 2018, it took JB Hi-Fi an average of 60 days to sell or get rid of its inventories — less than nine
days on average taken in 2017. This shows that the business has become more efficient in selling
inventories quicker than the previous year. JB Hi-Fi Ltd relies on quick turn over of its inventories due
to being a high volume business.
Liquidity
Cash flow ratio
2018 = 0.32 times
2017 = 0.21 times
JB Hi-Fi Ltd had $0.32 of net operating cash flows for every $1 of current liabilities in 2018. The net
operating cash flows increased from $0.21 for every $1 of current liabilities in 2017. This suggests
that the business can meet its current liabilities from the operating activities due to strong figures.
Capital structure
Debt to equity ratio
2018 = 163%
2017 = 188%
7 | P a g e
JB Hi-Fi Ltd is more reliant on the debt funding relative to equity funding in both 2017 and 2018. This
is clearly indicated as both ratios exceed by 100%. If we convert the figures into dollars, this ratio
indicates that JB HI-FI used $1.63 of debt per dollar of equity in 2018 and $1.88 of debt per dollar of
equity in 2017.
Market Performance
Price Earnings Ratio (PER)
Current market price/Earnings per share = 14 times
JB HI-Fi’s current market price is $33.21 and its earnings per share is $2.03 (can be viewed on the
profit/loss statement). According to the price earnings ratio, the market participants are prepared to
acquire shares at JB -HI for 14 years.
Conclusion
The analysis of the financial statements clearly demonstrates that JB HI-FI is able to make adequate
levels of cash flow and the debt floats at a suitable level. By observing the financial statements, JB
HI-FI will be able to pay its future liabilities by its short term assets. The company’s low Cost Of Doing
Business (CODB) gives them a competitive advantage which is achieved through strong focus on
productivity and controlling any non-productive projects which can lead to unnecessary costs. JB Hi-
Fi’s 2018 result was determines primarily by strong growth in sales, gross profit and continued focus
on meeting customer expectations by providing exceptional customer service. JB Hi-Fi introduced
new initiatives to achieve diversity objectives by encouraging workplace gender diversity, flexible
work arrangements and paid maternity leave to increase job satisfaction, low iteration rates and
productive workforce.
8 | P a g e
⊘ This is a preview!⊘
Do you want full access?
Subscribe today to unlock all pages.
Trusted by 1+ million students worldwide
References
Chapter 8 in Birt, J., Chalmers, K., Maloney, S., Oliver, J., 2014. Accounting: Business Reporting for
Decision Making, 5th ed. John Wiley and Sons, Milton, Australia.
McGovern, J., Shelly, S., 2008, The Happy Employee, Avon, Mass : Adams Media, Ebook
ASX, ‘Prices and Research’, ASX, 2019, viewed on 22 Aug, 2019, Available at
https://www.asx.com.au/asx/share-price-research/company/JBH/statistics/shares
Investing.com, ‘JB HI-FI’, Investing.com, 2007-2019, viewed on viewed on 22 Aug 2019, Available at
https://au.investing.com/equities/jb-hi-fi-dividends
ReadyRatios, ‘Financial Analysis and Accounting Book of Reference’, 2011-2019, viewed on 22 Aug
2019, Available at https://www.readyratios.com/reference/
Accounting Verse, ‘Financial Ratio Analysis’, Apr 7, 2018, viewed on 22 Aug 2019, Available at
https://www.accountingverse.com/managerial-accounting/fs-analysis/financial-ratios.html
JBHIFI Annual Report 2018, ‘Annual Report’, 2018, viewed on 22 Aug 2019, Available at
https://investors.jbhifi.com.au/wp-content/uploads/2018/10/Annual-Report-2018-with-Chairmans-
CEOs-Report.pdf
Wall Street Journal, ‘JB HI-FI LTD.’ Financials, 2019, viewed on 22 Aug 2019, Available at
https://quotes.wsj.com/AU/XASX/JBH/financials
CFI, ‘Guide to financial statement analysis’, Analysis of Financial Statements, 2015-2019, viewed on
22 Aug 2019, Available at https://corporatefinanceinstitute.com/resources/knowledge/finance/
analysis-of-financial-statements/
ABC, ‘JB Hi-Fi profit jumps 35 per cent amid tougher retail market’, ABC News, 13th August 2018,
viewed on 22 Aug 2019, Available at https://www.abc.net.au/news/2018-08-13/jb-hi-fi-profit-
jumps/10113374
News.com.au, ‘Other retailers are suffering, so how is JB Hi-Fi still making a motza?’, Finance, 14th
August 2018, viewed on 22 Aug 2019, Available at
https://www.news.com.au/finance/business/retail/other-retailers-are-suffering-so-how-is-jb-hifi-
still-making-a-motza/news-story/4fdd5960c81b62fd9eb872bd68d9cb6f
9 | P a g e
Paraphrase This Document
Need a fresh take? Get an instant paraphrase of this document with our AI Paraphraser
Appendix 1
10 | P a g e
10 | P a g e
11 | P a g e
⊘ This is a preview!⊘
Do you want full access?
Subscribe today to unlock all pages.
Trusted by 1+ million students worldwide
1 out of 14
Related Documents


Your All-in-One AI-Powered Toolkit for Academic Success.
+13062052269
info@desklib.com
Available 24*7 on WhatsApp / Email
![[object Object]](/_next/static/media/star-bottom.7253800d.svg)
Unlock your academic potential
Copyright © 2020–2026 A2Z Services. All Rights Reserved. Developed and managed by ZUCOL.