Report on Managing International Business: Literature Review
VerifiedAdded on 2023/01/23
|69
|20400
|72
Report
AI Summary
This report provides a comprehensive analysis of managing international business, with a particular focus on service quality, customer satisfaction, perceived value, and customer loyalty within the insurance industry. The report begins with a literature review, exploring key concepts and models such as SERVQUAL, and the five dimensions of service quality. It then outlines the research methodology, including epistemology, sampling, research methods, and data analysis techniques like reliability and validity tests, and regression analysis. The findings section presents the results of the analysis, including descriptive statistics, assumption tests, and regression analysis results for service quality, perceived value, customer satisfaction, and customer loyalty. The discussion section interprets these results, and the report concludes with a summary of findings, recommendations, and suggestions for further research, along with the limitations of the study. The appendix includes the questionnaire used for data collection.
Running head: MANAGING INTERNATIONAL BUSINESS
Managing International Business
Managing International Business
Paraphrase This Document
Need a fresh take? Get an instant paraphrase of this document with our AI Paraphraser
MANAGING INTERNATIONAL BUSINESS 2
Table of Contents
Chapter 2 Literature review...................................................................................................................4
2.0 Introduction.................................................................................................................................4
2.1 Service Quality............................................................................................................................4
2.2 Perceived Value.........................................................................................................................13
2.3 Customer Satisfaction................................................................................................................19
2.4 Customer Loyalty......................................................................................................................21
Chapter 3 Research Methodology........................................................................................................24
3.1 Introduction of research methodology.......................................................................................24
3.2 Epistemology for methodology..................................................................................................25
3.3 Selected research methodology..................................................................................................28
3.4 Sampling approach....................................................................................................................28
3.5 Research methods......................................................................................................................29
3.6 Format of questionnaire (refer to appendixes)...........................................................................30
3.7 Data analysis..............................................................................................................................31
3.7.1 Data clean...............................................................................................................................31
3.7.2 Reliability test.........................................................................................................................31
3.7.3 Validity test............................................................................................................................32
3.7.4. Perform 4 assumptions of regression analysis........................................................................32
3.8 Research Ethics..........................................................................................................................33
3.9 Research limitations...................................................................................................................34
3.10 Chapter Summary....................................................................................................................35
Chapter 4 Analysis: Findings and Discussions....................................................................................35
4.1 Report of the Results.....................................................................................................................35
4.2 Validity and Reliability Test......................................................................................................35
SERVICE QUALITY..................................................................................................................35
PERCEIVED VALUE.................................................................................................................35
CUSTOMER SATISFACTION..................................................................................................36
CUSTOMER LOYALTY............................................................................................................36
4.3 Descriptive Statistics............................................................................................................36
SERVICE QUALITY..................................................................................................................36
PERCEIVED VALUE.................................................................................................................37
CUSTOMER SATISFACTION..................................................................................................38
CUSTOMER LOYALTY............................................................................................................38
MANAGING INTERNATIONAL BUSINESS 3
4.4 Assumption Tests.................................................................................................................39
SERVICE QUALITY..................................................................................................................39
PERCEIVED VALUE.................................................................................................................39
CUSTOMER SATISFACTION..................................................................................................40
CUSTOMER LOYALTY............................................................................................................41
4.5 Regression Analysis.............................................................................................................41
SERVICE QUALITY......................................................................................................................41
PERCEIVED VALUE.................................................................................................................43
CUSTOMER SATISFACTION..................................................................................................44
CUSTOMER LOYALTY............................................................................................................45
4.6 Discussion of the Results...........................................................................................................47
Service quality.................................................................................................................................47
Perceived value................................................................................................................................47
Customer satisfaction......................................................................................................................48
Customer loyalty.............................................................................................................................48
Chapter 5 Conclusions and Recommendations....................................................................................49
5.1 Comprehensive Summary..........................................................................................................49
5.2 Recommendations.....................................................................................................................50
5.3 Research Limitations and Suggestions for Further Research.....................................................52
References...........................................................................................................................................53
Appendix.............................................................................................................................................66
QUESTIONNAIRE.........................................................................................................................66
SECTION A – DEMOGRAPHIC OF RESPONDENT...............................................................66
SECTION B – QUESTION FOR DATA COLLECTION...........................................................66
Table 1: Reliability Statistics...............................................................................................................36
Table 2: Reliability Statistics...............................................................................................................36
Table 3: Reliability Statistics...............................................................................................................37
Table 4: Reliability Statistics...............................................................................................................37
Table 5: Descriptive Statistics of service quality.................................................................................37
Table 6: Descriptive Statistics of perceived value...............................................................................38
Table 7: Descriptive Statistics of customer satisfaction.......................................................................39
Table 8: Descriptive Statistics of customer loyalty..............................................................................39
Table 9: Correlations between service qualities...................................................................................40
Table 10: Correlations between perceived value.................................................................................40
Table 11: Correlations between customer satisfactions.......................................................................41
⊘ This is a preview!⊘
Do you want full access?
Subscribe today to unlock all pages.
Trusted by 1+ million students worldwide
MANAGING INTERNATIONAL BUSINESS 4
Table 12: Correlations between customer loyalties.............................................................................42
Table 13: Regression Analysis of service quality................................................................................42
Table 14: Regression Analysis of perceived value..............................................................................44
Table 15: Regression Analysis of customer satisfaction......................................................................45
Table 16: Regression Analysis of customer loyalty.............................................................................46
Paraphrase This Document
Need a fresh take? Get an instant paraphrase of this document with our AI Paraphraser
MANAGING INTERNATIONAL BUSINESS 5
Chapter 2 Literature review
2.0 Introduction
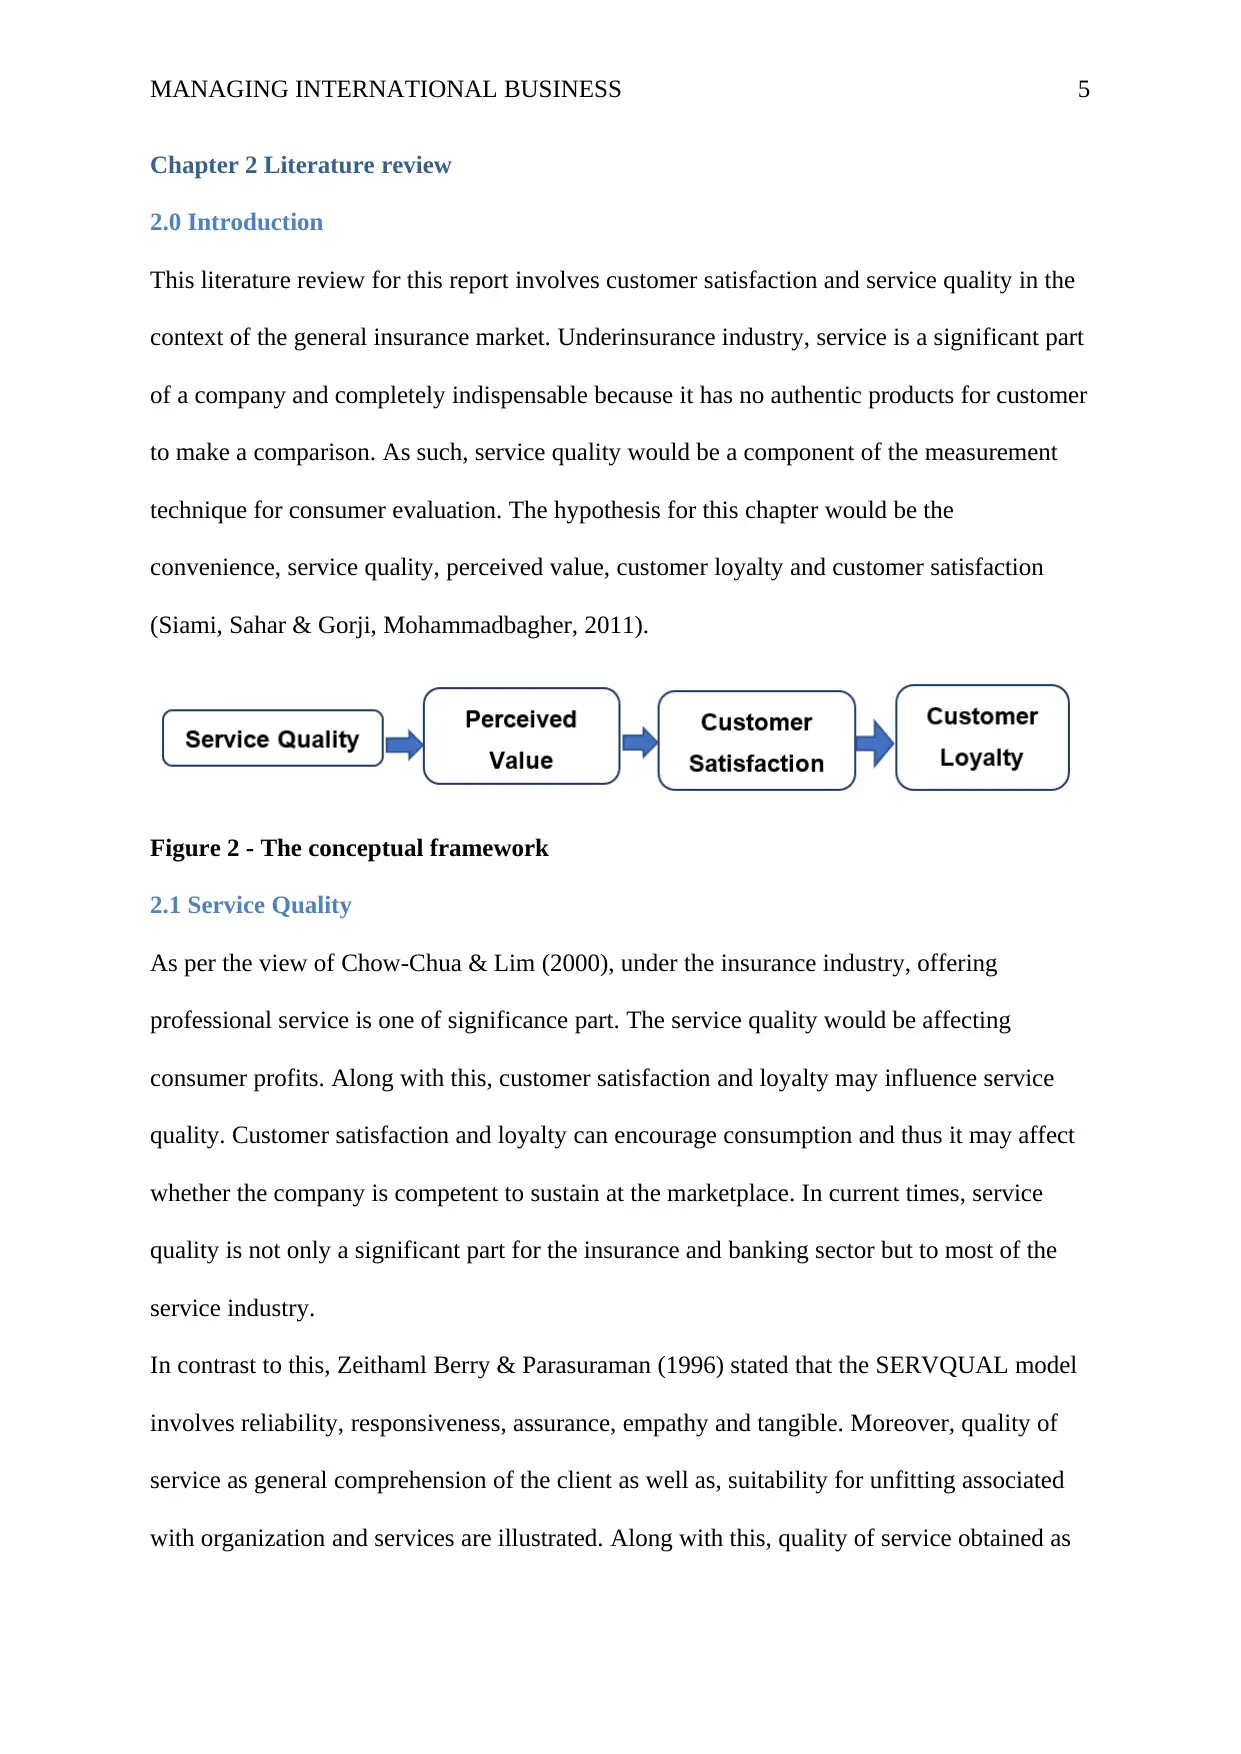
This literature review for this report involves customer satisfaction and service quality in the
context of the general insurance market. Underinsurance industry, service is a significant part
of a company and completely indispensable because it has no authentic products for customer
to make a comparison. As such, service quality would be a component of the measurement
technique for consumer evaluation. The hypothesis for this chapter would be the
convenience, service quality, perceived value, customer loyalty and customer satisfaction
(Siami, Sahar & Gorji, Mohammadbagher, 2011).
Figure 2 - The conceptual framework
2.1 Service Quality
As per the view of Chow-Chua & Lim (2000), under the insurance industry, offering
professional service is one of significance part. The service quality would be affecting
consumer profits. Along with this, customer satisfaction and loyalty may influence service
quality. Customer satisfaction and loyalty can encourage consumption and thus it may affect
whether the company is competent to sustain at the marketplace. In current times, service
quality is not only a significant part for the insurance and banking sector but to most of the
service industry.
In contrast to this, Zeithaml Berry & Parasuraman (1996) stated that the SERVQUAL model
involves reliability, responsiveness, assurance, empathy and tangible. Moreover, quality of
service as general comprehension of the client as well as, suitability for unfitting associated
with organization and services are illustrated. Along with this, quality of service obtained as
Chapter 2 Literature review
2.0 Introduction
This literature review for this report involves customer satisfaction and service quality in the
context of the general insurance market. Underinsurance industry, service is a significant part
of a company and completely indispensable because it has no authentic products for customer
to make a comparison. As such, service quality would be a component of the measurement
technique for consumer evaluation. The hypothesis for this chapter would be the
convenience, service quality, perceived value, customer loyalty and customer satisfaction
(Siami, Sahar & Gorji, Mohammadbagher, 2011).
Figure 2 - The conceptual framework
2.1 Service Quality
As per the view of Chow-Chua & Lim (2000), under the insurance industry, offering
professional service is one of significance part. The service quality would be affecting
consumer profits. Along with this, customer satisfaction and loyalty may influence service
quality. Customer satisfaction and loyalty can encourage consumption and thus it may affect
whether the company is competent to sustain at the marketplace. In current times, service
quality is not only a significant part for the insurance and banking sector but to most of the
service industry.
In contrast to this, Zeithaml Berry & Parasuraman (1996) stated that the SERVQUAL model
involves reliability, responsiveness, assurance, empathy and tangible. Moreover, quality of
service as general comprehension of the client as well as, suitability for unfitting associated
with organization and services are illustrated. Along with this, quality of service obtained as
MANAGING INTERNATIONAL BUSINESS 6
international justice and higher extent of attitude is depending on service offered are
illustrated and have observed that judge on quality service illustrates the difference among
route customer expectations and views. Cronin Jr & Taylor (1992) opined that quality is
generally illustrated as those product features and fitness for use that attain the requirement of
customers as well as, thereby offers the higher extent of customer satisfaction in Singapore
insurance industry. The tendency with respect to demonstrating services as well as, quality
has a significant component in the service industry like the insurance industry. Since, service
quality is significant to sustain and profit making of the company, then it may influence
customer satisfaction as well as, motivation after shopping favorably.
In opposed to this, Tsoukatos & Rand (2006) evaluated that customer satisfaction has
affected the tendency with respect to shopping favorably. Service quality and customer
satisfaction are considered as vital affairs in a high service industry nowadays. In addition,
quality of service as general comprehension of client and suitability of inappropriateness
relative to their company and services are illustrated.
Hsu & Petchsakulwong (2010) discussed that the quality of services are received as superior
attitudes and the international judge is relied on service offered. It is observed that the judge
on quality services exhibits the difference among order and route customer expectations and
views. But, while it is related to particular service attributes and dimension as a wide
category of model and structure presented and there is different research on service quality
measurement in different industry aspects. In specific, traditional aspects and measures of
customer satisfaction and service quality has been questioned in business to business
atmospheres.
On the other side, Eckardt (2007) stated that service quality can have a different meaning in a
diverse context. There are different scholars who have illustrated the service quality as per
several theoretical assumptions. For illustration, quality is illustrated as an overall impression
⊘ This is a preview!⊘
Do you want full access?
Subscribe today to unlock all pages.
Trusted by 1+ million students worldwide
MANAGING INTERNATIONAL BUSINESS 7
of customers related to the superiority and inferiority of the company and its services. It is
assessed that perceived service quality is examined as the global judgment and attitude
associated to the superiority of service and observed that the judgment on service quality is a
demonstration of degree as well as, the direction of discrepancy among perceptions and
expectations of customers.
As per the view of Joseph Stone & Anderson (2003), there is five dimensions of service
quality scales such as reliability, empathy, response capabilities, feelings and ensures. It is
widely spread within a various organization has been practiced. Along with this, the
SERVQUAL model depicts the customer scale regarding sufficient quality and value
measure. This literature is highly rich with respect to model, definition, dimension and
measurement concerns in service quality that is supported by the several empirical studies
through different service-related application sectors. In opposed to this, Crosby & Stephens
(1987) examined that some of the contemporary definition regarding service quality from the
literature were provided in this research. The SERVQUAL scale is intended to assess the
service quality observed by participants from different service categories such as long-
distance telephone, insurance, security brokerage, maintenance firm, credit cards, and
appliance repair.
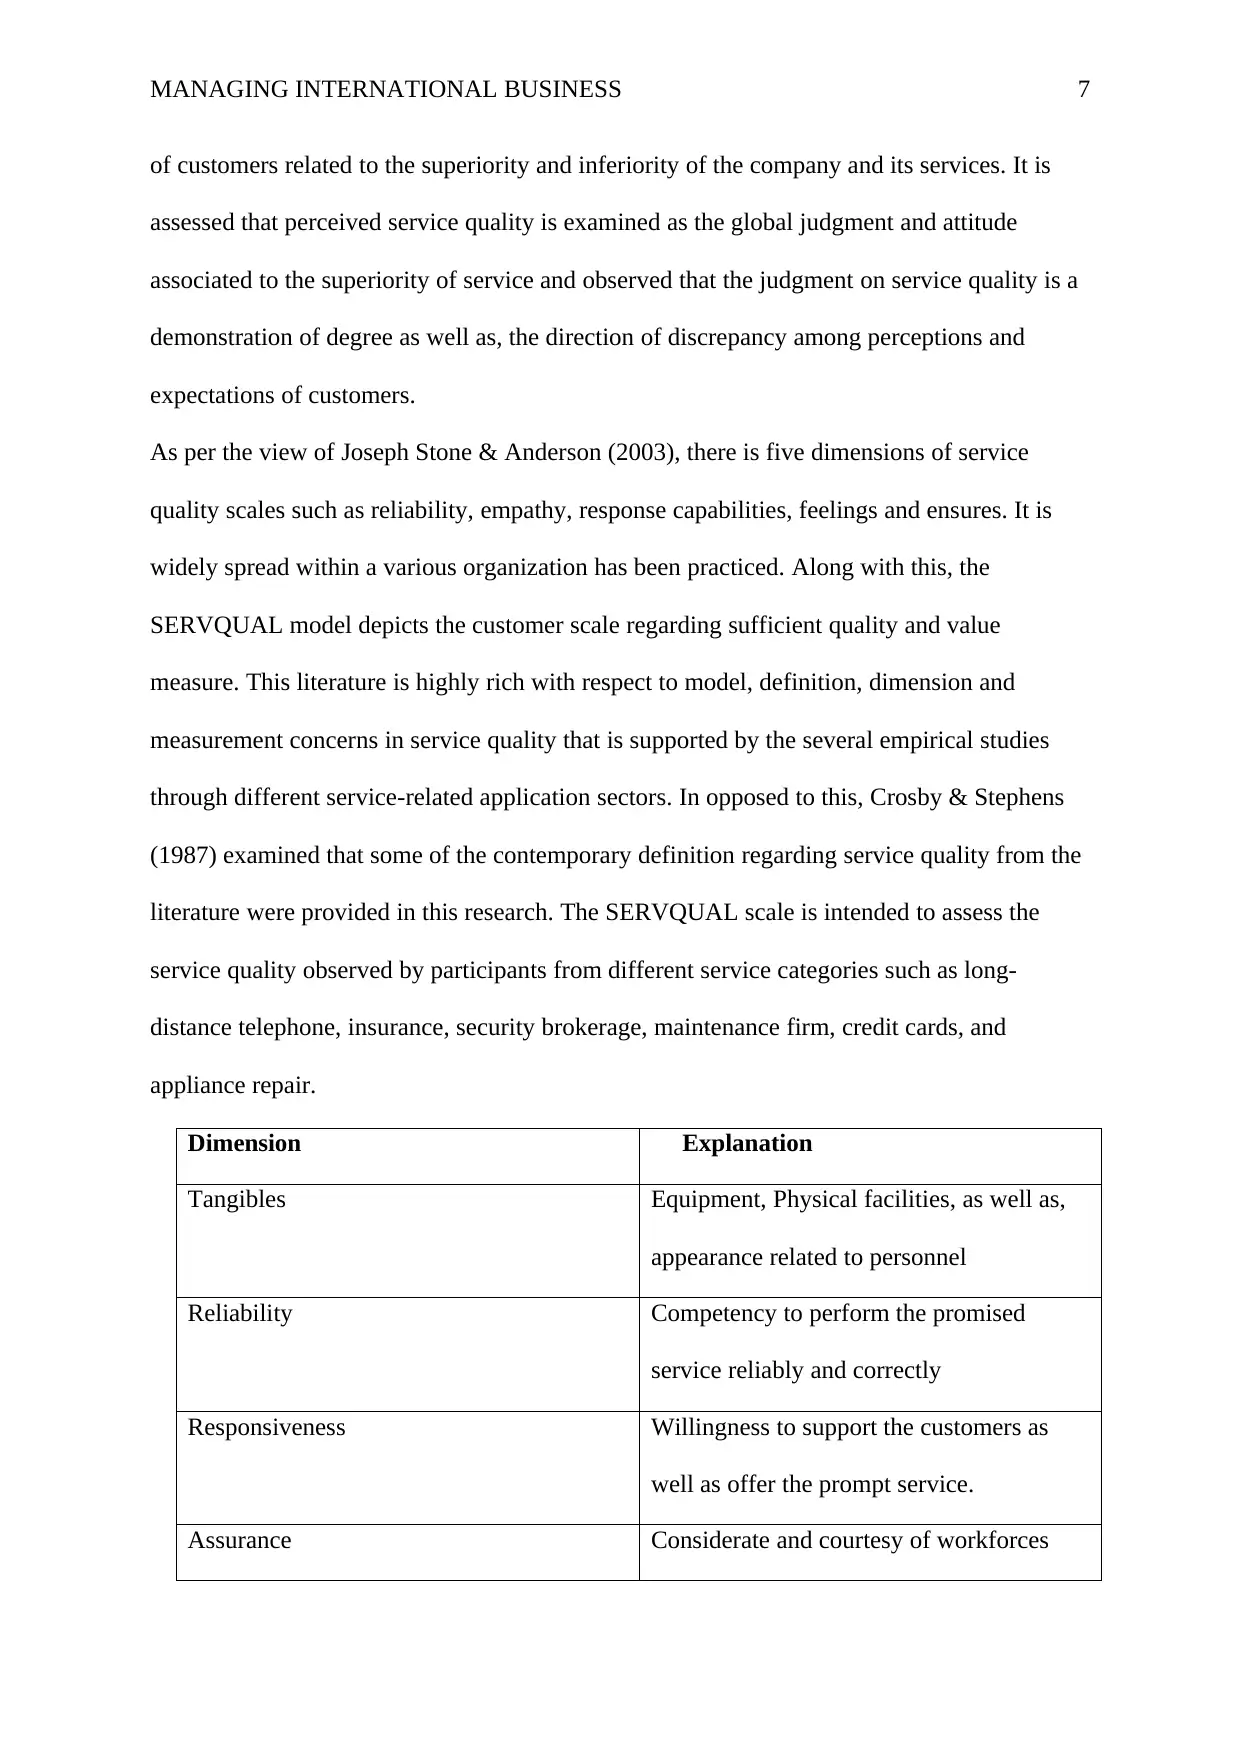
Dimension Explanation
Tangibles Equipment, Physical facilities, as well as,
appearance related to personnel
Reliability Competency to perform the promised
service reliably and correctly
Responsiveness Willingness to support the customers as
well as offer the prompt service.
Assurance Considerate and courtesy of workforces
of customers related to the superiority and inferiority of the company and its services. It is
assessed that perceived service quality is examined as the global judgment and attitude
associated to the superiority of service and observed that the judgment on service quality is a
demonstration of degree as well as, the direction of discrepancy among perceptions and
expectations of customers.
As per the view of Joseph Stone & Anderson (2003), there is five dimensions of service
quality scales such as reliability, empathy, response capabilities, feelings and ensures. It is
widely spread within a various organization has been practiced. Along with this, the
SERVQUAL model depicts the customer scale regarding sufficient quality and value
measure. This literature is highly rich with respect to model, definition, dimension and
measurement concerns in service quality that is supported by the several empirical studies
through different service-related application sectors. In opposed to this, Crosby & Stephens
(1987) examined that some of the contemporary definition regarding service quality from the
literature were provided in this research. The SERVQUAL scale is intended to assess the
service quality observed by participants from different service categories such as long-
distance telephone, insurance, security brokerage, maintenance firm, credit cards, and
appliance repair.
Dimension Explanation
Tangibles Equipment, Physical facilities, as well as,
appearance related to personnel
Reliability Competency to perform the promised
service reliably and correctly
Responsiveness Willingness to support the customers as
well as offer the prompt service.
Assurance Considerate and courtesy of workforces
Paraphrase This Document
Need a fresh take? Get an instant paraphrase of this document with our AI Paraphraser
MANAGING INTERNATIONAL BUSINESS 8
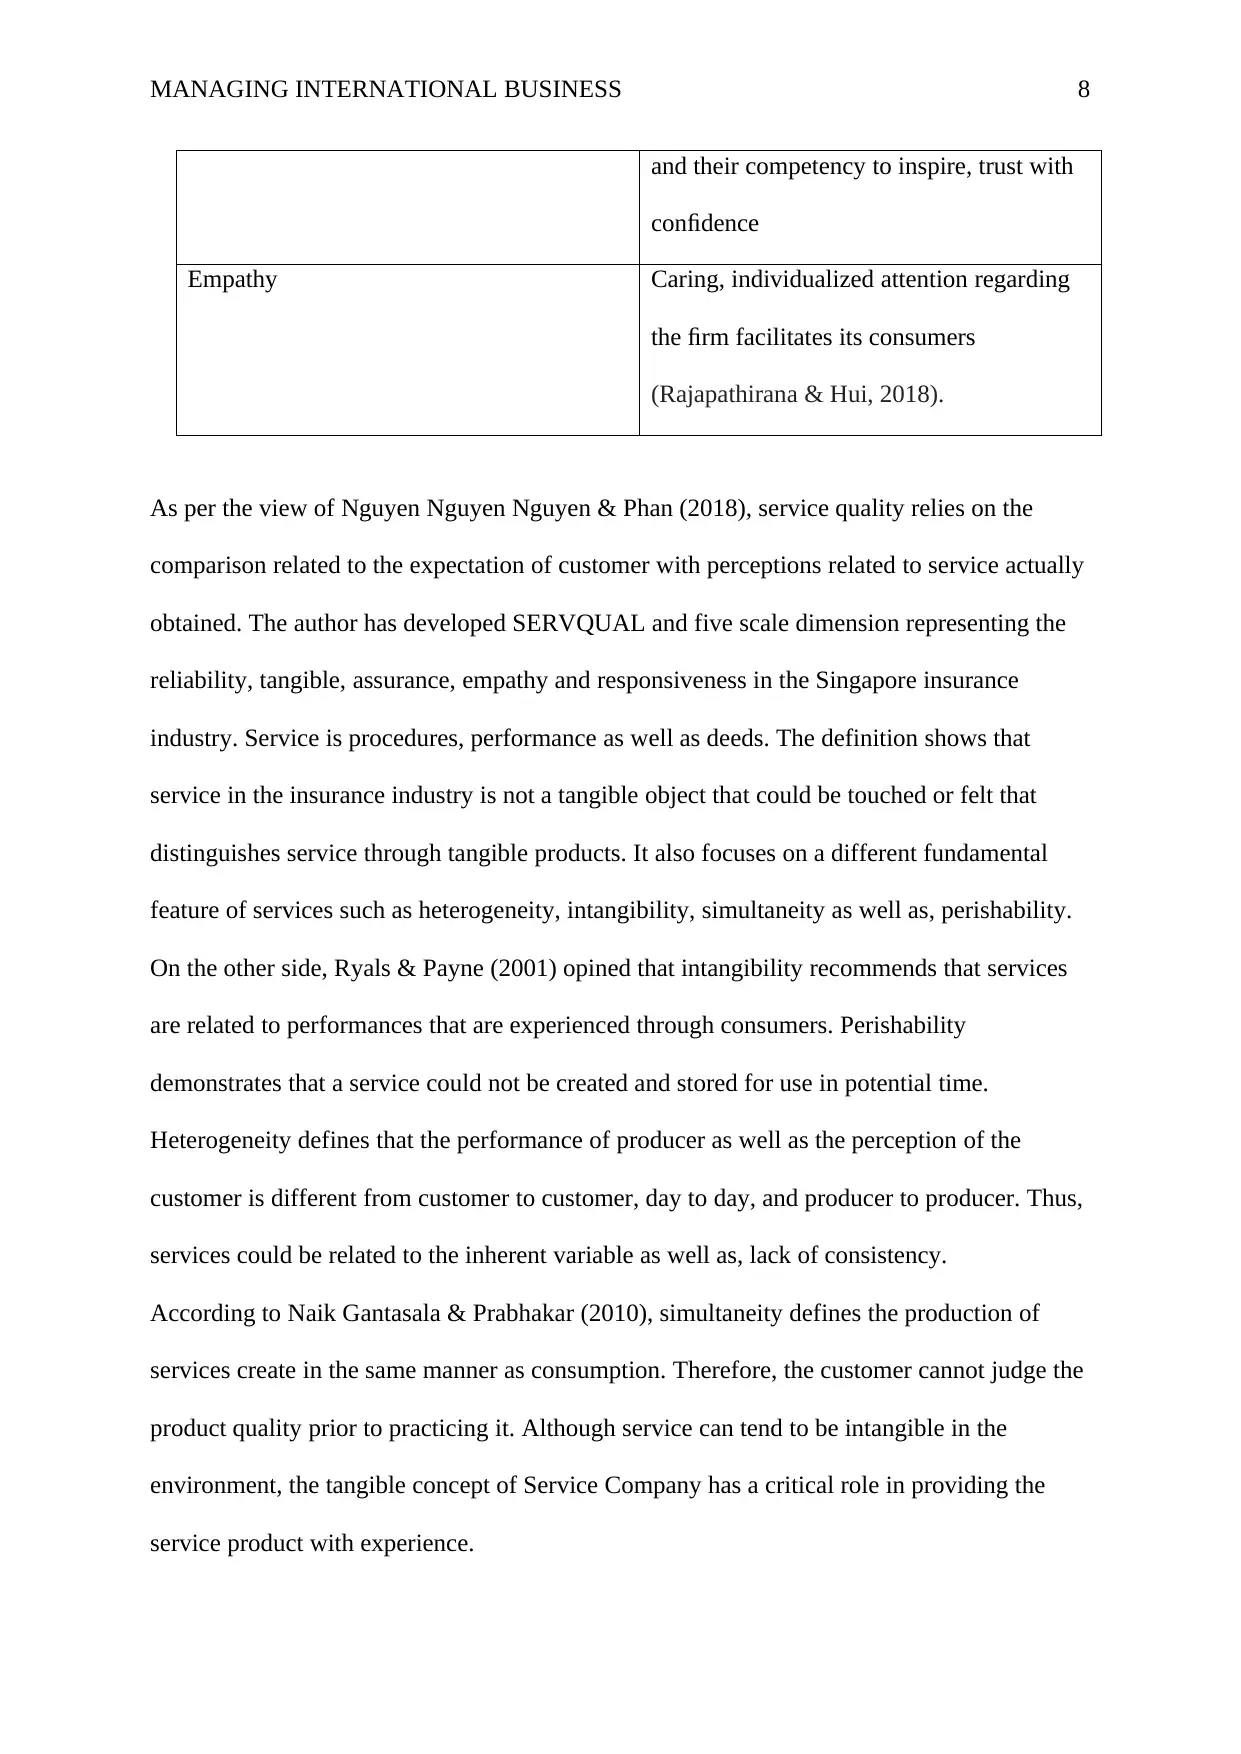
and their competency to inspire, trust with
confidence
Empathy Caring, individualized attention regarding
the firm facilitates its consumers
(Rajapathirana & Hui, 2018).
As per the view of Nguyen Nguyen Nguyen & Phan (2018), service quality relies on the
comparison related to the expectation of customer with perceptions related to service actually
obtained. The author has developed SERVQUAL and five scale dimension representing the
reliability, tangible, assurance, empathy and responsiveness in the Singapore insurance
industry. Service is procedures, performance as well as deeds. The definition shows that
service in the insurance industry is not a tangible object that could be touched or felt that
distinguishes service through tangible products. It also focuses on a different fundamental
feature of services such as heterogeneity, intangibility, simultaneity as well as, perishability.
On the other side, Ryals & Payne (2001) opined that intangibility recommends that services
are related to performances that are experienced through consumers. Perishability
demonstrates that a service could not be created and stored for use in potential time.
Heterogeneity defines that the performance of producer as well as the perception of the
customer is different from customer to customer, day to day, and producer to producer. Thus,
services could be related to the inherent variable as well as, lack of consistency.
According to Naik Gantasala & Prabhakar (2010), simultaneity defines the production of
services create in the same manner as consumption. Therefore, the customer cannot judge the
product quality prior to practicing it. Although service can tend to be intangible in the
environment, the tangible concept of Service Company has a critical role in providing the
service product with experience.
MANAGING INTERNATIONAL BUSINESS 9
In opposed to this, The straits times (2019) stated that when the core benefit source is higher
intangible as compared to tangible, it can be considered as a service. It has criticized
SERVQUAL and proposed the alternative scale such as SERVPERF. It involves all
SERVQUAL scale dimension, however, uses only service performance as a measure for
customer perceived service quality instead of the gap among expectation and perception
strategy of SEQUAL.
As per the view of Abu-Salim Onyia Harrison & Lindsay (2017), among different aspects
related to service quality, service quality gap model plays a significant role in the literature of
service management. Gap identifies the precious proposition related to how the notion
‘service quality’ may be comprehended and how the service quality origins across the service
company.
On the other hand, Ramamoorthy et al. (2018) stated that cognitive level of service quality is
assessed by distinguishing between the perception of after sale service and pre-sell service
expectation. Hence, the credit card, product maintenance, and banks, as well as the security
agent industry were processed by using the exploration investigation in order to further
develop the service quality model.
Lovelock & Patterson (2015) discussed the causes that the service quality of the service
industry cannot attain customer demand. It also considers that in terms of attaining the
customer demand, it is required to incorporate the five service quality gaps in the model.
These five gaps are considered as the difference between manager cognition and customer
expectation, the difference between service quality standard and manager cognition, the
difference between provided services as well as external communication, the difference
between expected services, and customer cognition services.
According to Kondasani & Panda (2015), in order to satisfy the consumers, the difference of
gap 5 should be shortened, hence, directly involving the customer expected service standard
⊘ This is a preview!⊘
Do you want full access?
Subscribe today to unlock all pages.
Trusted by 1+ million students worldwide
MANAGING INTERNATIONAL BUSINESS 10
as well as, actual perception service standard would permit the assessment of overall service
quality result that is the value of Gap 5. It is also identified that 11 determining factor related
to service quality in the model developed through the difference among the cognition services
and expected customer services. These respectively are competence, courtesy,
responsiveness, access, security, credibility, access, communication as well as,
understanding.
In contrast to this, Yadav Rai & Srivastava (2016) stated that ten service dimension can be
considered as the foundation for creating the questions. This literature has adopted the
concept related to service quality can be originated through difference among customer
expected services as well as, cognitive service. In this literature, Q indicates the service
quality, P demonstrates the perception, and E shows the expectation in developing the
questionnaire. This method is used to assess the service quality scale with good validity as
well as reliability. This scale is developed through five dimensions such as reliability,
responsiveness, tangibles, empathy, and assurance.
According to Wu & Li (2017), the company should make efforts for understanding customer
displeasure with the services that have resulted in several studies related to service quality as
well as, satisfaction. It is addressed that there is direct and indirect associations between
repurchase intention, perceived value, customer satisfaction, and service quality. For
instance, service quality is a major antecedent to repurchase intention, customer satisfaction,
and perceived value. It is also addressed that perceived value had a strong and positive impact
on the perceived value that in turn, influenced repurchase behavior.
On the other side, Eid (2015) evaluated that service quality is significant component related
to sports facilities manager that aims for sustaining and gaining their customer base,
competitive benefits, and creates sustainable sales from their consumers. This notion keeps
Paraphrase This Document
Need a fresh take? Get an instant paraphrase of this document with our AI Paraphraser
MANAGING INTERNATIONAL BUSINESS 11
the program targeted at the set of customer aged over 60. Along with this, service quality is a
decisive component in whether or not customers reconsider the sports services.
As per the view of Pansari & Kumar (2017), there is a critical issue in insurance marketing is
assessing the customer satisfaction, wants, expectations, transformations in preferences, and
needs so as to competently address contingent variable, which may associate to development
related to the strategic marketing plan. Service quality is illustrated as the ability of a
company for delivering the service in accordance with the level of expectation related to
customers.
In contrast to this, Moreira & Silva (2015) stated that the expectation is classified by the gap
among desires, and wants of customers, a post-purchase feeling of consumers as well as, the
offering of companies. This structure contains the twenty-two items that are originated
through the several focus groups with the consumers demonstrating different areas for the
service sector.
Díaz (2017) explained that the difference among service quality could be determined as the
extent of difference among expectation of customers with respect to service offered for each
quality dimension and items. Further investigation shows that there is a significant favorable
association among service quality and perceived value. Along with this, perceived value can
be illustrated as the evaluation of difference in perception among actual service performed
and the expectation of customers.
In contrast to this, Yu & Tseng (2019) stated that perceived service quality can be illustrated
as a judgment of the customer regarding the business overall dominance. Moreover, it is
defined as the evaluation of customer regarding received service performance along with,
how it is compared to the expectation. Another aspect examined that assessment is relied on
service attributes rather these relied on feelings and memory of customers. Therefore,
customers identify the service quality with respect to how the extent of satisfaction they have
MANAGING INTERNATIONAL BUSINESS 12
obtained through services. The role related to perceived service quality in customer
satisfaction is developed however the condition in a different dimension of impact will or will
not influence service quality evaluation, as well as customer satisfaction.
Ren Hyun & Park (2017) assessed that associations among service quality and customer
satisfaction are presented. However, perceived service quality could be managed through
treating the workforces in an appropriate way. The definition of service quality could be
provided on the basis of the outcome of Dinh (2017), who opined that perceived service
quality is demonstrated as the direction and degree related to discrepancy among perception
of customers as well as expectations.
As per the view of Narteh (2018), perceived quality is the actual customer experience related
to services. It is addressed that there is a favorable association between customer satisfaction
and service quality. It is stated that perceived quality has a positive and direct impact on the
extent of customer satisfaction. Prompt delivery of service will be perceived as a higher
extent of service quality whereas a sluggish delivery will be perceived as low service quality.
In contrast to this, Guo Barnes & Jia (2017) has categorized the function of expectations in
satisfaction into two parts such as the anticipation of satisfaction and another one is the role
of expectation as relative referents. While an individual explains the expectations as
anticipation then the customer thinks that the expectation may have a direct impact on
satisfaction level. Therefore, the aspect of expectation is related to standard against, which
result obtained through performance are measured.
In support of this, Oke Kamolshotiros Popoola Ajagbe & Olujobi (2016) stated that when the
actual outcome of consumers exceed expectation, then the customer would be called satisfied
and in the same manner, while the expectation exceeds the results, then the customer would
be dissatisfied. It is addressed that when comparing Japan and the US with respect to high
⊘ This is a preview!⊘
Do you want full access?
Subscribe today to unlock all pages.
Trusted by 1+ million students worldwide
1 out of 69
Related Documents


Your All-in-One AI-Powered Toolkit for Academic Success.
+13062052269
info@desklib.com
Available 24*7 on WhatsApp / Email
![[object Object]](/_next/static/media/star-bottom.7253800d.svg)
Unlock your academic potential
Copyright © 2020–2026 A2Z Services. All Rights Reserved. Developed and managed by ZUCOL.