Data Analysis and Forecasting of Manchester Humidity: Project Report
VerifiedAdded on 2023/01/16
|13
|1461
|38
Project
AI Summary
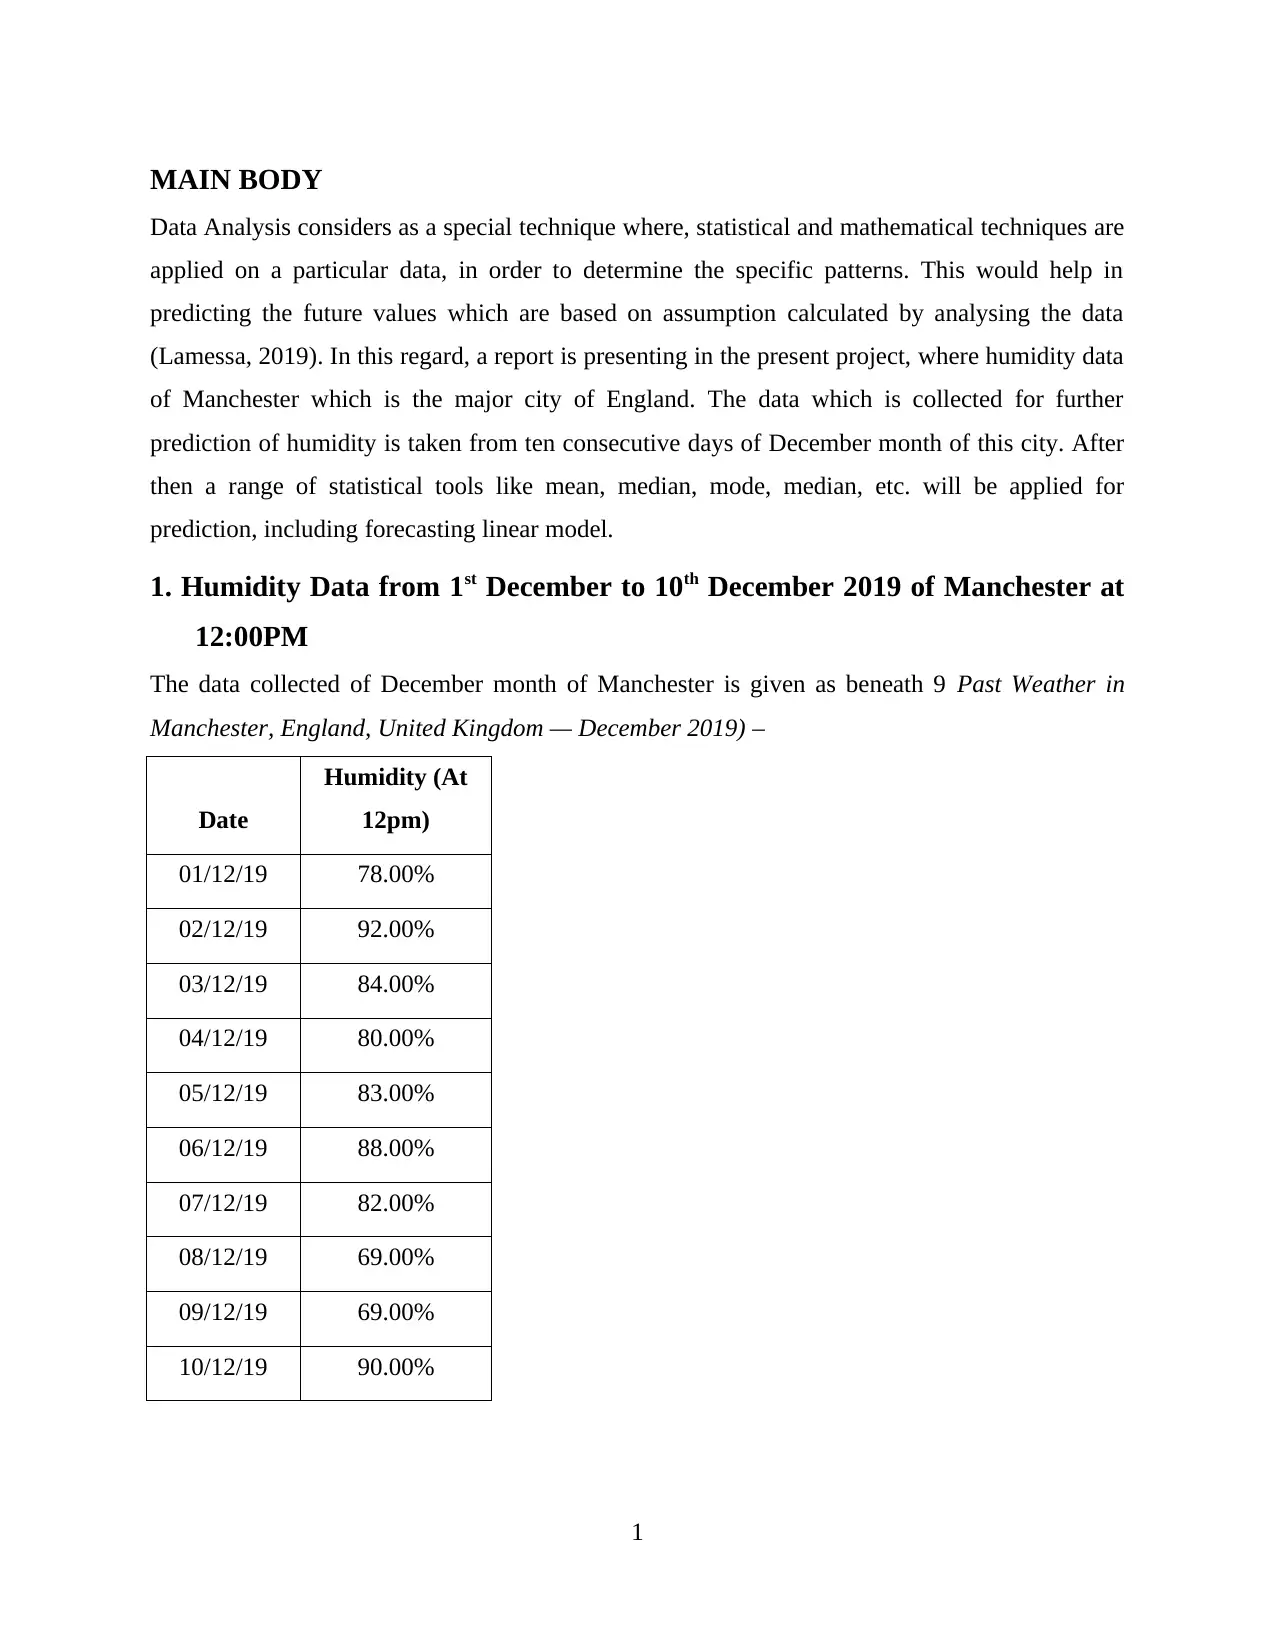
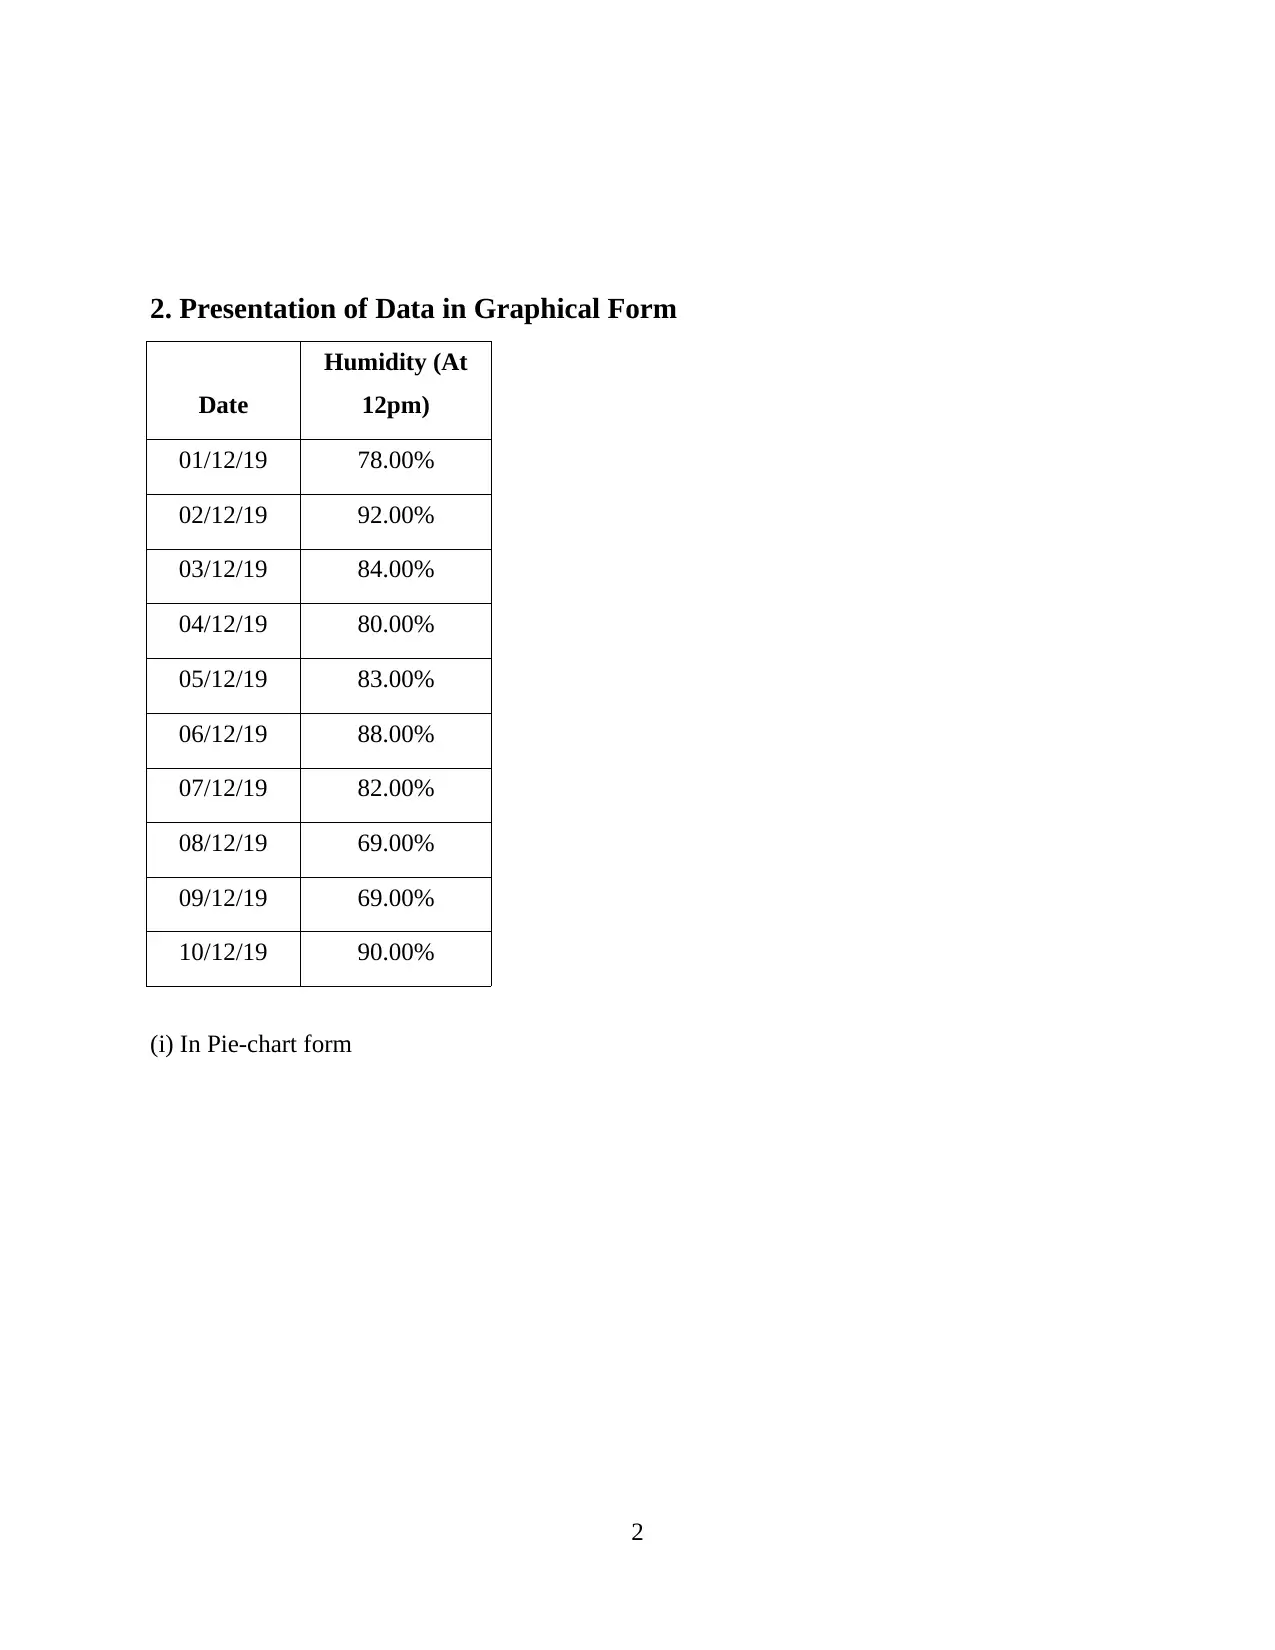
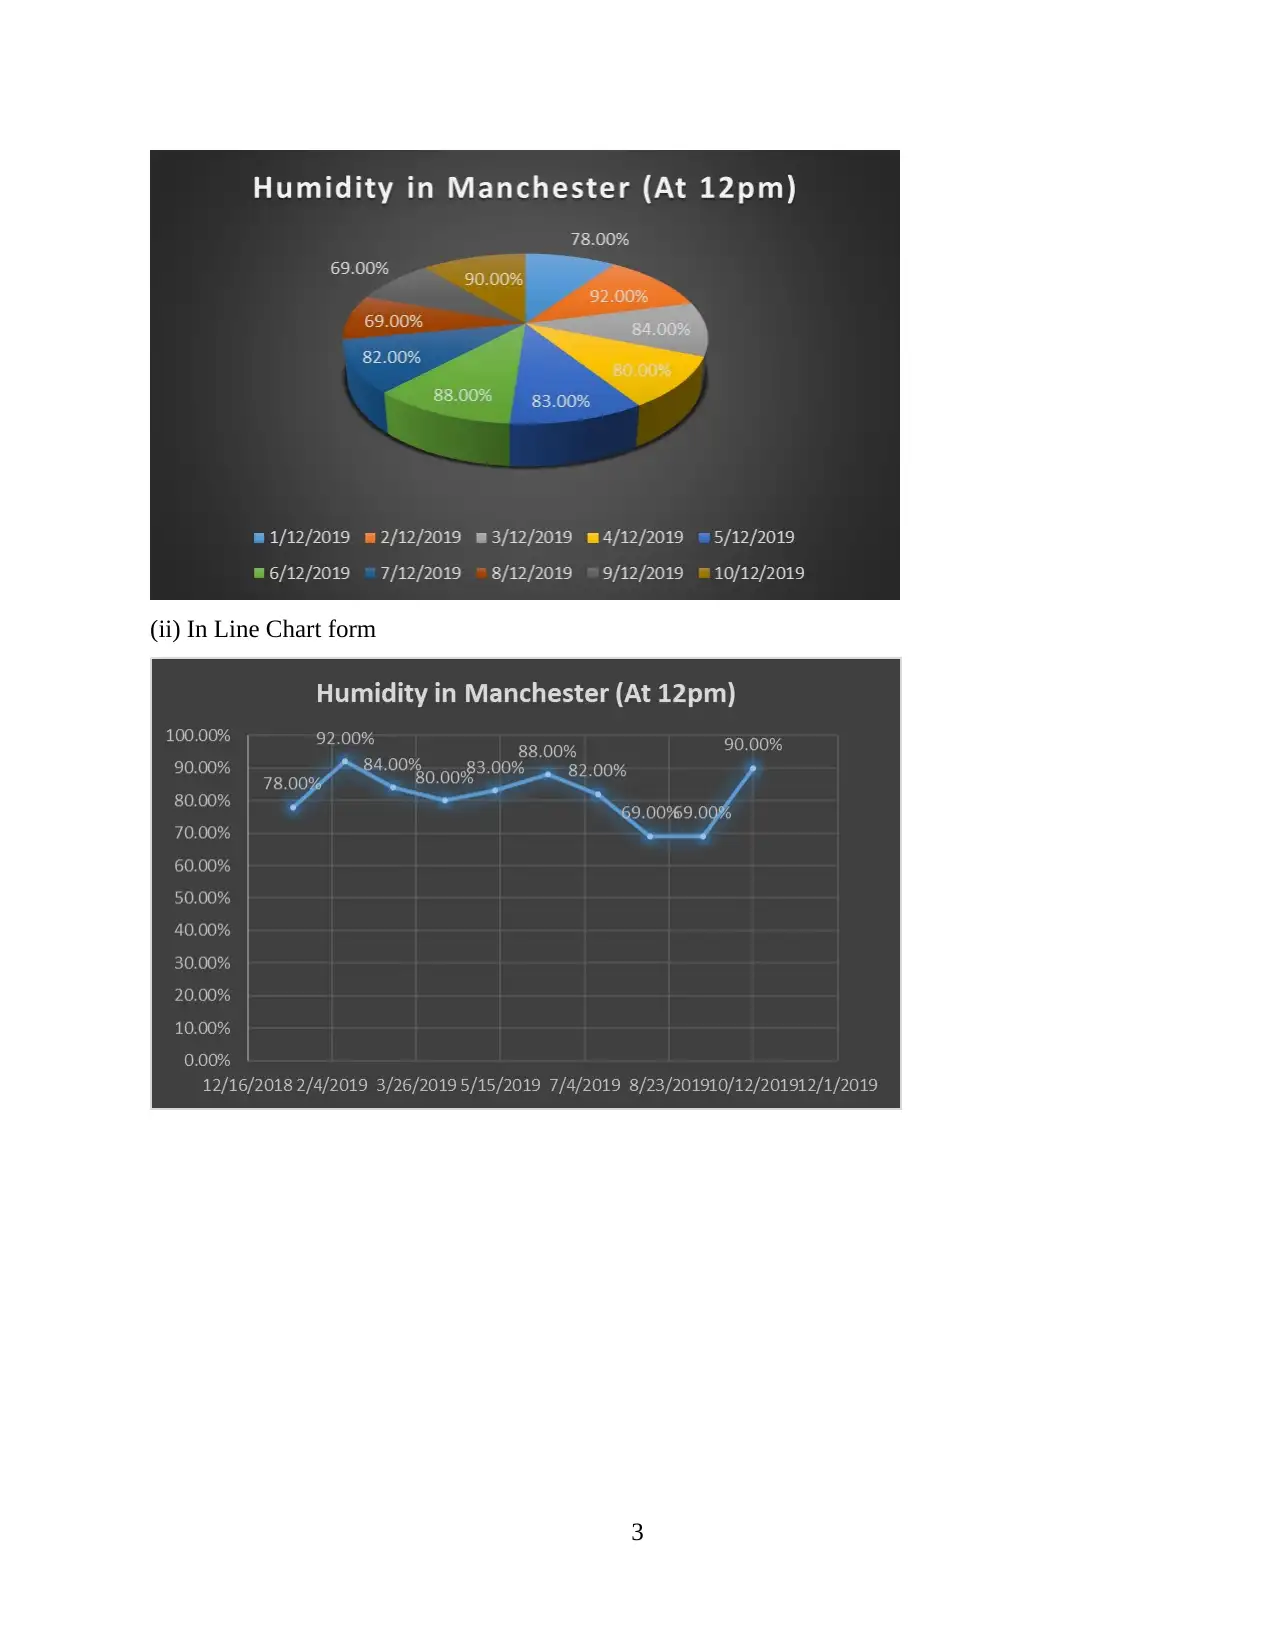
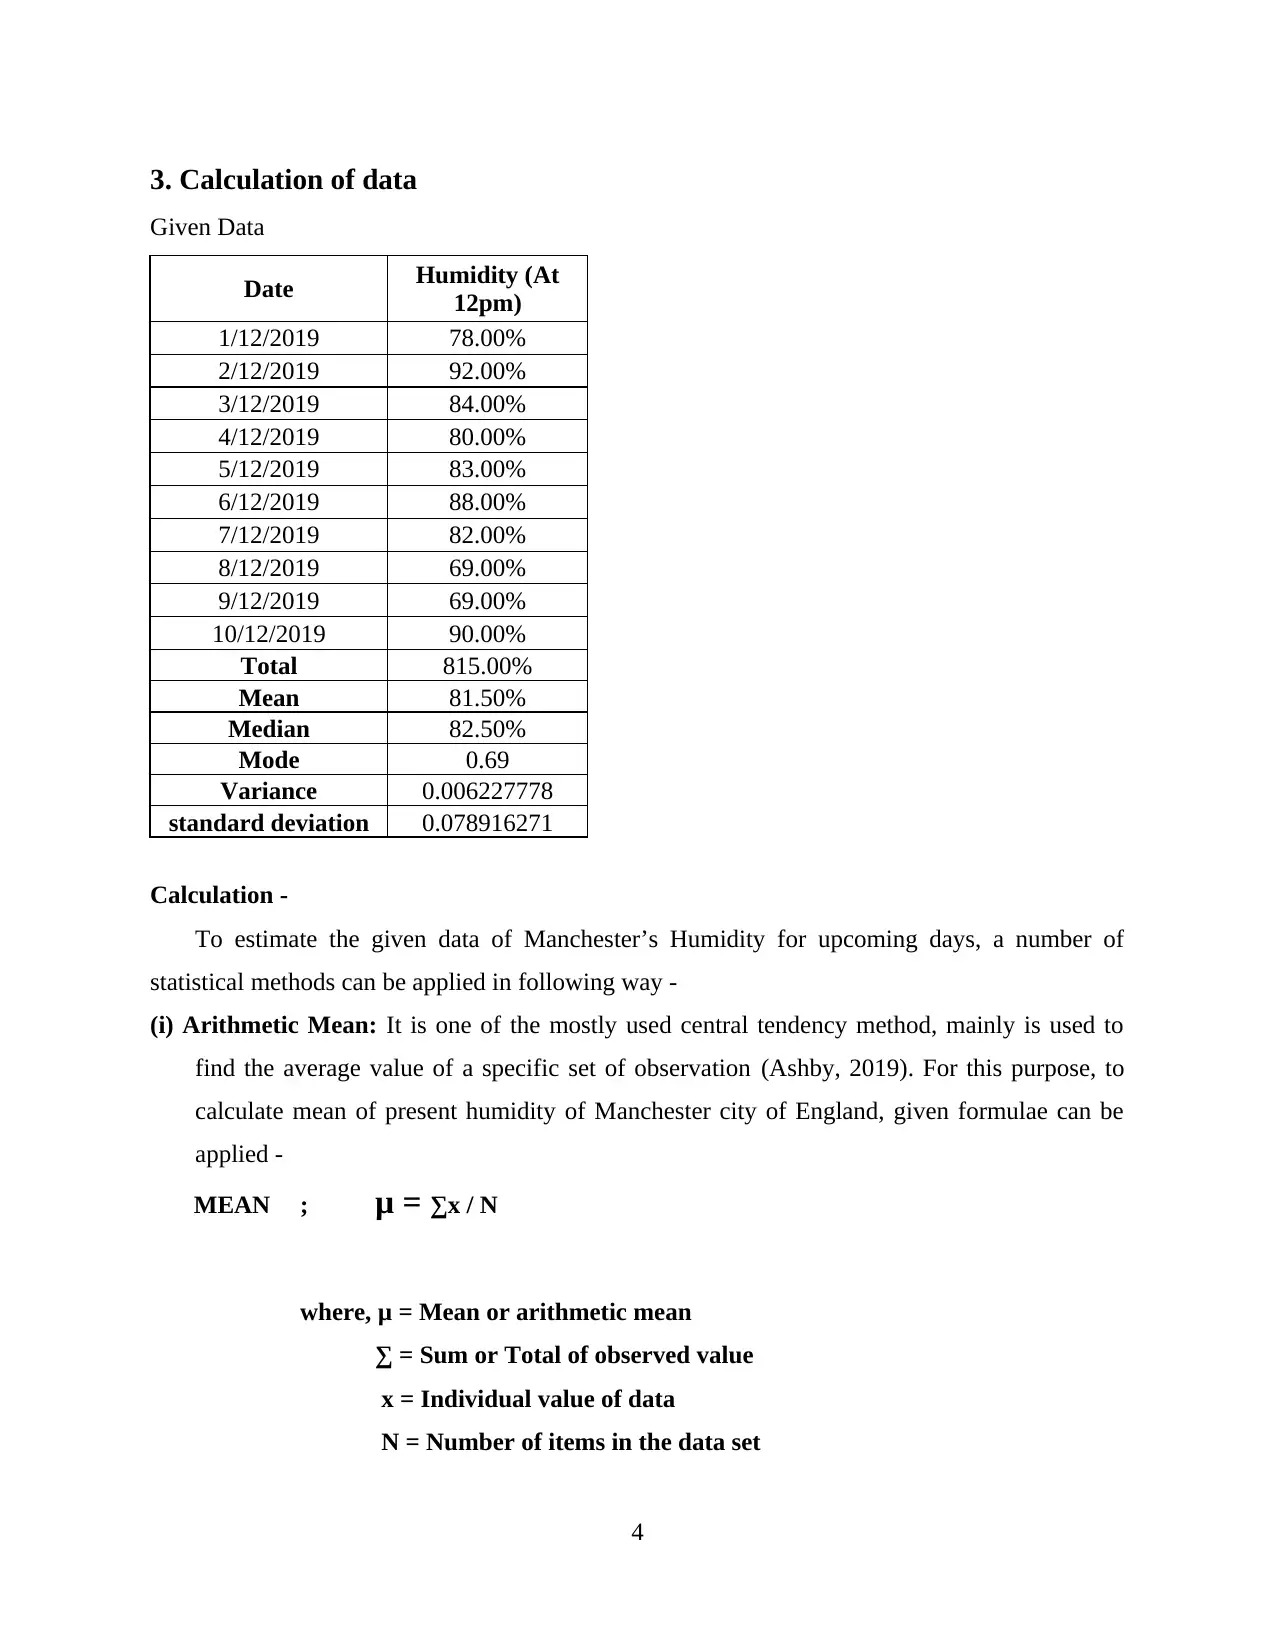
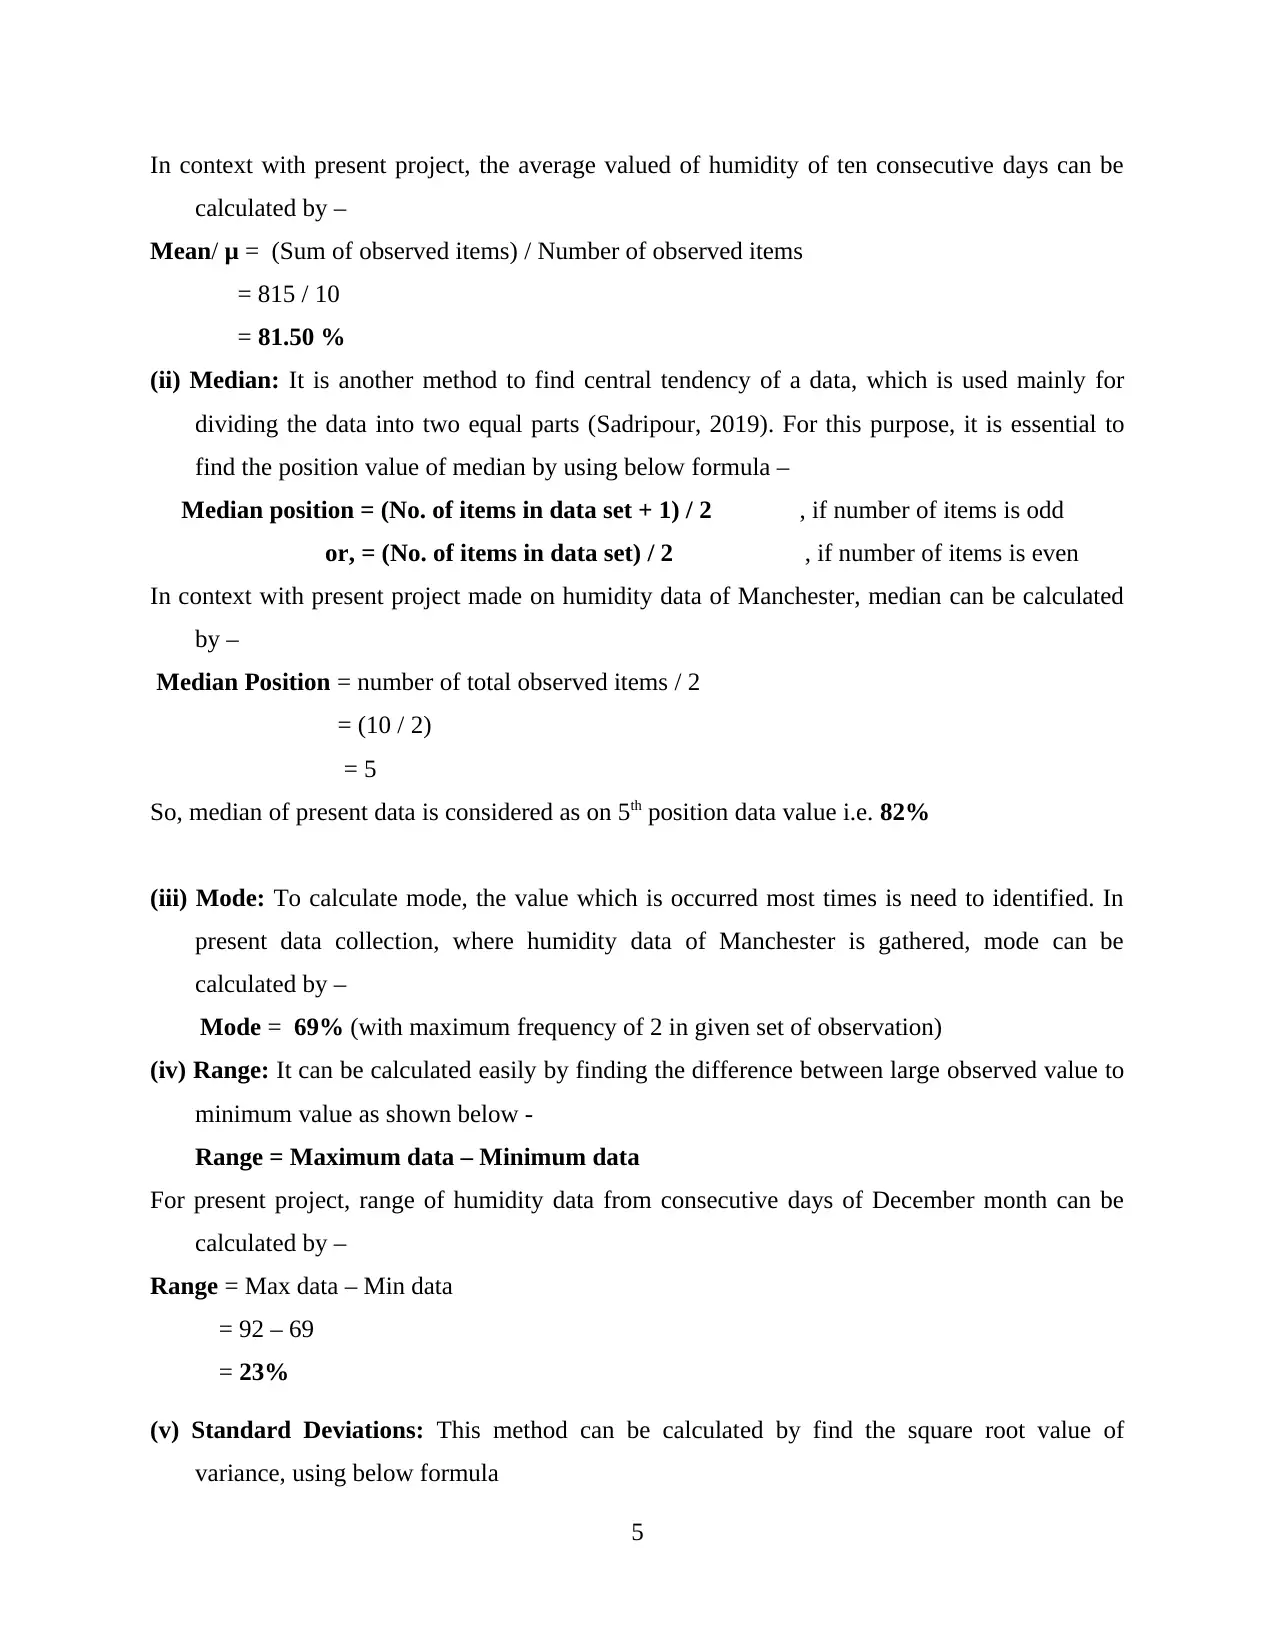
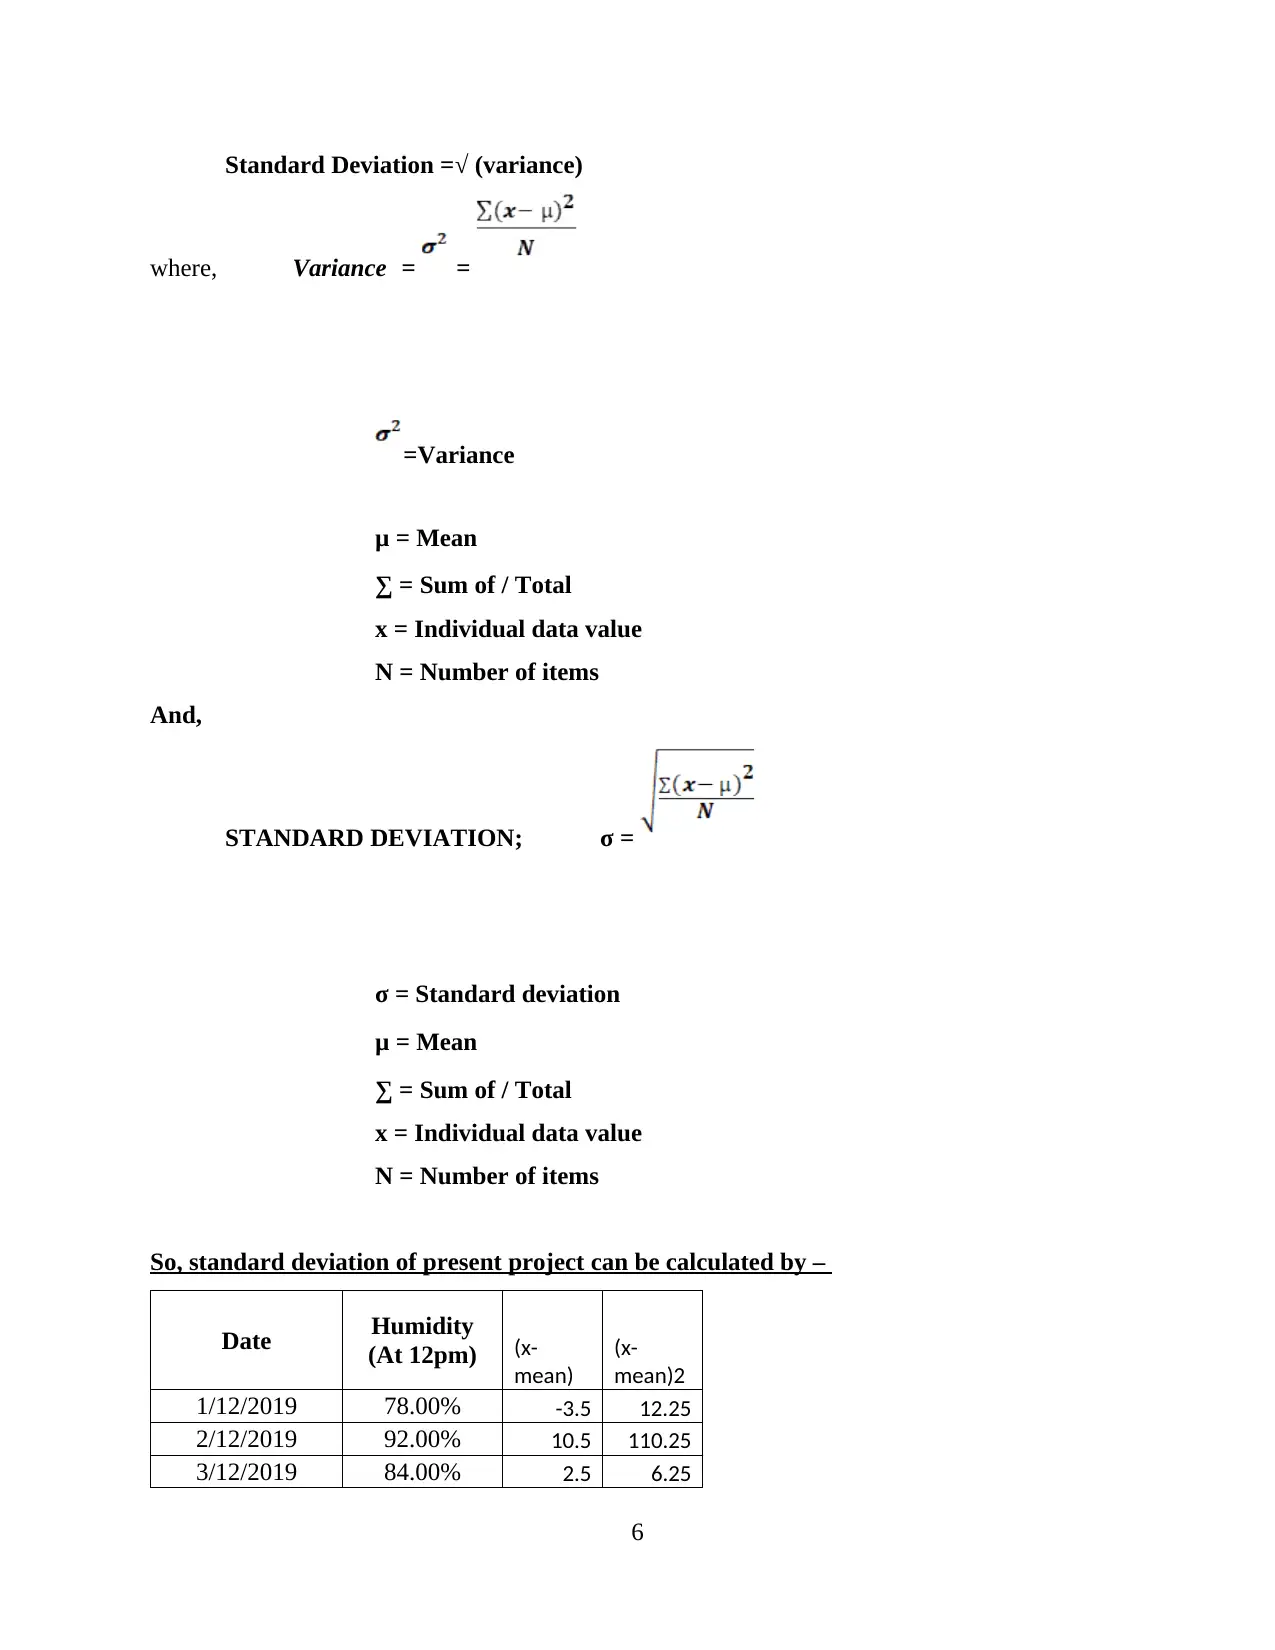
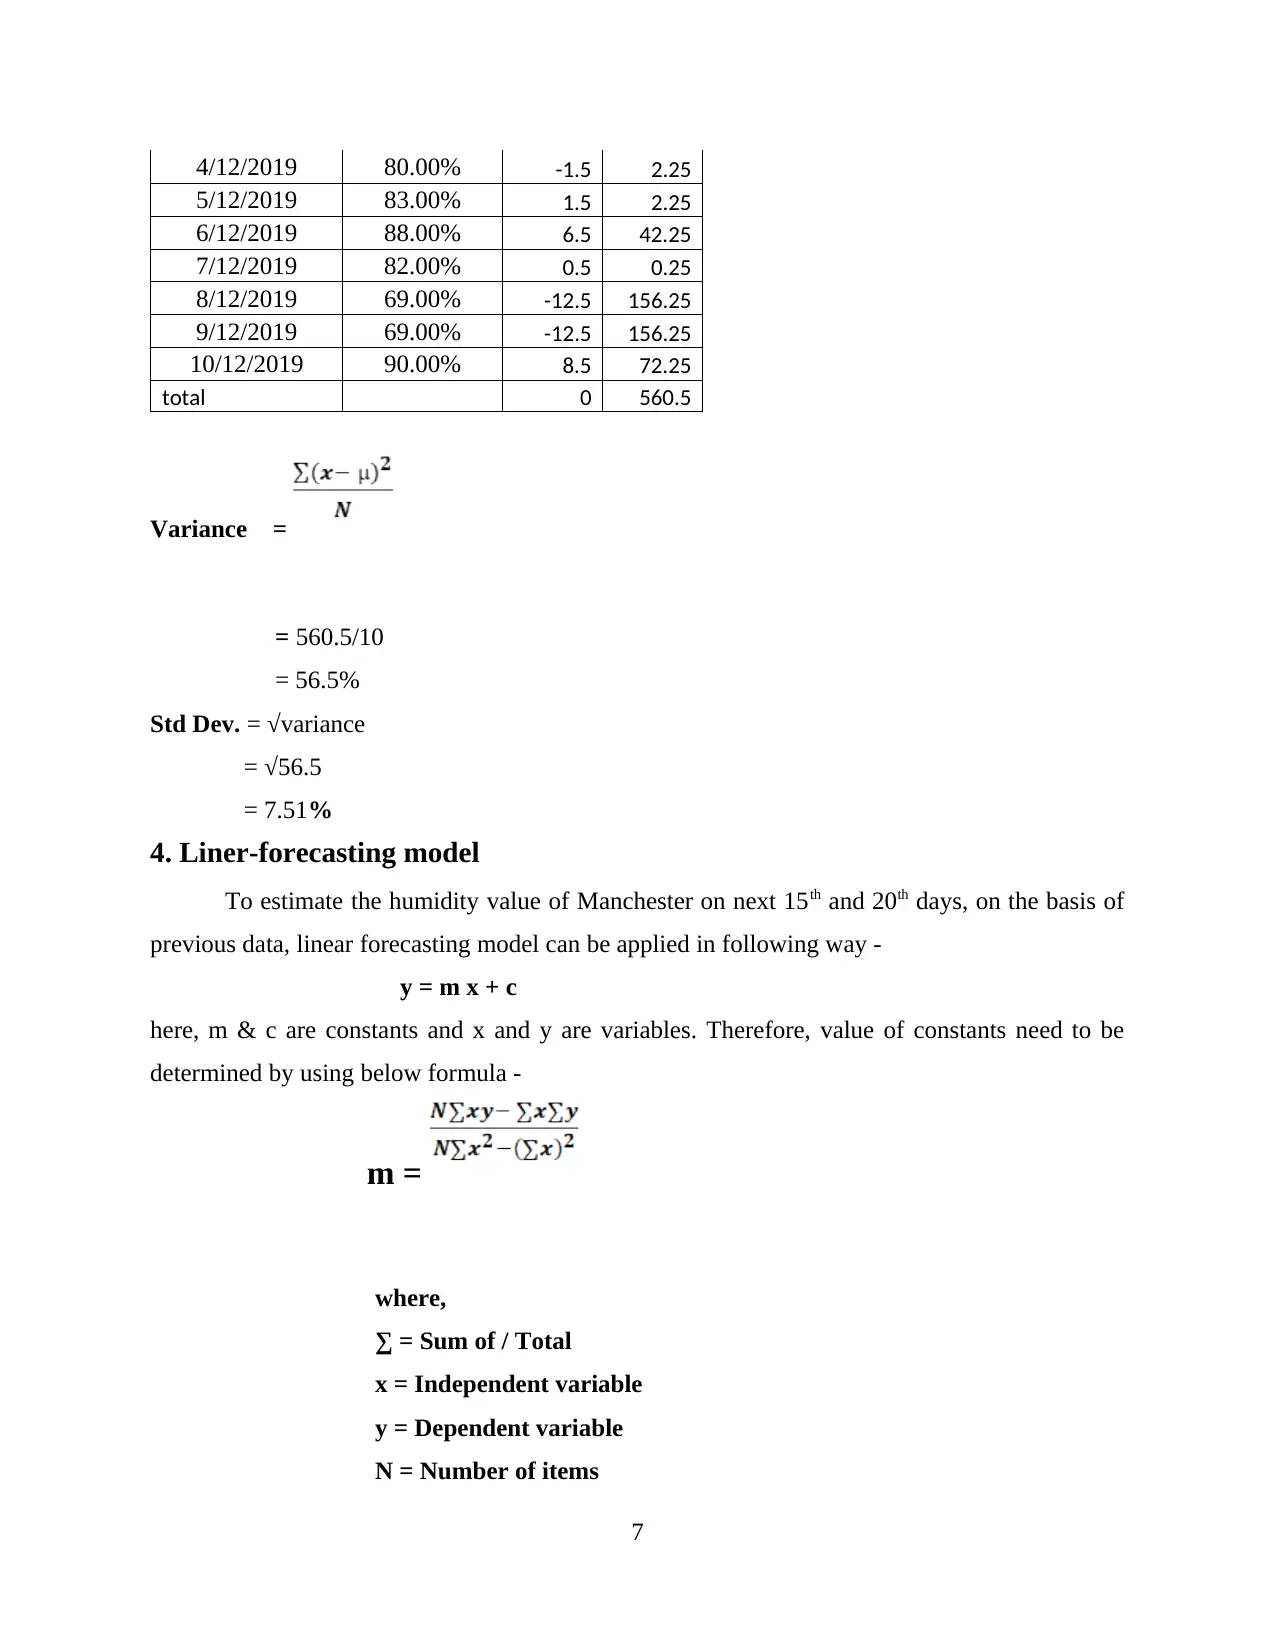
This project analyzes humidity data from Manchester, England, from December 1st to 10th, 2019, focusing on data analysis and forecasting. The project begins with the collection of humidity data at 12:00 PM each day. The data is then presented graphically using pie and line charts. Statistical calculations, including mean, median, mode, range, and standard deviation, are performed to understand the data's central tendencies and variability. Finally, a linear forecasting model is applied to estimate humidity levels for the 15th and 20th days of December. The project demonstrates the application of statistical methods to real-world data for predictive analysis.

Individual Project
Secure Best Marks with AI Grader
Need help grading? Try our AI Grader for instant feedback on your assignments.

Table of Contents
MAIN BODY...................................................................................................................................1
1. Humidity Data from 1st December to 10th December 2019 of Manchester at 12:00PM..............1
2. Presentation of Data in Graphical Form......................................................................................2
3. Calculation of data.......................................................................................................................4
4. Liner-forecasting model...............................................................................................................7
REFERENCES..............................................................................................................................10


MAIN BODY
Data Analysis considers as a special technique where, statistical and mathematical techniques are
applied on a particular data, in order to determine the specific patterns. This would help in
predicting the future values which are based on assumption calculated by analysing the data
(Lamessa, 2019). In this regard, a report is presenting in the present project, where humidity data
of Manchester which is the major city of England. The data which is collected for further
prediction of humidity is taken from ten consecutive days of December month of this city. After
then a range of statistical tools like mean, median, mode, median, etc. will be applied for
prediction, including forecasting linear model.
1. Humidity Data from 1st December to 10th December 2019 of Manchester at
12:00PM
The data collected of December month of Manchester is given as beneath 9 Past Weather in
Manchester, England, United Kingdom — December 2019) –
Date
Humidity (At
12pm)
01/12/19 78.00%
02/12/19 92.00%
03/12/19 84.00%
04/12/19 80.00%
05/12/19 83.00%
06/12/19 88.00%
07/12/19 82.00%
08/12/19 69.00%
09/12/19 69.00%
10/12/19 90.00%
1
Secure Best Marks with AI Grader
Need help grading? Try our AI Grader for instant feedback on your assignments.

2. Presentation of Data in Graphical Form
Date
Humidity (At
12pm)
01/12/19 78.00%
02/12/19 92.00%
03/12/19 84.00%
04/12/19 80.00%
05/12/19 83.00%
06/12/19 88.00%
07/12/19 82.00%
08/12/19 69.00%
09/12/19 69.00%
10/12/19 90.00%
(i) In Pie-chart form
2
Date
Humidity (At
12pm)
01/12/19 78.00%
02/12/19 92.00%
03/12/19 84.00%
04/12/19 80.00%
05/12/19 83.00%
06/12/19 88.00%
07/12/19 82.00%
08/12/19 69.00%
09/12/19 69.00%
10/12/19 90.00%
(i) In Pie-chart form
2

(ii) In Line Chart form
3
3

3. Calculation of data
Given Data
Date Humidity (At
12pm)
1/12/2019 78.00%
2/12/2019 92.00%
3/12/2019 84.00%
4/12/2019 80.00%
5/12/2019 83.00%
6/12/2019 88.00%
7/12/2019 82.00%
8/12/2019 69.00%
9/12/2019 69.00%
10/12/2019 90.00%
Total 815.00%
Mean 81.50%
Median 82.50%
Mode 0.69
Variance 0.006227778
standard deviation 0.078916271
Calculation -
To estimate the given data of Manchester’s Humidity for upcoming days, a number of
statistical methods can be applied in following way -
(i) Arithmetic Mean: It is one of the mostly used central tendency method, mainly is used to
find the average value of a specific set of observation (Ashby, 2019). For this purpose, to
calculate mean of present humidity of Manchester city of England, given formulae can be
applied -
MEAN ; μ = ∑x / N
where, μ = Mean or arithmetic mean
∑ = Sum or Total of observed value
x = Individual value of data
N = Number of items in the data set
4
Paraphrase This Document
Need a fresh take? Get an instant paraphrase of this document with our AI Paraphraser

In context with present project, the average valued of humidity of ten consecutive days can be
calculated by –
Mean/ μ = (Sum of observed items) / Number of observed items
= 815 / 10
= 81.50 %
(ii) Median: It is another method to find central tendency of a data, which is used mainly for
dividing the data into two equal parts (Sadripour, 2019). For this purpose, it is essential to
find the position value of median by using below formula –
Median position = (No. of items in data set + 1) / 2 , if number of items is odd
or, = (No. of items in data set) / 2 , if number of items is even
In context with present project made on humidity data of Manchester, median can be calculated
by –
Median Position = number of total observed items / 2
= (10 / 2)
= 5
So, median of present data is considered as on 5th position data value i.e. 82%
(iii) Mode: To calculate mode, the value which is occurred most times is need to identified. In
present data collection, where humidity data of Manchester is gathered, mode can be
calculated by –
Mode = 69% (with maximum frequency of 2 in given set of observation)
(iv) Range: It can be calculated easily by finding the difference between large observed value to
minimum value as shown below -
Range = Maximum data – Minimum data
For present project, range of humidity data from consecutive days of December month can be
calculated by –
Range = Max data – Min data
= 92 – 69
= 23%
(v) Standard Deviations: This method can be calculated by find the square root value of
variance, using below formula
5
calculated by –
Mean/ μ = (Sum of observed items) / Number of observed items
= 815 / 10
= 81.50 %
(ii) Median: It is another method to find central tendency of a data, which is used mainly for
dividing the data into two equal parts (Sadripour, 2019). For this purpose, it is essential to
find the position value of median by using below formula –
Median position = (No. of items in data set + 1) / 2 , if number of items is odd
or, = (No. of items in data set) / 2 , if number of items is even
In context with present project made on humidity data of Manchester, median can be calculated
by –
Median Position = number of total observed items / 2
= (10 / 2)
= 5
So, median of present data is considered as on 5th position data value i.e. 82%
(iii) Mode: To calculate mode, the value which is occurred most times is need to identified. In
present data collection, where humidity data of Manchester is gathered, mode can be
calculated by –
Mode = 69% (with maximum frequency of 2 in given set of observation)
(iv) Range: It can be calculated easily by finding the difference between large observed value to
minimum value as shown below -
Range = Maximum data – Minimum data
For present project, range of humidity data from consecutive days of December month can be
calculated by –
Range = Max data – Min data
= 92 – 69
= 23%
(v) Standard Deviations: This method can be calculated by find the square root value of
variance, using below formula
5

Standard Deviation =√ (variance)
where, Variance = =
=Variance
μ = Mean
∑ = Sum of / Total
x = Individual data value
N = Number of items
And,
STANDARD DEVIATION; σ =
σ = Standard deviation
μ = Mean
∑ = Sum of / Total
x = Individual data value
N = Number of items
So, standard deviation of present project can be calculated by –
Date Humidity
(At 12pm) (x-
mean)
(x-
mean)2
1/12/2019 78.00% -3.5 12.25
2/12/2019 92.00% 10.5 110.25
3/12/2019 84.00% 2.5 6.25
6

4/12/2019 80.00% -1.5 2.25
5/12/2019 83.00% 1.5 2.25
6/12/2019 88.00% 6.5 42.25
7/12/2019 82.00% 0.5 0.25
8/12/2019 69.00% -12.5 156.25
9/12/2019 69.00% -12.5 156.25
10/12/2019 90.00% 8.5 72.25
total 0 560.5
Variance =
= 560.5/10
= 56.5%
Std Dev. = √variance
= √56.5
= 7.51%
4. Liner-forecasting model
To estimate the humidity value of Manchester on next 15th and 20th days, on the basis of
previous data, linear forecasting model can be applied in following way -
y = m x + c
here, m & c are constants and x and y are variables. Therefore, value of constants need to be
determined by using below formula -
m =
where,
∑ = Sum of / Total
x = Independent variable
y = Dependent variable
N = Number of items
7
Secure Best Marks with AI Grader
Need help grading? Try our AI Grader for instant feedback on your assignments.

Calculating ‘c’ value;
c =
Days (X) Humidity (At
12pm) (Y) X2 ∑XY
1 78.00% 1 78
2 92.00% 4 184
3 84.00% 9 252
4 80.00% 16 320
5 83.00% 25 415
6 88.00% 36 528
7 82.00% 49 574
8 69.00% 64 552
9 69.00% 81 621
10 90.00% 100 900
Total = 55 815.00% 385 4424
From given table, m can be calculated as
m =
= 10 x 4424 – 55 x 815
10 x 385 – (55)2
= 44240– 44825
3850 – 3025
= - 585 = -0.709
825
8

Similarly,
c =
Now, c = 815 – (-0.709) x 55
10
= 850.005/10 = 85.00 (approx)
Put this value of m and c, in given linear forecasting model, to calculate the data of next days, in
following way –
Day 15 -
y = m x + c
= - 0.709 * 15 + 85.00
= 74.365
In this regard, the estimated value of humidity on 15th day of December as per pattern on
previous ten consecutive days will be 73.37% approx.
Similarly, For Day 20 -
y = m x + c
= - 0.709 * 20 + 85.00
= 70.82
On the 20th day of same month i.e. December, estimated value will be 70.82%. in Manchester
city.
9

REFERENCES
Books and Journals
Ashby, F. G., 2019. Statistical analysis of fMRI data. MIT press.
Lamessa, T., 2019. Computational Data analysis of Fourıer Transformatıon by Numerical
experiments (Numerical CODE). International Journal For Research In Mathematics And
Statistics (ISSN: 2208-2662). 5(5). pp.01-13.
Sadripour, S., 2019. 3D numerical analysis of atmospheric-aerosol/carbon-black nanofluid flow
within a solar air heater located in Shiraz, Iran. International Journal of Numerical Methods
for Heat & Fluid Flow. 29(4). pp.1378-1402.
Online
Past Weather in Manchester, England, United Kingdom — December 2019. [Online] Available
Through:<https://www.timeanddate.com/weather/uk/manchester/historic?
month=12&year=2019>.
10
1 out of 13

Your All-in-One AI-Powered Toolkit for Academic Success.
+13062052269
info@desklib.com
Available 24*7 on WhatsApp / Email
Unlock your academic potential
© 2024 | Zucol Services PVT LTD | All rights reserved.