Numeracy and Data Analysis: Wind Speed Data, Forecasting, and Charts
VerifiedAdded on 2021/02/19
|9
|1425
|42
Report
AI Summary
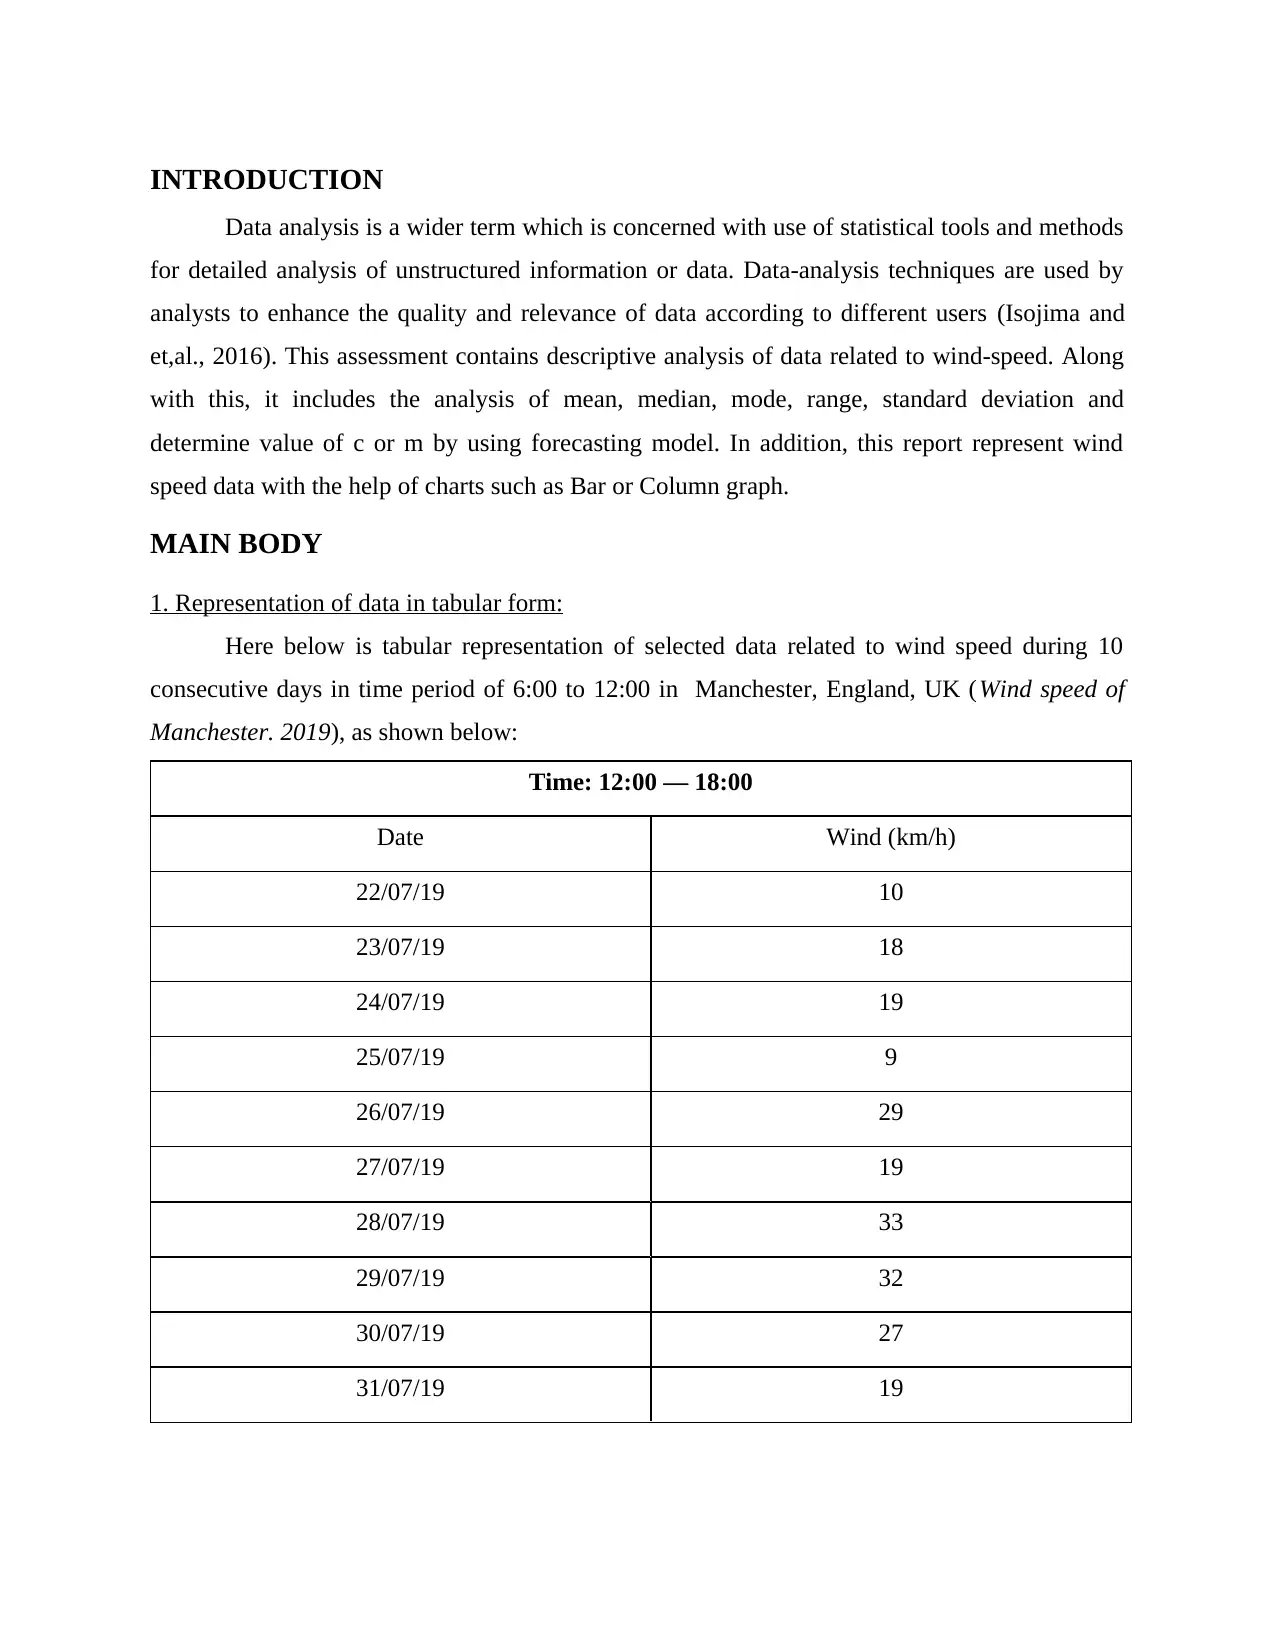
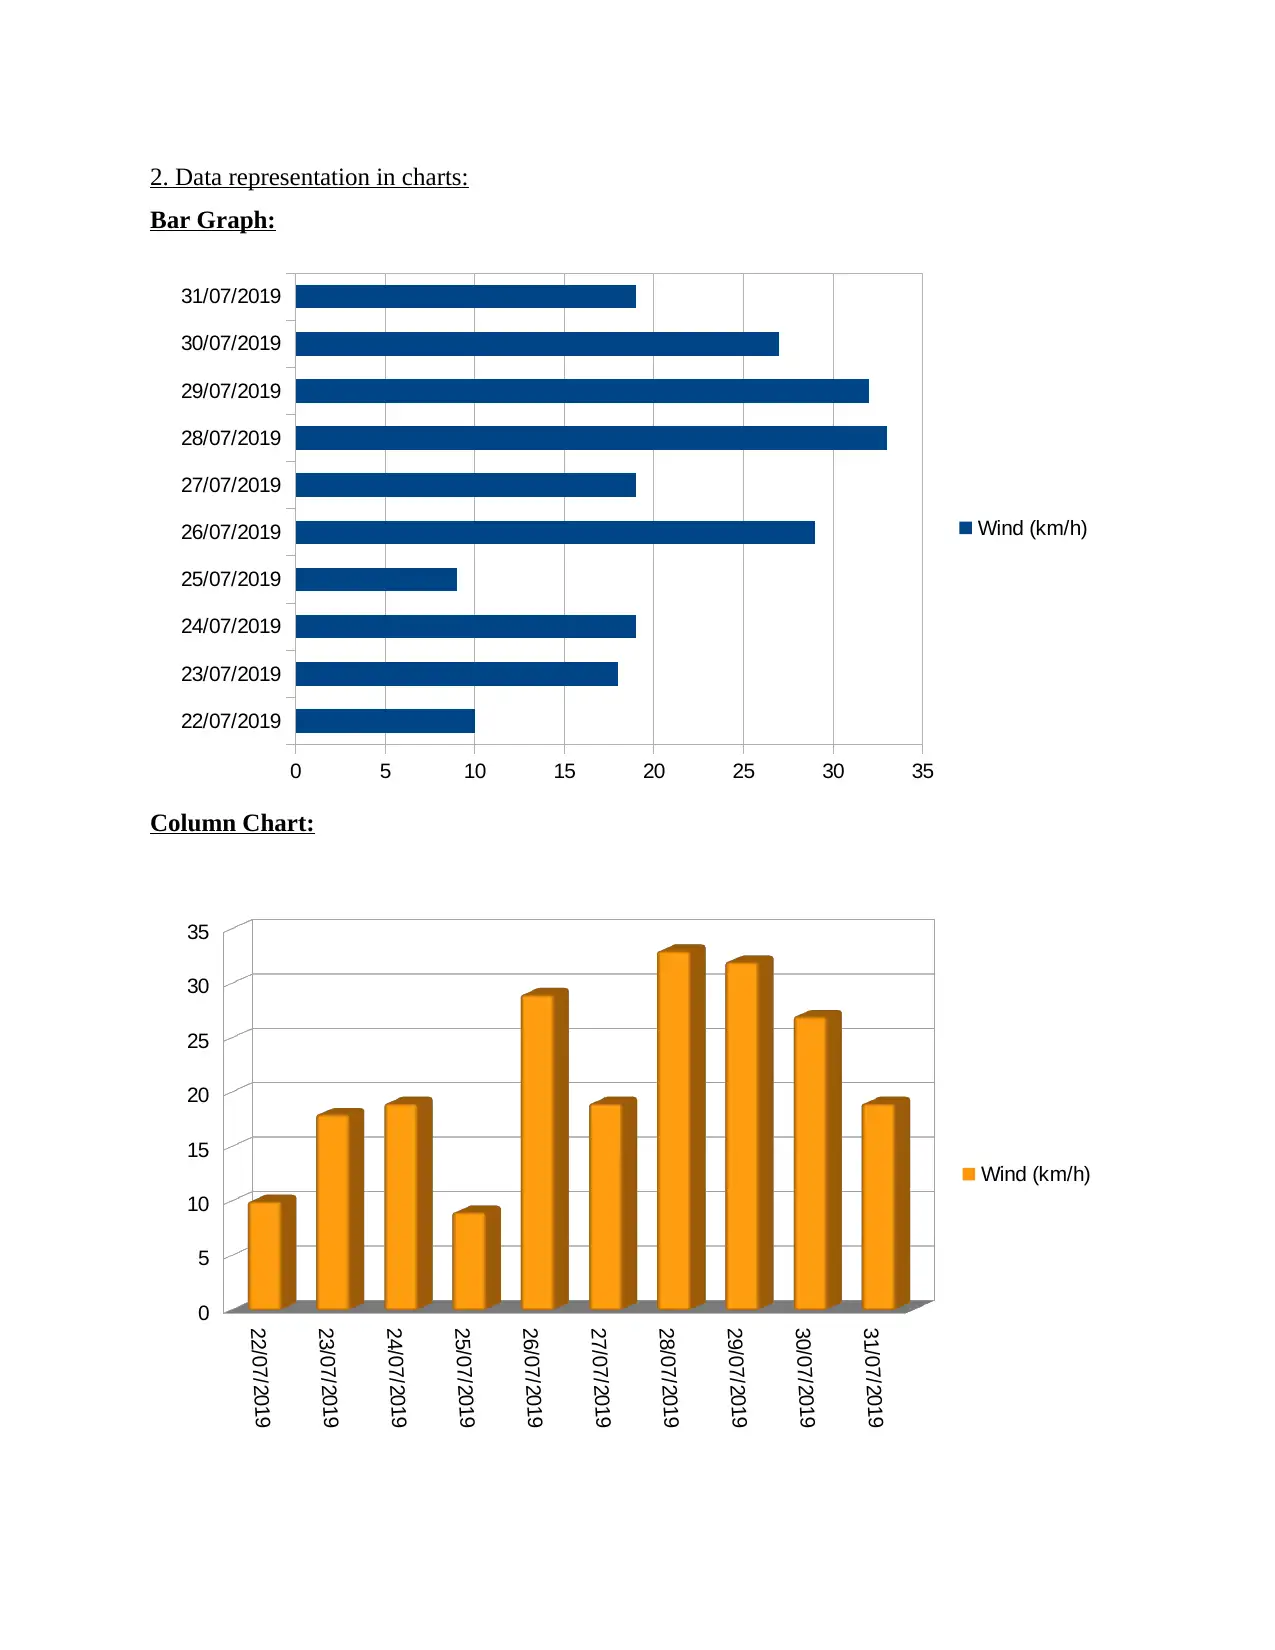
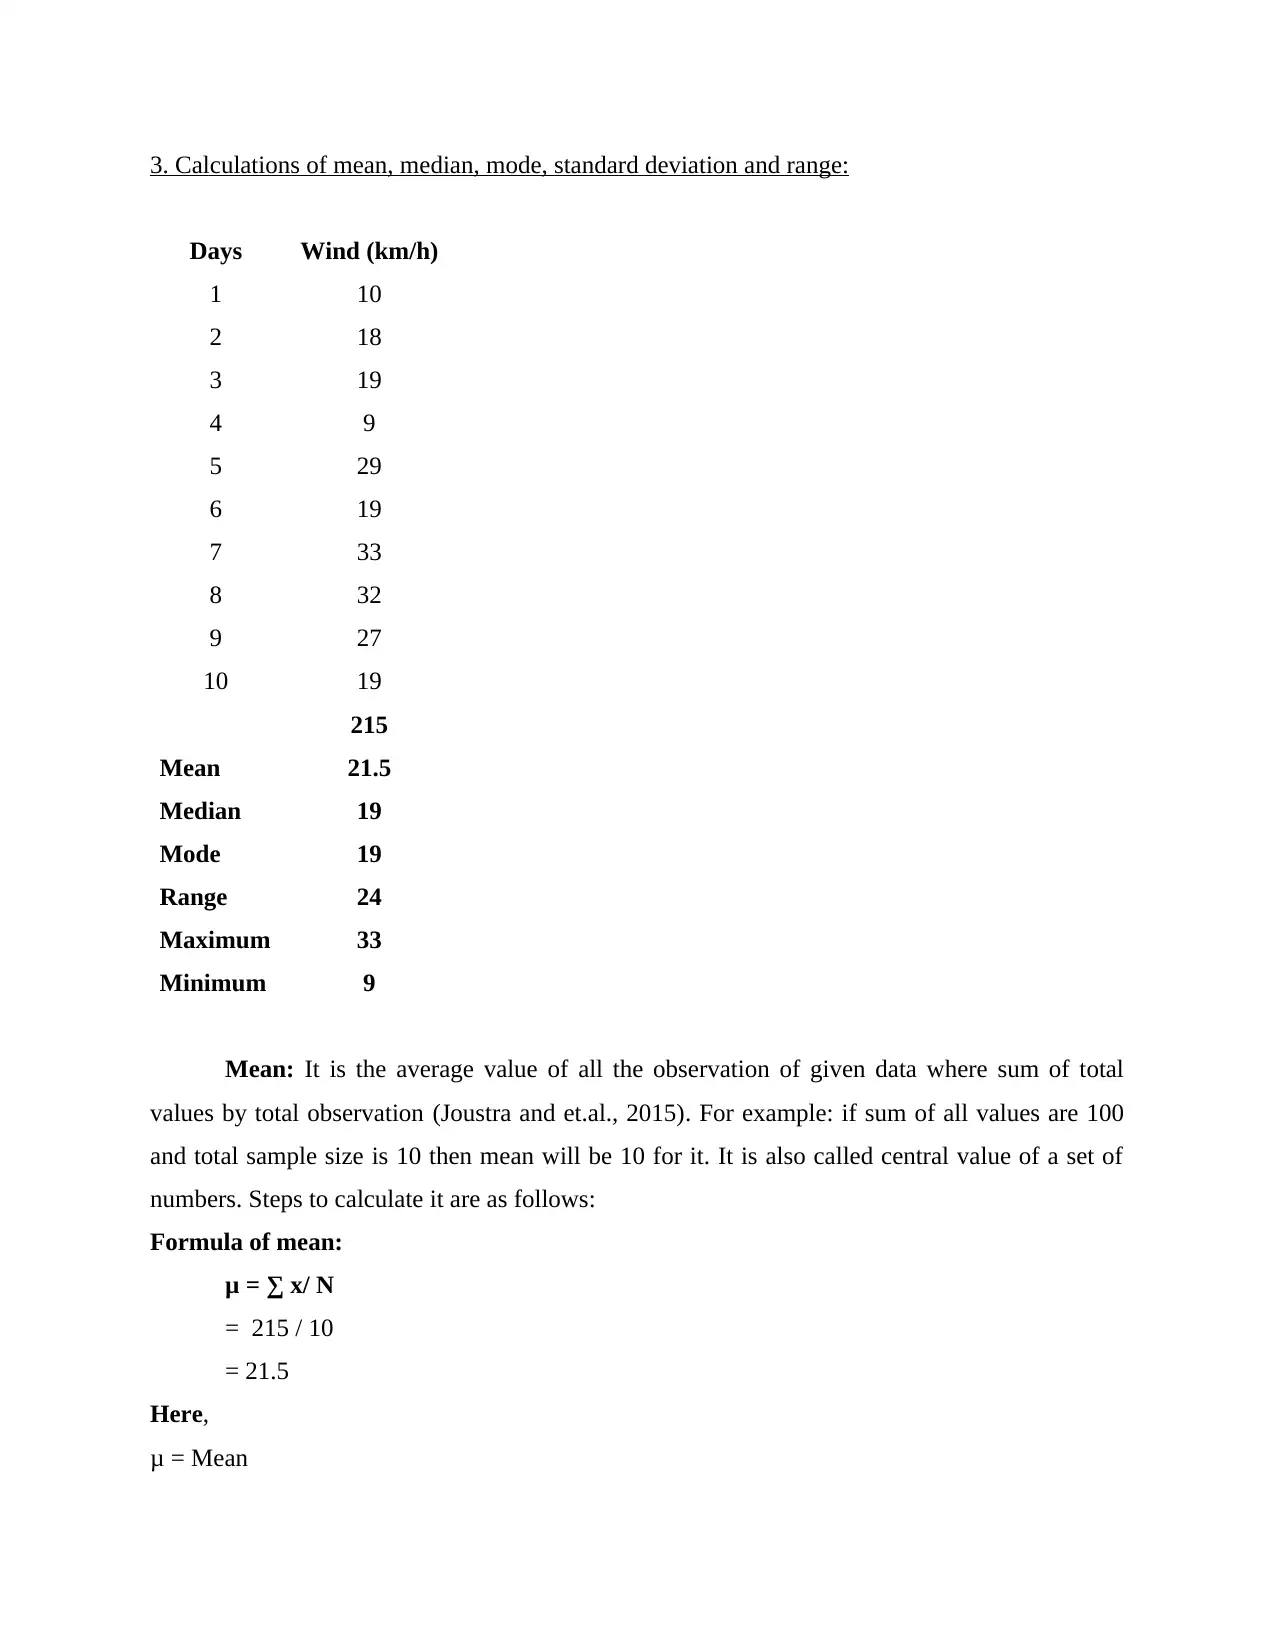
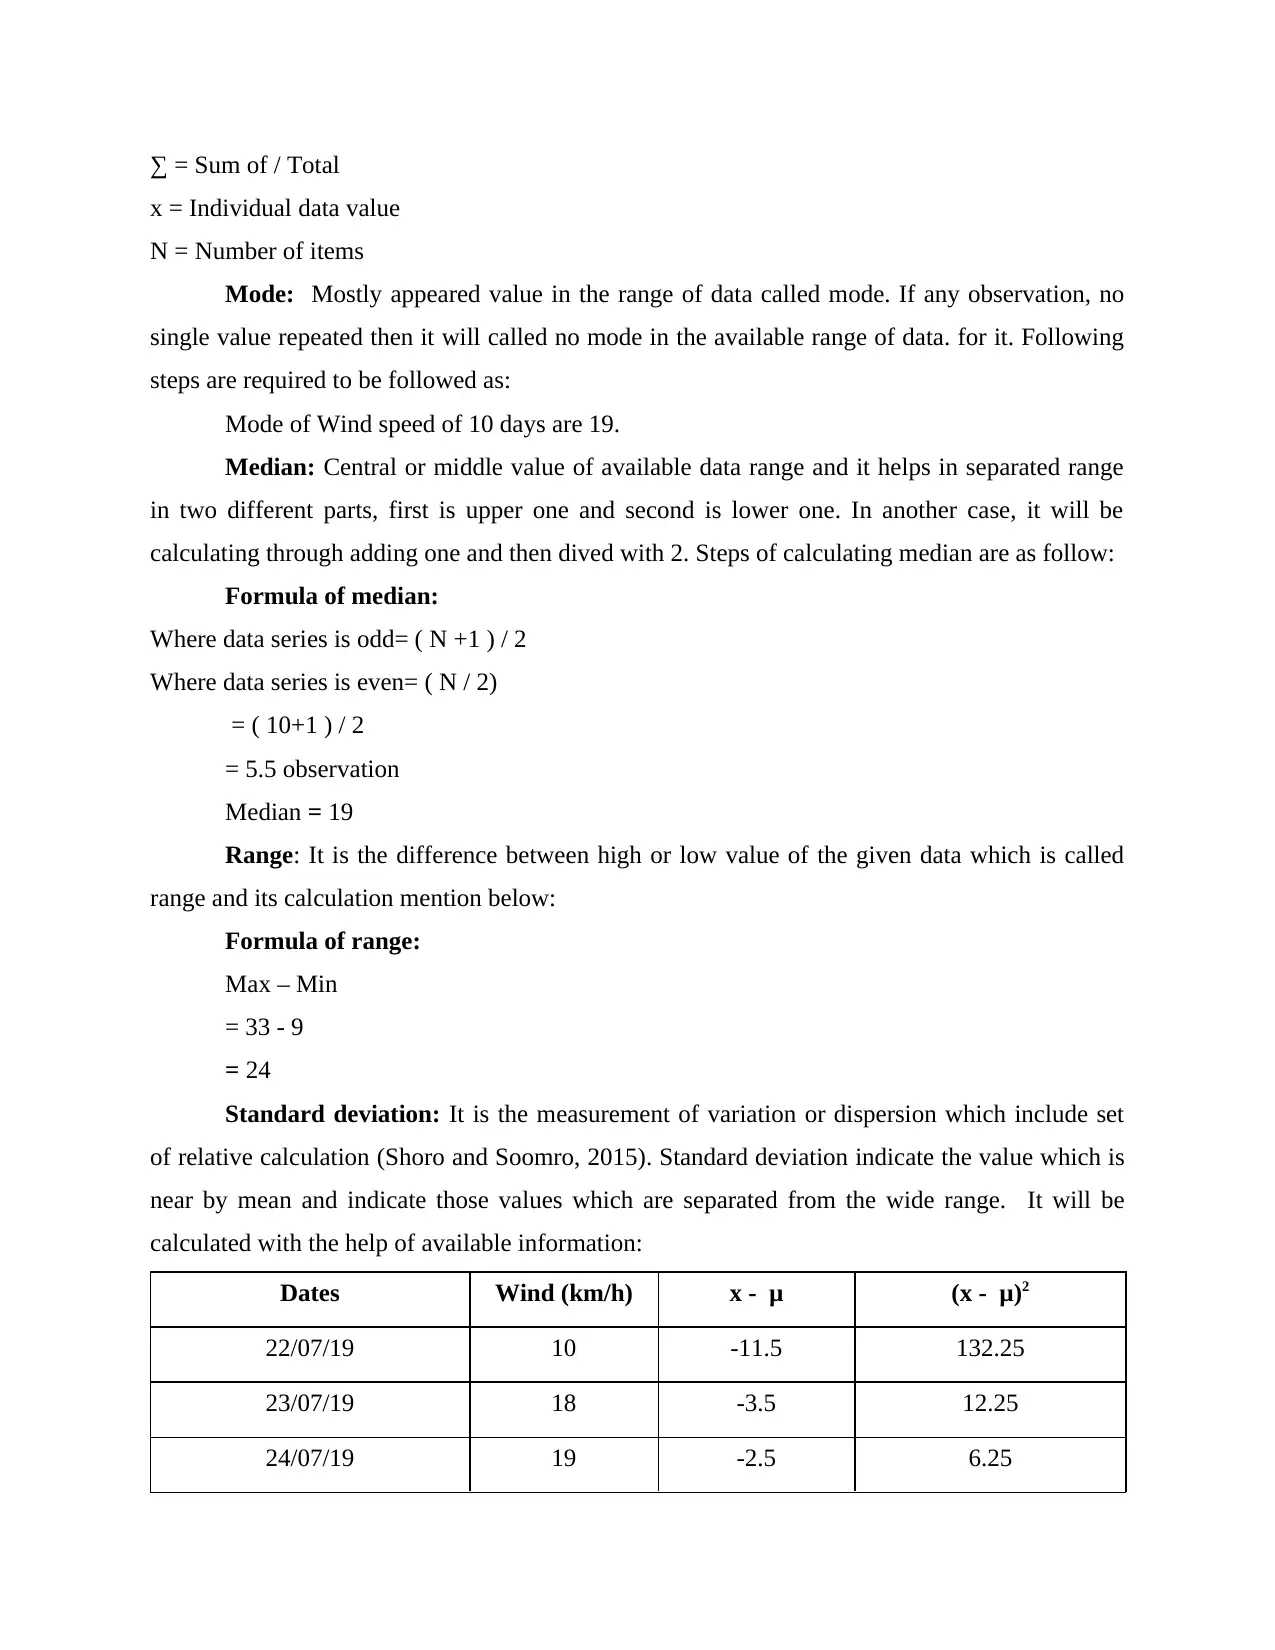
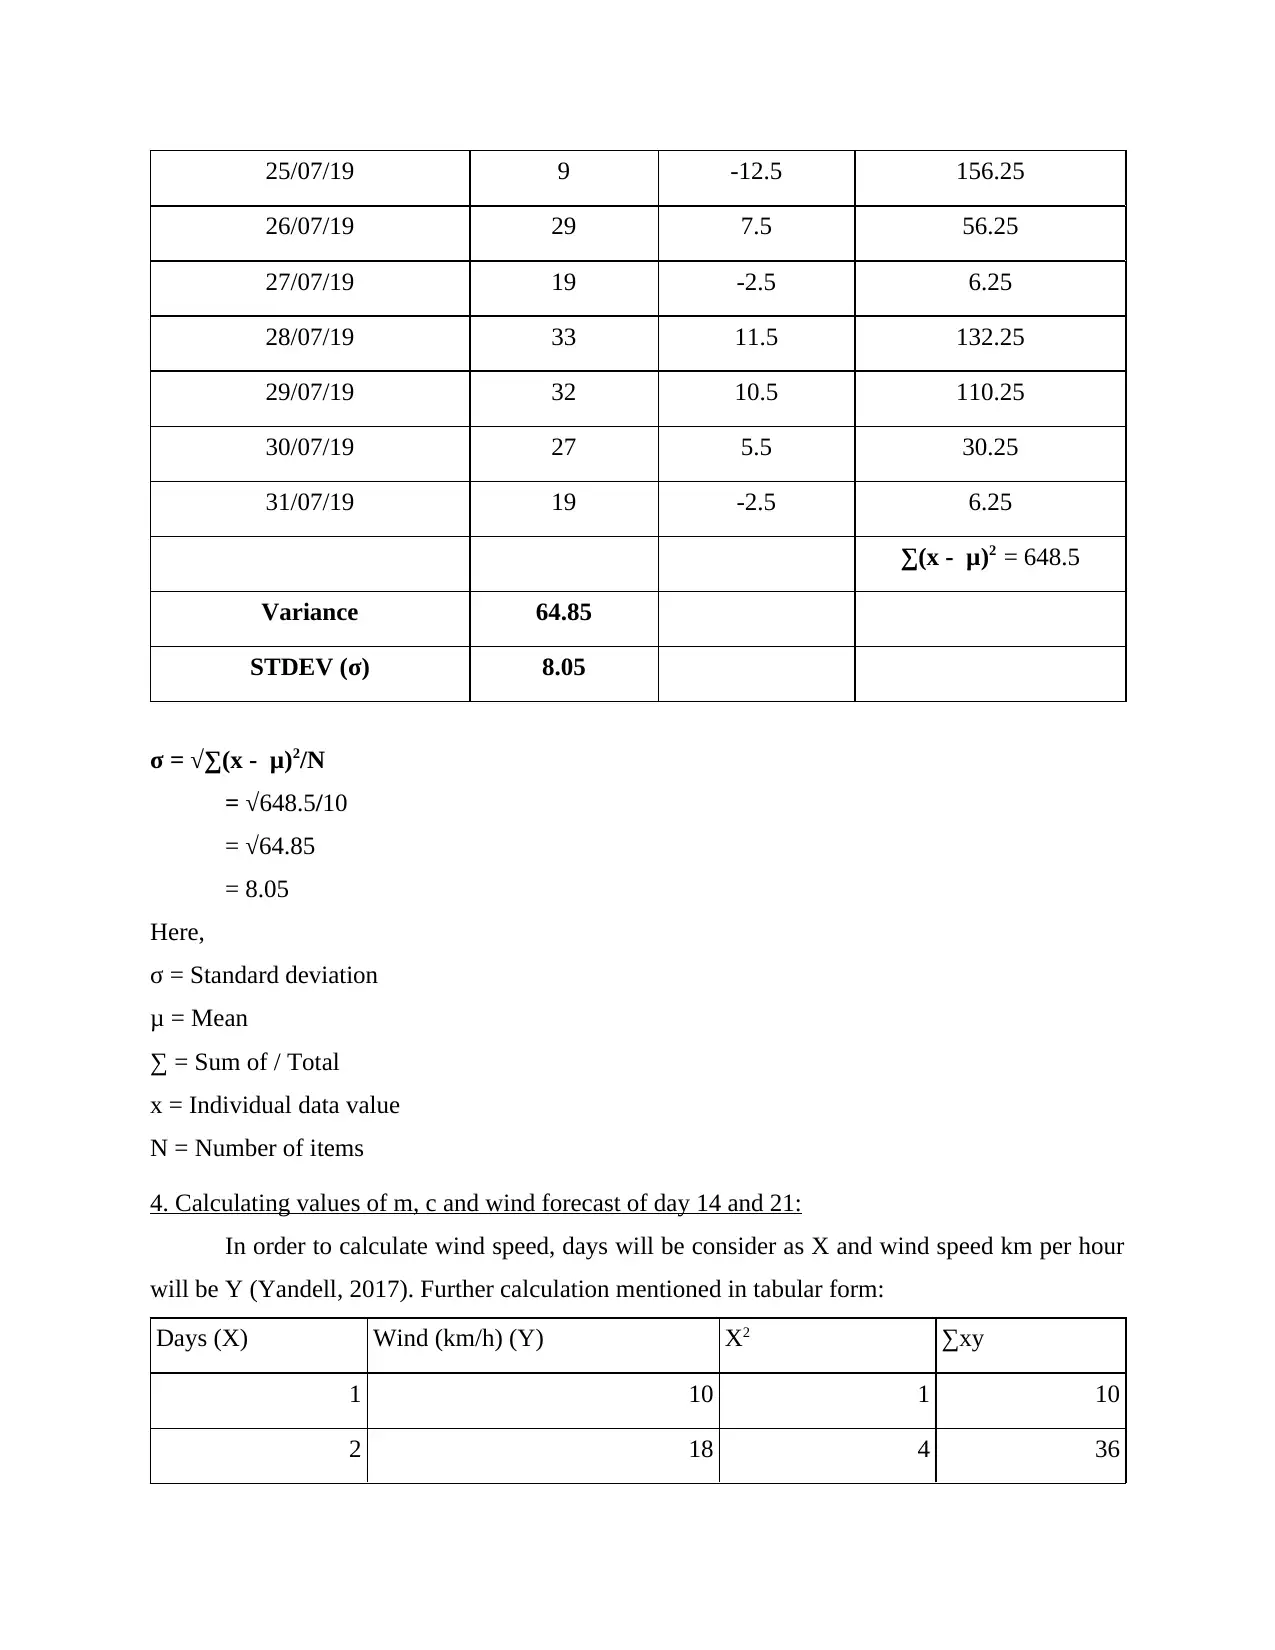
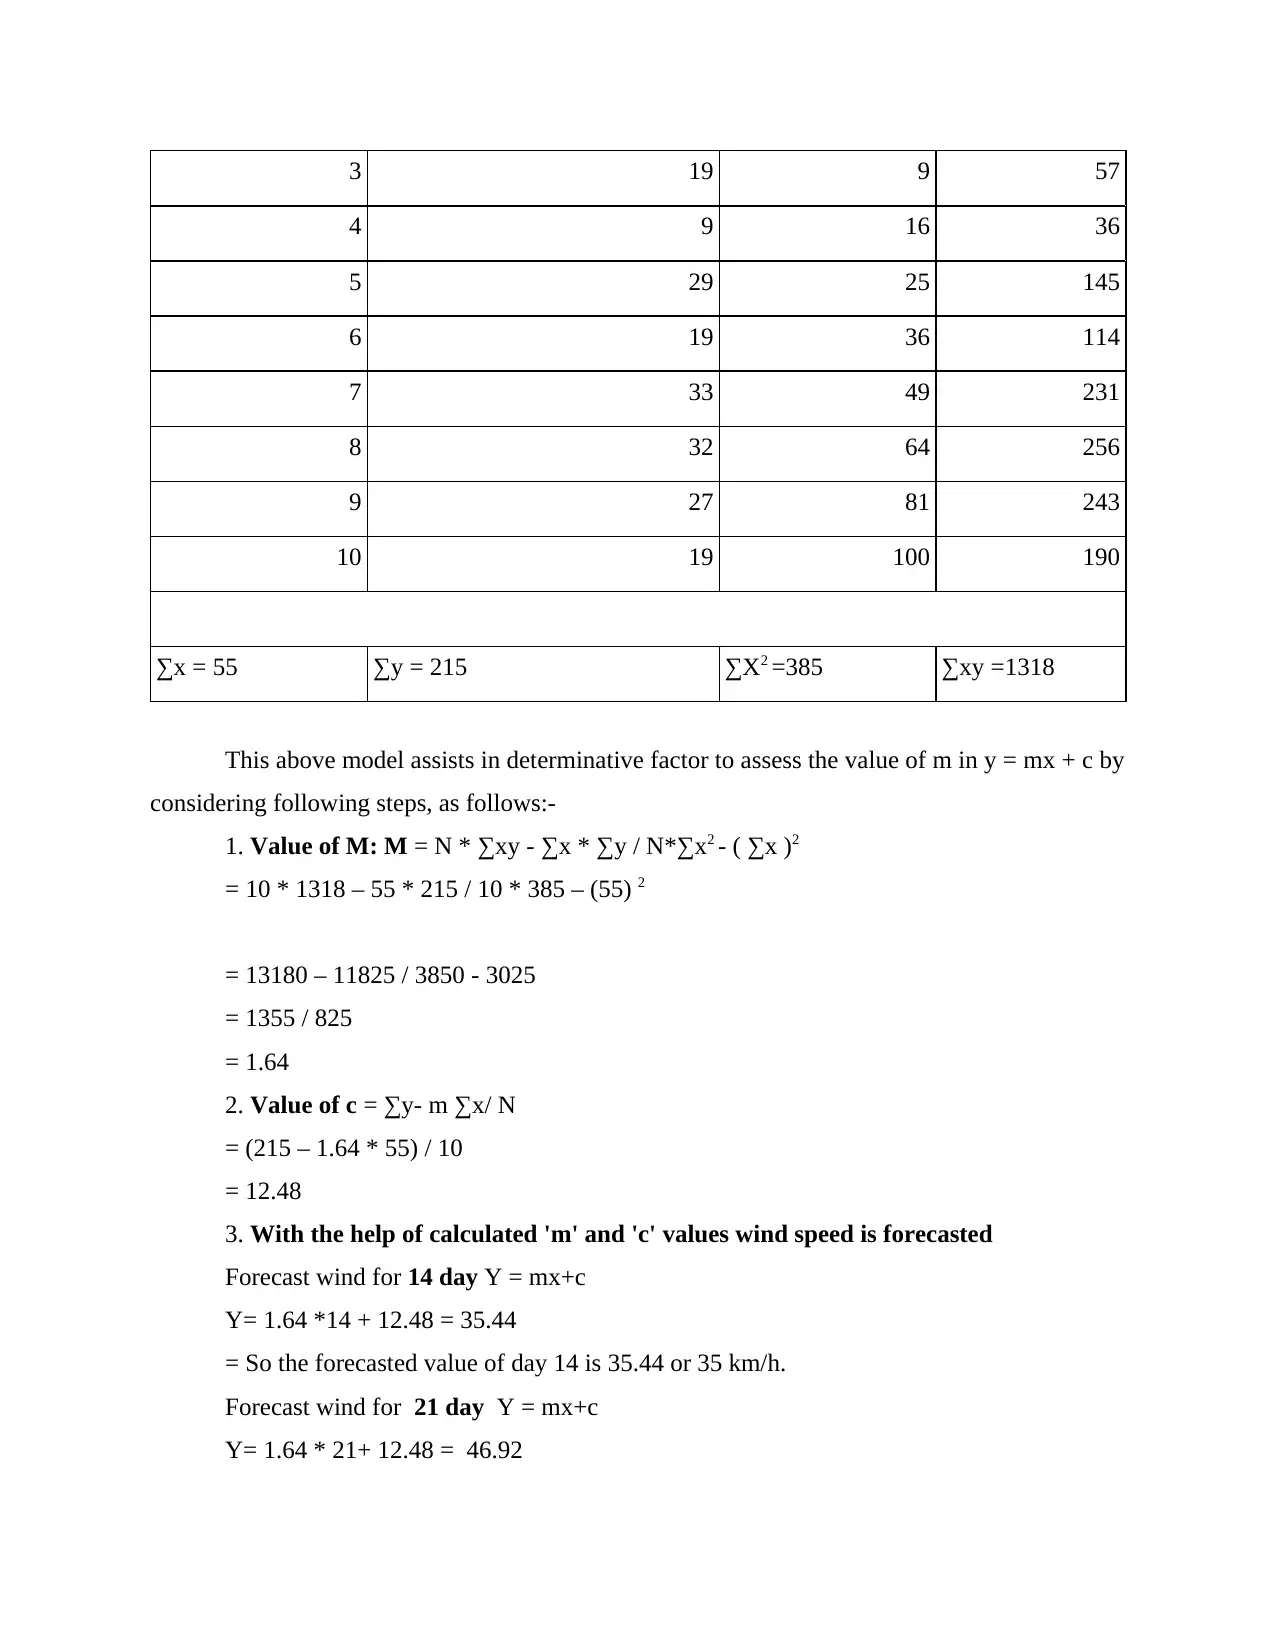
This report presents a comprehensive data analysis of wind speed data collected over ten days in Manchester, UK. It begins with a tabular representation of the data, followed by data visualization using bar and column charts. The core of the report focuses on calculating key statistical measures, including mean, median, mode, range, and standard deviation. The calculations are presented step-by-step, providing clear explanations. Furthermore, the report employs a forecasting model to predict wind speeds for days 14 and 21, detailing the calculations of 'm' and 'c' values used in the forecast. The conclusion summarizes the importance of data analysis in effective decision-making and problem-solving. The report uses various sources to support its findings.

Numeracy and Data
Analysis
Analysis
Paraphrase This Document
Need a fresh take? Get an instant paraphrase of this document with our AI Paraphraser

Table of Contents
INTRODUCTION...........................................................................................................................3
MAIN BODY...................................................................................................................................3
1. Representation of data in tabular form:...................................................................................3
2. Data representation in charts:...................................................................................................4
3. Calculations of mean, median, mode, standard deviation and range:......................................5
4. Calculating values of m, c and wind forecast of day 14 and 21:.............................................7
CONCLUSION................................................................................................................................8
REFERENCES................................................................................................................................9

INTRODUCTION
Data analysis is a wider term which is concerned with use of statistical tools and methods
for detailed analysis of unstructured information or data. Data-analysis techniques are used by
analysts to enhance the quality and relevance of data according to different users (Isojima and
et,al., 2016). This assessment contains descriptive analysis of data related to wind-speed. Along
with this, it includes the analysis of mean, median, mode, range, standard deviation and
determine value of c or m by using forecasting model. In addition, this report represent wind
speed data with the help of charts such as Bar or Column graph.
MAIN BODY
1. Representation of data in tabular form:
Here below is tabular representation of selected data related to wind speed during 10
consecutive days in time period of 6:00 to 12:00 in Manchester, England, UK (Wind speed of
Manchester. 2019), as shown below:
Time: 12:00 — 18:00
Date Wind (km/h)
22/07/19 10
23/07/19 18
24/07/19 19
25/07/19 9
26/07/19 29
27/07/19 19
28/07/19 33
29/07/19 32
30/07/19 27
31/07/19 19
⊘ This is a preview!⊘
Do you want full access?
Subscribe today to unlock all pages.

Trusted by 1+ million students worldwide

Paraphrase This Document
Need a fresh take? Get an instant paraphrase of this document with our AI Paraphraser

2. Data representation in charts:
Bar Graph:
Column Chart:
22/07/2019
23/07/2019
24/07/2019
25/07/2019
26/07/2019
27/07/2019
28/07/2019
29/07/2019
30/07/2019
31/07/2019
0 5 10 15 20 25 30 35
Wind (km/h)
22/07/2019
23/07/2019
24/07/2019
25/07/2019
26/07/2019
27/07/2019
28/07/2019
29/07/2019
30/07/2019
31/07/2019
0
5
10
15
20
25
30
35
Wind (km/h)

3. Calculations of mean, median, mode, standard deviation and range:
Days Wind (km/h)
1 10
2 18
3 19
4 9
5 29
6 19
7 33
8 32
9 27
10 19
215
Mean 21.5
Median 19
Mode 19
Range 24
Maximum 33
Minimum 9
Mean: It is the average value of all the observation of given data where sum of total
values by total observation (Joustra and et.al., 2015). For example: if sum of all values are 100
and total sample size is 10 then mean will be 10 for it. It is also called central value of a set of
numbers. Steps to calculate it are as follows:
Formula of mean:
μ = ∑ x/ N
= 215 / 10
= 21.5
Here,
μ = Mean
⊘ This is a preview!⊘
Do you want full access?
Subscribe today to unlock all pages.

Trusted by 1+ million students worldwide

∑ = Sum of / Total
x = Individual data value
N = Number of items
Mode: Mostly appeared value in the range of data called mode. If any observation, no
single value repeated then it will called no mode in the available range of data. for it. Following
steps are required to be followed as:
Mode of Wind speed of 10 days are 19.
Median: Central or middle value of available data range and it helps in separated range
in two different parts, first is upper one and second is lower one. In another case, it will be
calculating through adding one and then dived with 2. Steps of calculating median are as follow:
Formula of median:
Where data series is odd= ( N +1 ) / 2
Where data series is even= ( N / 2)
= ( 10+1 ) / 2
= 5.5 observation
Median = 19
Range: It is the difference between high or low value of the given data which is called
range and its calculation mention below:
Formula of range:
Max – Min
= 33 - 9
= 24
Standard deviation: It is the measurement of variation or dispersion which include set
of relative calculation (Shoro and Soomro, 2015). Standard deviation indicate the value which is
near by mean and indicate those values which are separated from the wide range. It will be
calculated with the help of available information:
Dates Wind (km/h) x - μ (x - μ)2
22/07/19 10 -11.5 132.25
23/07/19 18 -3.5 12.25
24/07/19 19 -2.5 6.25
Paraphrase This Document
Need a fresh take? Get an instant paraphrase of this document with our AI Paraphraser

25/07/19 9 -12.5 156.25
26/07/19 29 7.5 56.25
27/07/19 19 -2.5 6.25
28/07/19 33 11.5 132.25
29/07/19 32 10.5 110.25
30/07/19 27 5.5 30.25
31/07/19 19 -2.5 6.25
∑(x - μ)2 = 648.5
Variance 64.85
STDEV (σ) 8.05
σ = √∑(x - μ)2/N
= √648.5/10
= √64.85
= 8.05
Here,
σ = Standard deviation
μ = Mean
∑ = Sum of / Total
x = Individual data value
N = Number of items
4. Calculating values of m, c and wind forecast of day 14 and 21:
In order to calculate wind speed, days will be consider as X and wind speed km per hour
will be Y (Yandell, 2017). Further calculation mentioned in tabular form:
Days (X) Wind (km/h) (Y) X2 ∑xy
1 10 1 10
2 18 4 36

3 19 9 57
4 9 16 36
5 29 25 145
6 19 36 114
7 33 49 231
8 32 64 256
9 27 81 243
10 19 100 190
∑x = 55 ∑y = 215 ∑X2 =385 ∑xy =1318
This above model assists in determinative factor to assess the value of m in y = mx + c by
considering following steps, as follows:-
1. Value of M: M = N * ∑xy - ∑x * ∑y / N*∑x2 - ( ∑x )2
= 10 * 1318 – 55 * 215 / 10 * 385 – (55) 2
= 13180 – 11825 / 3850 - 3025
= 1355 / 825
= 1.64
2. Value of c = ∑y- m ∑x/ N
= (215 – 1.64 * 55) / 10
= 12.48
3. With the help of calculated 'm' and 'c' values wind speed is forecasted
Forecast wind for 14 day Y = mx+c
Y= 1.64 *14 + 12.48 = 35.44
= So the forecasted value of day 14 is 35.44 or 35 km/h.
Forecast wind for 21 day Y = mx+c
Y= 1.64 * 21+ 12.48 = 46.92
⊘ This is a preview!⊘
Do you want full access?
Subscribe today to unlock all pages.

Trusted by 1+ million students worldwide
1 out of 9
Related Documents

Your All-in-One AI-Powered Toolkit for Academic Success.
+13062052269
info@desklib.com
Available 24*7 on WhatsApp / Email
Unlock your academic potential
Copyright © 2020–2025 A2Z Services. All Rights Reserved. Developed and managed by ZUCOL.