Comprehensive Financial Analysis: Marks & Spencer vs. Sainsbury's
VerifiedAdded on 2019/09/19
|18
|3659
|648
Report
AI Summary
This report provides a detailed financial analysis comparing Marks & Spencer (M&S) and Sainsbury's, two leading companies in the food industry. The analysis employs both horizontal and vertical methods, examining financial data from the last three years (2014-2016). Horizontal analysis highlights the growth trends of different accounts over time, while vertical analysis presents each balance sheet element as a percentage of the total. The report includes an assessment of assets, liabilities, share price movements, and key financial ratios such as current ratio, liquid ratio, gross profit ratio, and earnings per share (EPS). Additionally, the analysis explores company performance, including market share, retail sales, and the impact of strategic initiatives. The report concludes with recommendations for both companies to improve their financial performance, particularly by expanding their market share internationally and leveraging online platforms.
Financial Analysis
Marks and Spencer and Sainsbury’s
Financial Analysis of the Marks and Spencer and Sainsburys are both the leading company in
Food Industry. Though they have various other chains but the Food industry is one the most
caliber product for the company. So, for the better analysis of the Financial Position of both the
company, the analysis has been done by both methods, Horizontal Basis and Vertical Analysis.
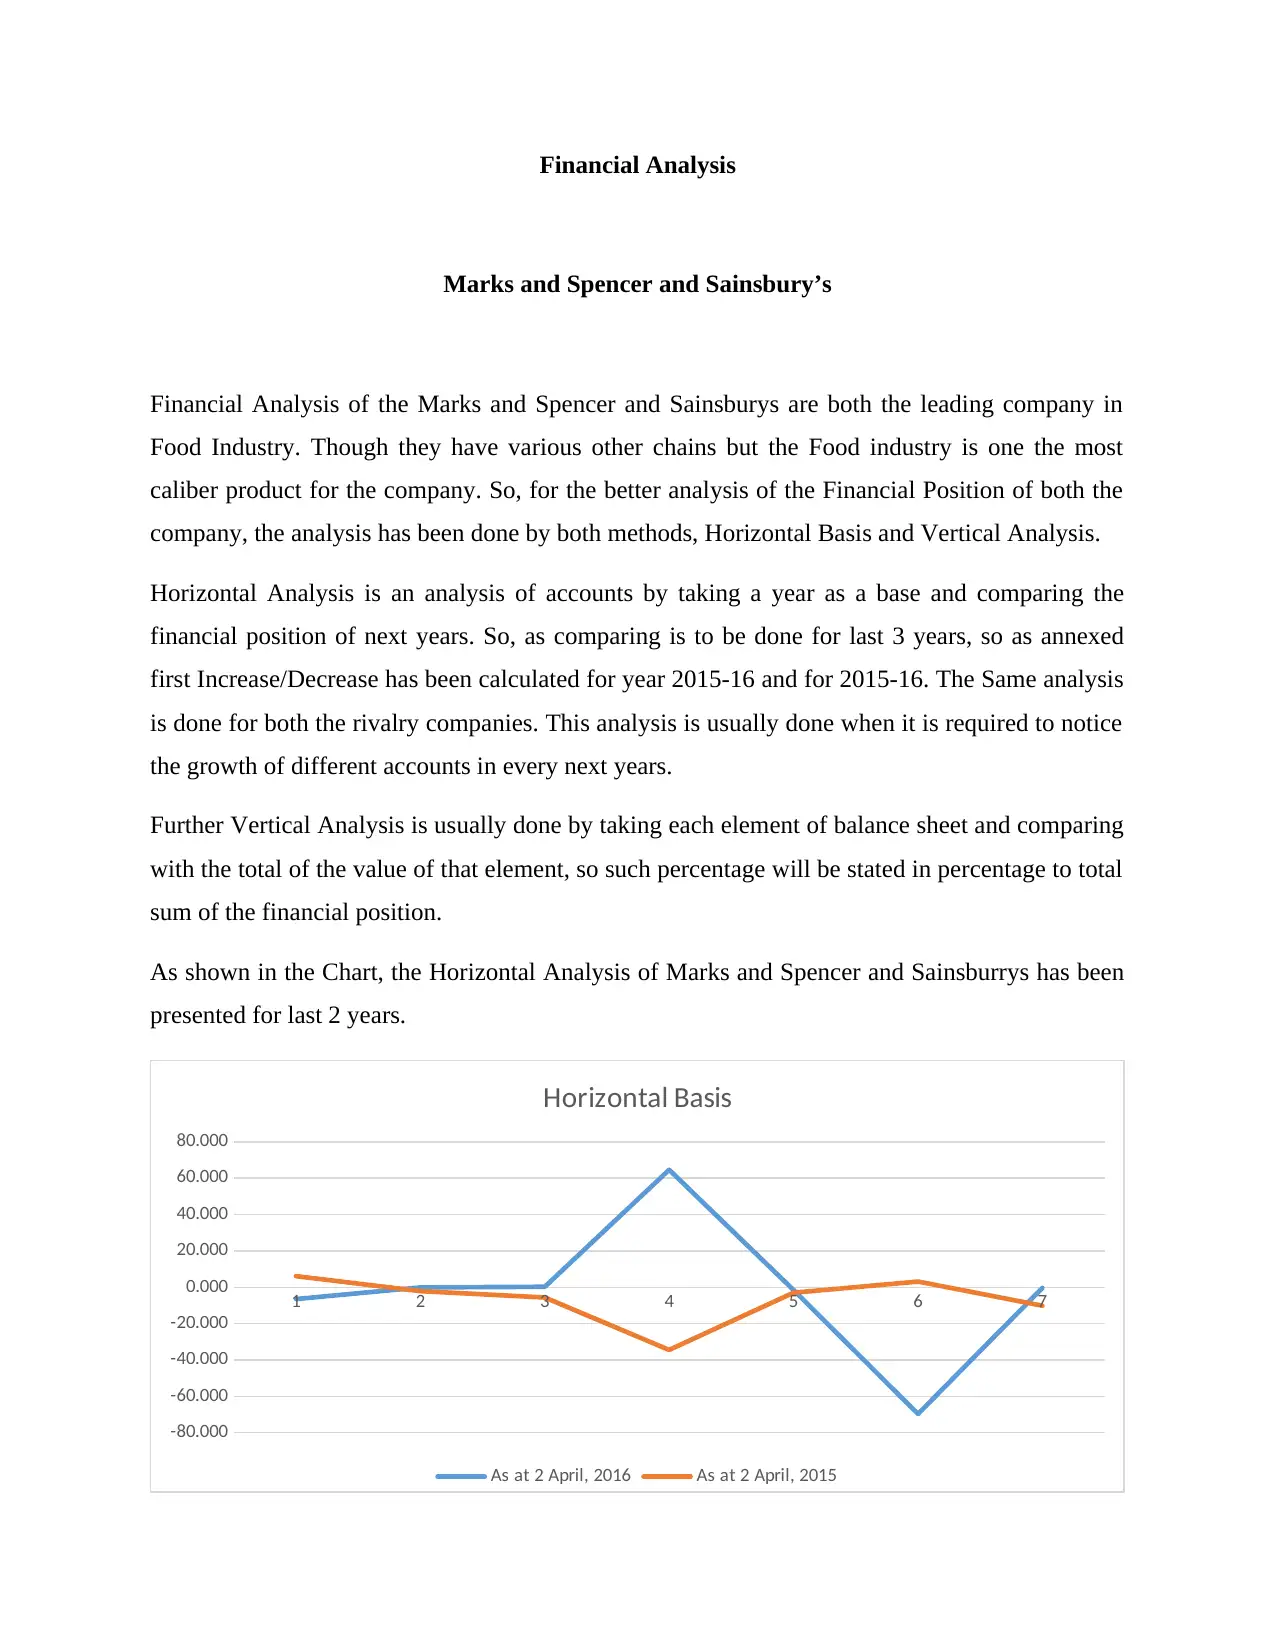
Horizontal Analysis is an analysis of accounts by taking a year as a base and comparing the
financial position of next years. So, as comparing is to be done for last 3 years, so as annexed
first Increase/Decrease has been calculated for year 2015-16 and for 2015-16. The Same analysis
is done for both the rivalry companies. This analysis is usually done when it is required to notice
the growth of different accounts in every next years.
Further Vertical Analysis is usually done by taking each element of balance sheet and comparing
with the total of the value of that element, so such percentage will be stated in percentage to total
sum of the financial position.
As shown in the Chart, the Horizontal Analysis of Marks and Spencer and Sainsburrys has been
presented for last 2 years.
1 2 3 4 5 6 7
-80.000
-60.000
-40.000
-20.000
0.000
20.000
40.000
60.000
80.000
Horizontal Basis
As at 2 April, 2016 As at 2 April, 2015
Marks and Spencer and Sainsbury’s
Financial Analysis of the Marks and Spencer and Sainsburys are both the leading company in
Food Industry. Though they have various other chains but the Food industry is one the most
caliber product for the company. So, for the better analysis of the Financial Position of both the
company, the analysis has been done by both methods, Horizontal Basis and Vertical Analysis.
Horizontal Analysis is an analysis of accounts by taking a year as a base and comparing the
financial position of next years. So, as comparing is to be done for last 3 years, so as annexed
first Increase/Decrease has been calculated for year 2015-16 and for 2015-16. The Same analysis
is done for both the rivalry companies. This analysis is usually done when it is required to notice
the growth of different accounts in every next years.
Further Vertical Analysis is usually done by taking each element of balance sheet and comparing
with the total of the value of that element, so such percentage will be stated in percentage to total
sum of the financial position.
As shown in the Chart, the Horizontal Analysis of Marks and Spencer and Sainsburrys has been
presented for last 2 years.
1 2 3 4 5 6 7
-80.000
-60.000
-40.000
-20.000
0.000
20.000
40.000
60.000
80.000
Horizontal Basis
As at 2 April, 2016 As at 2 April, 2015
Paraphrase This Document
Need a fresh take? Get an instant paraphrase of this document with our AI Paraphraser
1 2 3 4 5 6 7 8
-50.000
0.000
50.000
100.000
150.000
200.000
Horizontal Analysis of Sainsburry
As at 2 April, 2016 As at 2 April, 2015
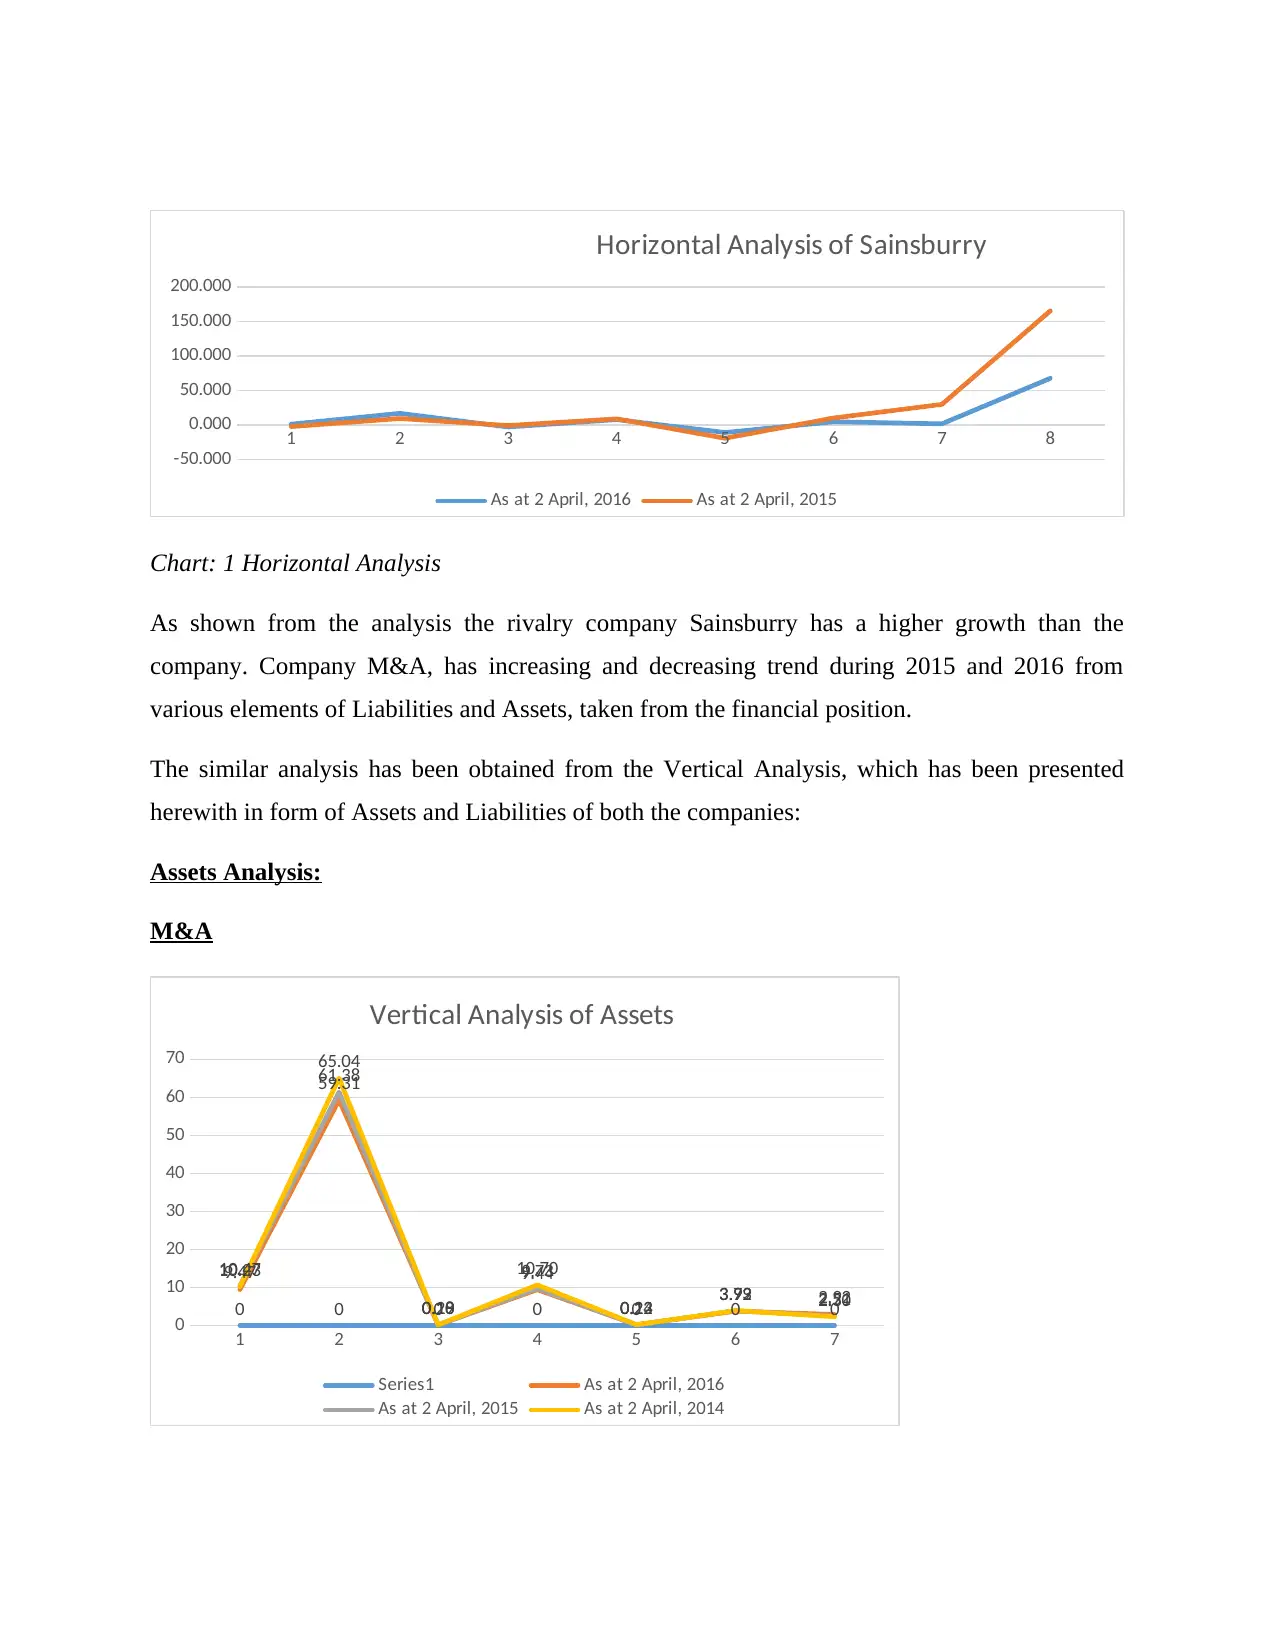
Chart: 1 Horizontal Analysis
As shown from the analysis the rivalry company Sainsburry has a higher growth than the
company. Company M&A, has increasing and decreasing trend during 2015 and 2016 from
various elements of Liabilities and Assets, taken from the financial position.
The similar analysis has been obtained from the Vertical Analysis, which has been presented
herewith in form of Assets and Liabilities of both the companies:
Assets Analysis:
M&A
1 2 3 4 5 6 7
0
10
20
30
40
50
60
70
0 0 0 0 0 0 0
9.47
59.31
0.18
9.44
0.23 3.79 2.92
10.47
61.38
0.19
9.73
0.14 3.93 2.51
10.23
65.04
0.20
10.70
0.22 3.92 2.30
Vertical Analysis of Assets
Series1 As at 2 April, 2016
As at 2 April, 2015 As at 2 April, 2014
-50.000
0.000
50.000
100.000
150.000
200.000
Horizontal Analysis of Sainsburry
As at 2 April, 2016 As at 2 April, 2015
Chart: 1 Horizontal Analysis
As shown from the analysis the rivalry company Sainsburry has a higher growth than the
company. Company M&A, has increasing and decreasing trend during 2015 and 2016 from
various elements of Liabilities and Assets, taken from the financial position.
The similar analysis has been obtained from the Vertical Analysis, which has been presented
herewith in form of Assets and Liabilities of both the companies:
Assets Analysis:
M&A
1 2 3 4 5 6 7
0
10
20
30
40
50
60
70
0 0 0 0 0 0 0
9.47
59.31
0.18
9.44
0.23 3.79 2.92
10.47
61.38
0.19
9.73
0.14 3.93 2.51
10.23
65.04
0.20
10.70
0.22 3.92 2.30
Vertical Analysis of Assets
Series1 As at 2 April, 2016
As at 2 April, 2015 As at 2 April, 2014
Sainsbury’s
1 2 3 4 5
0.00
10.00
20.00
30.00
40.00
50.00
60.00
70.00
Assets Vertical Chart
As at 2 April, 2016 As at 2 April, 2015 As at 2 April, 2014
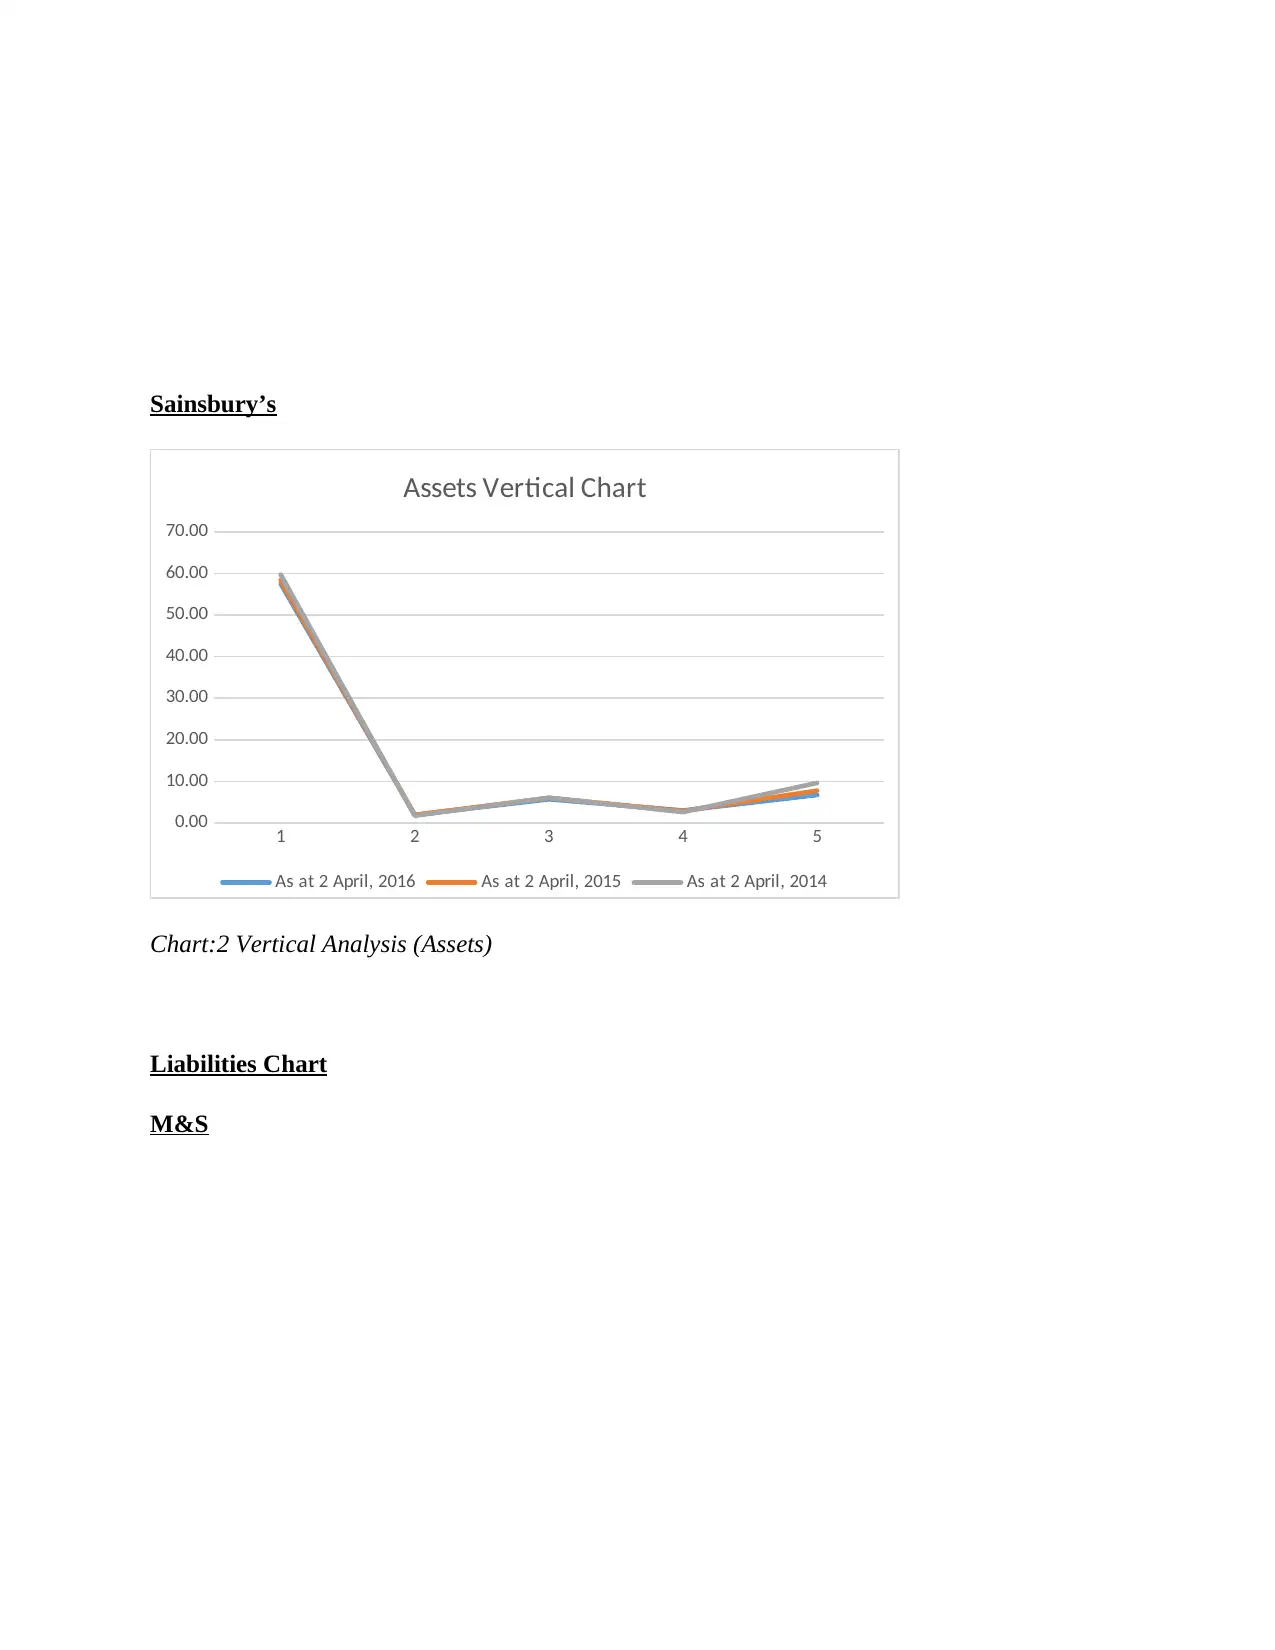
Chart:2 Vertical Analysis (Assets)
Liabilities Chart
M&S
1 2 3 4 5
0.00
10.00
20.00
30.00
40.00
50.00
60.00
70.00
Assets Vertical Chart
As at 2 April, 2016 As at 2 April, 2015 As at 2 April, 2014
Chart:2 Vertical Analysis (Assets)
Liabilities Chart
M&S
⊘ This is a preview!⊘
Do you want full access?
Subscribe today to unlock all pages.
Trusted by 1+ million students worldwide
Trade and other payables
Provision
Current tax liabilties
Trade and other payables
Provisions
Deferred tax liabilities
Equity
0.00
5.00
10.00
15.00
20.00
25.00
30.00
35.00 32.14
0.28 1.49
7.01
1.03
6.71
11.78
32.87
0.92
12.81
6.40
0.64
6.31
12.88
32.58
0.86 0.76
6.43
0.60 4.67
15.08
Vertical Analysis of Liabilties
2016 2015 2014
Sainsbury’s
1 2 3 4 5 6 7
0.00
5.00
10.00
15.00
20.00
25.00
30.00
35.00
Liability Chart Vertical Analysis
As at 2 April, 2016 As at 2 April, 2015 As at 2 April, 2014
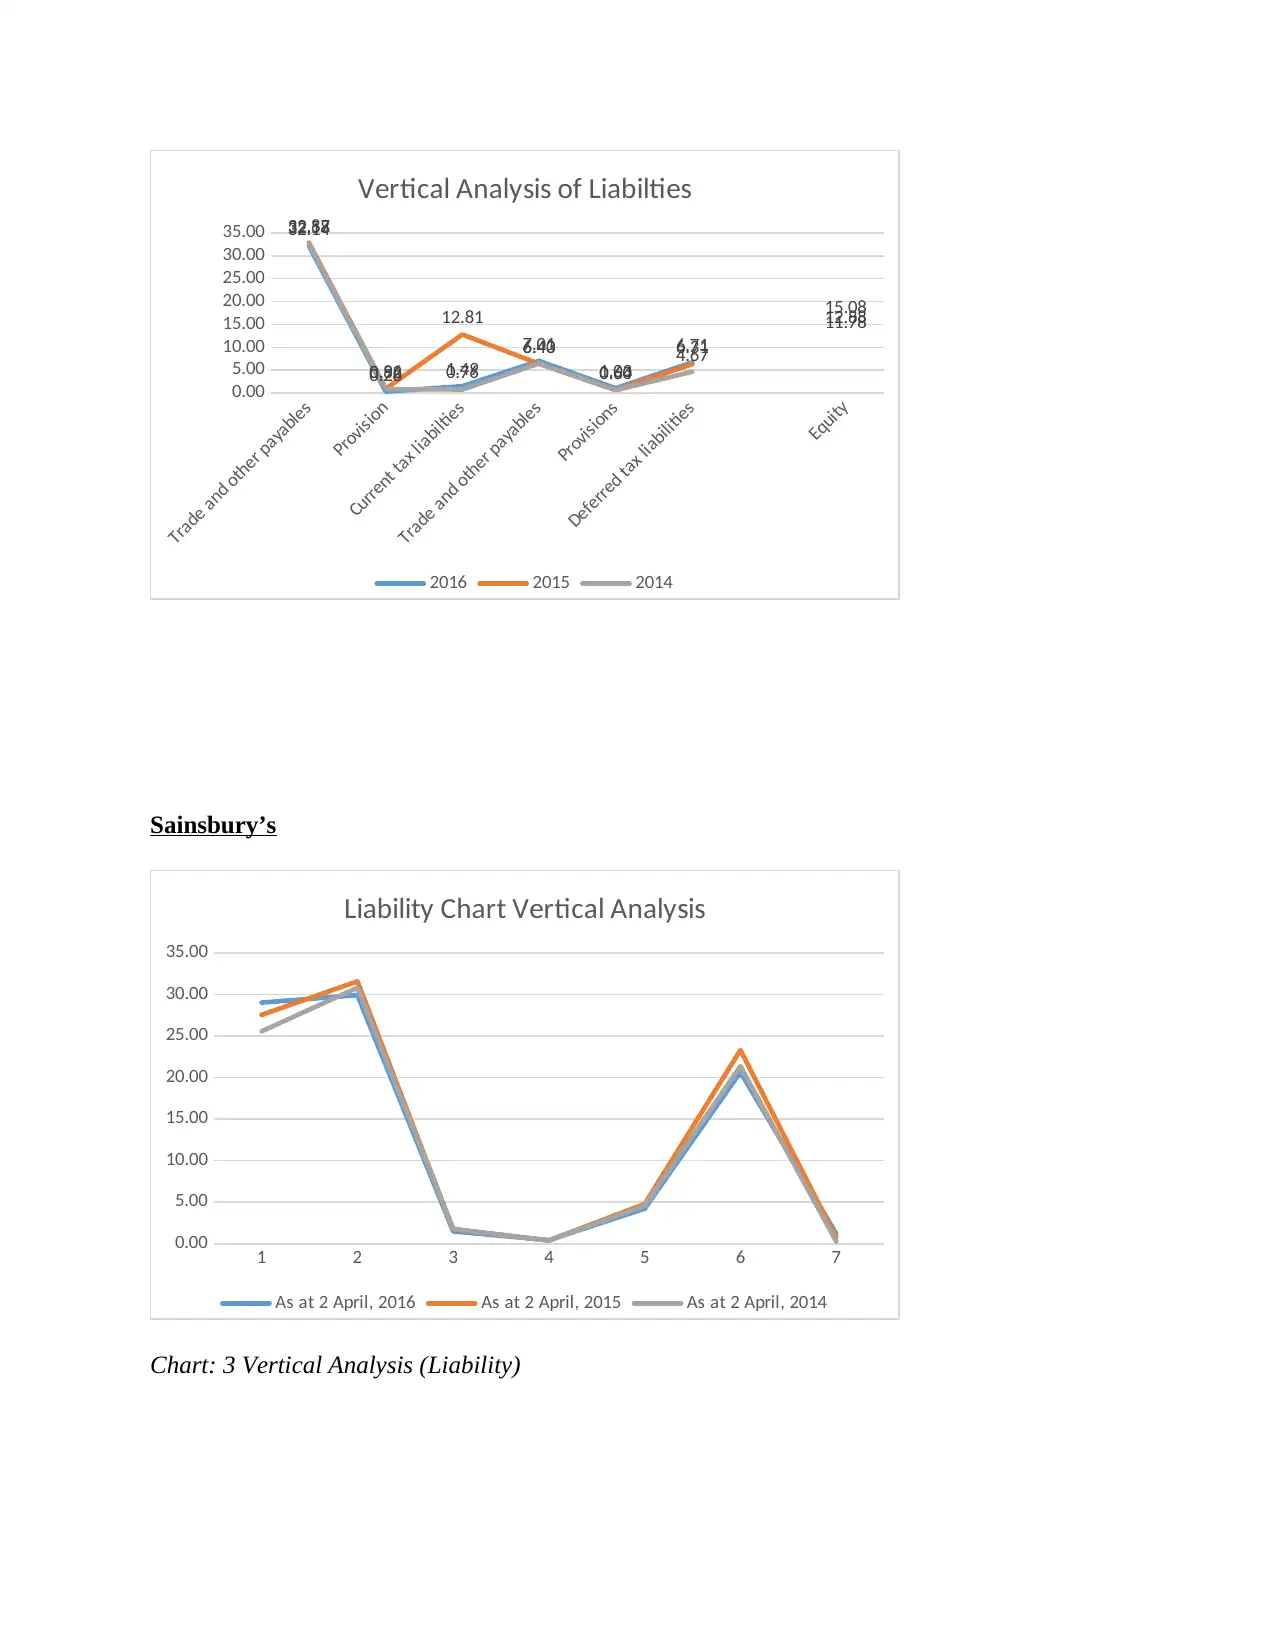
Chart: 3 Vertical Analysis (Liability)
Provision
Current tax liabilties
Trade and other payables
Provisions
Deferred tax liabilities
Equity
0.00
5.00
10.00
15.00
20.00
25.00
30.00
35.00 32.14
0.28 1.49
7.01
1.03
6.71
11.78
32.87
0.92
12.81
6.40
0.64
6.31
12.88
32.58
0.86 0.76
6.43
0.60 4.67
15.08
Vertical Analysis of Liabilties
2016 2015 2014
Sainsbury’s
1 2 3 4 5 6 7
0.00
5.00
10.00
15.00
20.00
25.00
30.00
35.00
Liability Chart Vertical Analysis
As at 2 April, 2016 As at 2 April, 2015 As at 2 April, 2014
Chart: 3 Vertical Analysis (Liability)
Paraphrase This Document
Need a fresh take? Get an instant paraphrase of this document with our AI Paraphraser
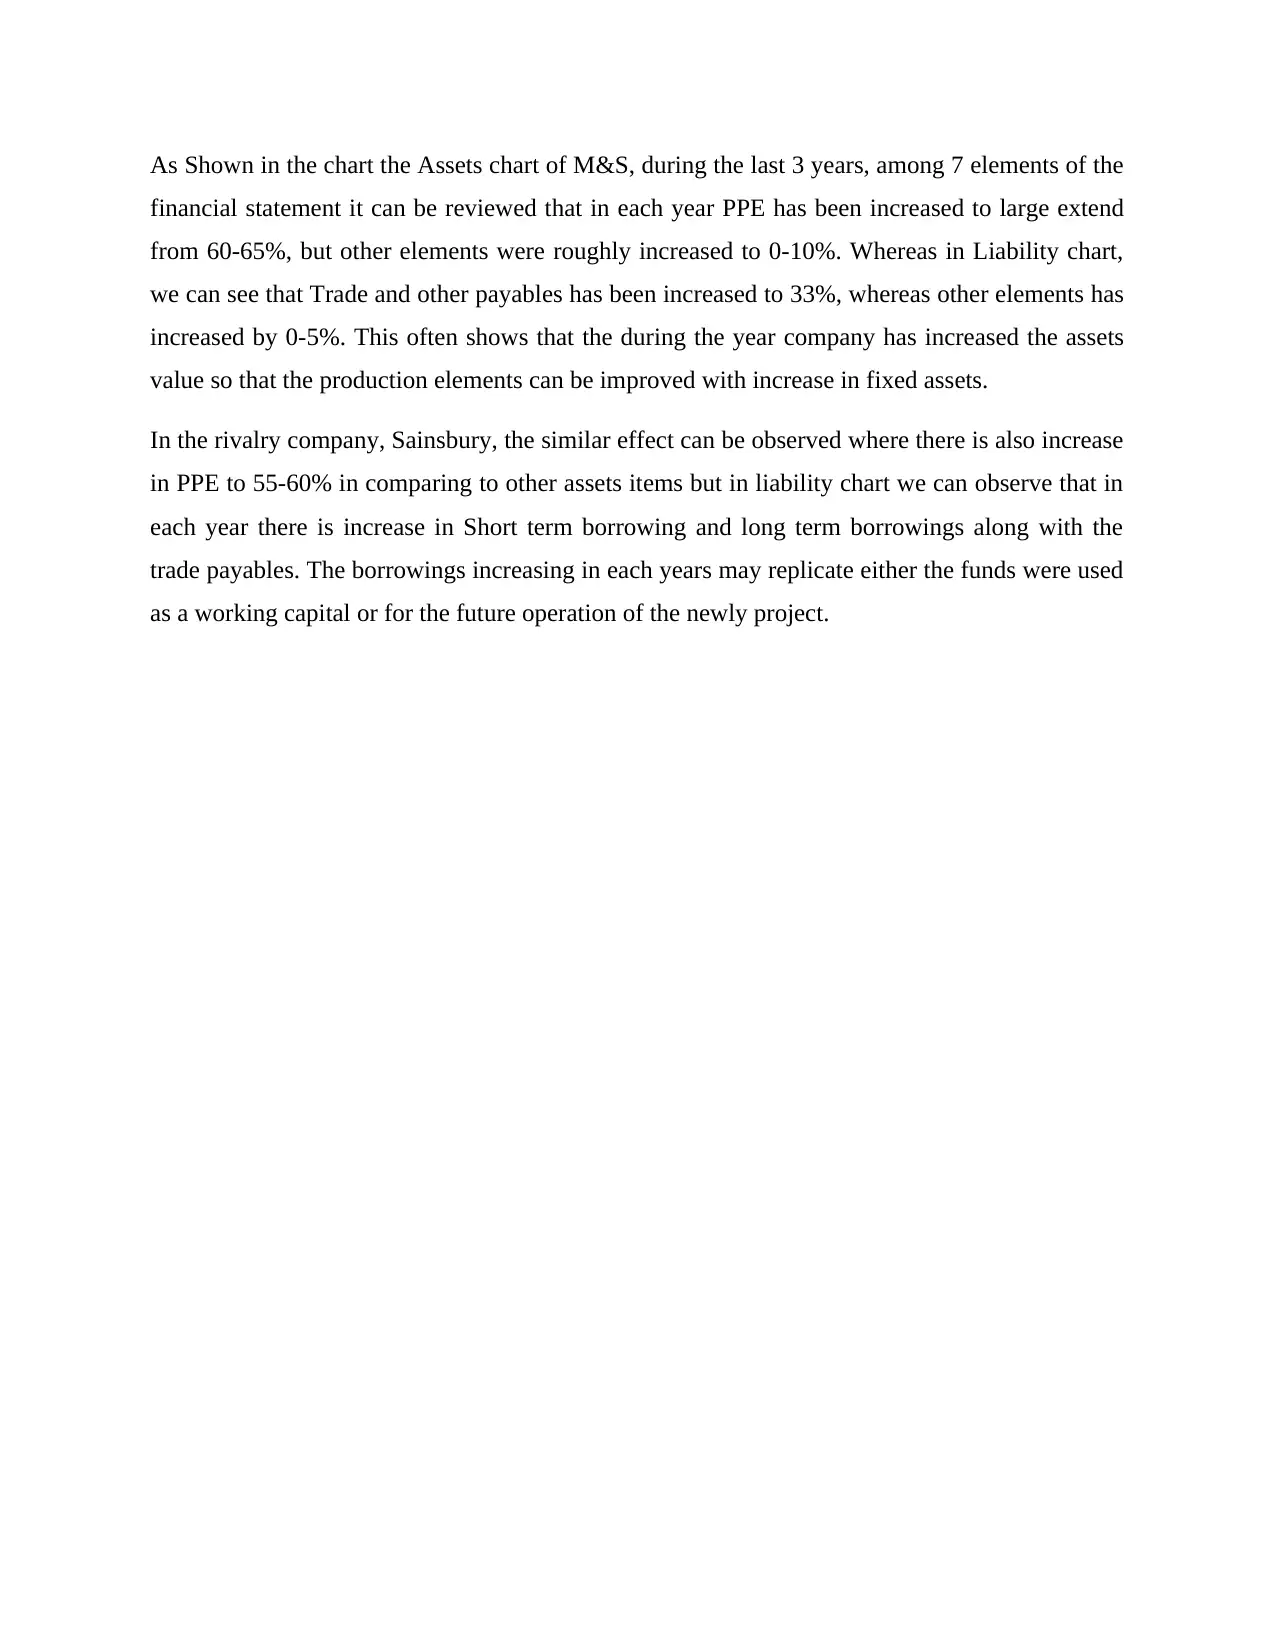
As Shown in the chart the Assets chart of M&S, during the last 3 years, among 7 elements of the
financial statement it can be reviewed that in each year PPE has been increased to large extend
from 60-65%, but other elements were roughly increased to 0-10%. Whereas in Liability chart,
we can see that Trade and other payables has been increased to 33%, whereas other elements has
increased by 0-5%. This often shows that the during the year company has increased the assets
value so that the production elements can be improved with increase in fixed assets.
In the rivalry company, Sainsbury, the similar effect can be observed where there is also increase
in PPE to 55-60% in comparing to other assets items but in liability chart we can observe that in
each year there is increase in Short term borrowing and long term borrowings along with the
trade payables. The borrowings increasing in each years may replicate either the funds were used
as a working capital or for the future operation of the newly project.
Share Price Movement
⊘ This is a preview!⊘
Do you want full access?
Subscribe today to unlock all pages.
Trusted by 1+ million students worldwide
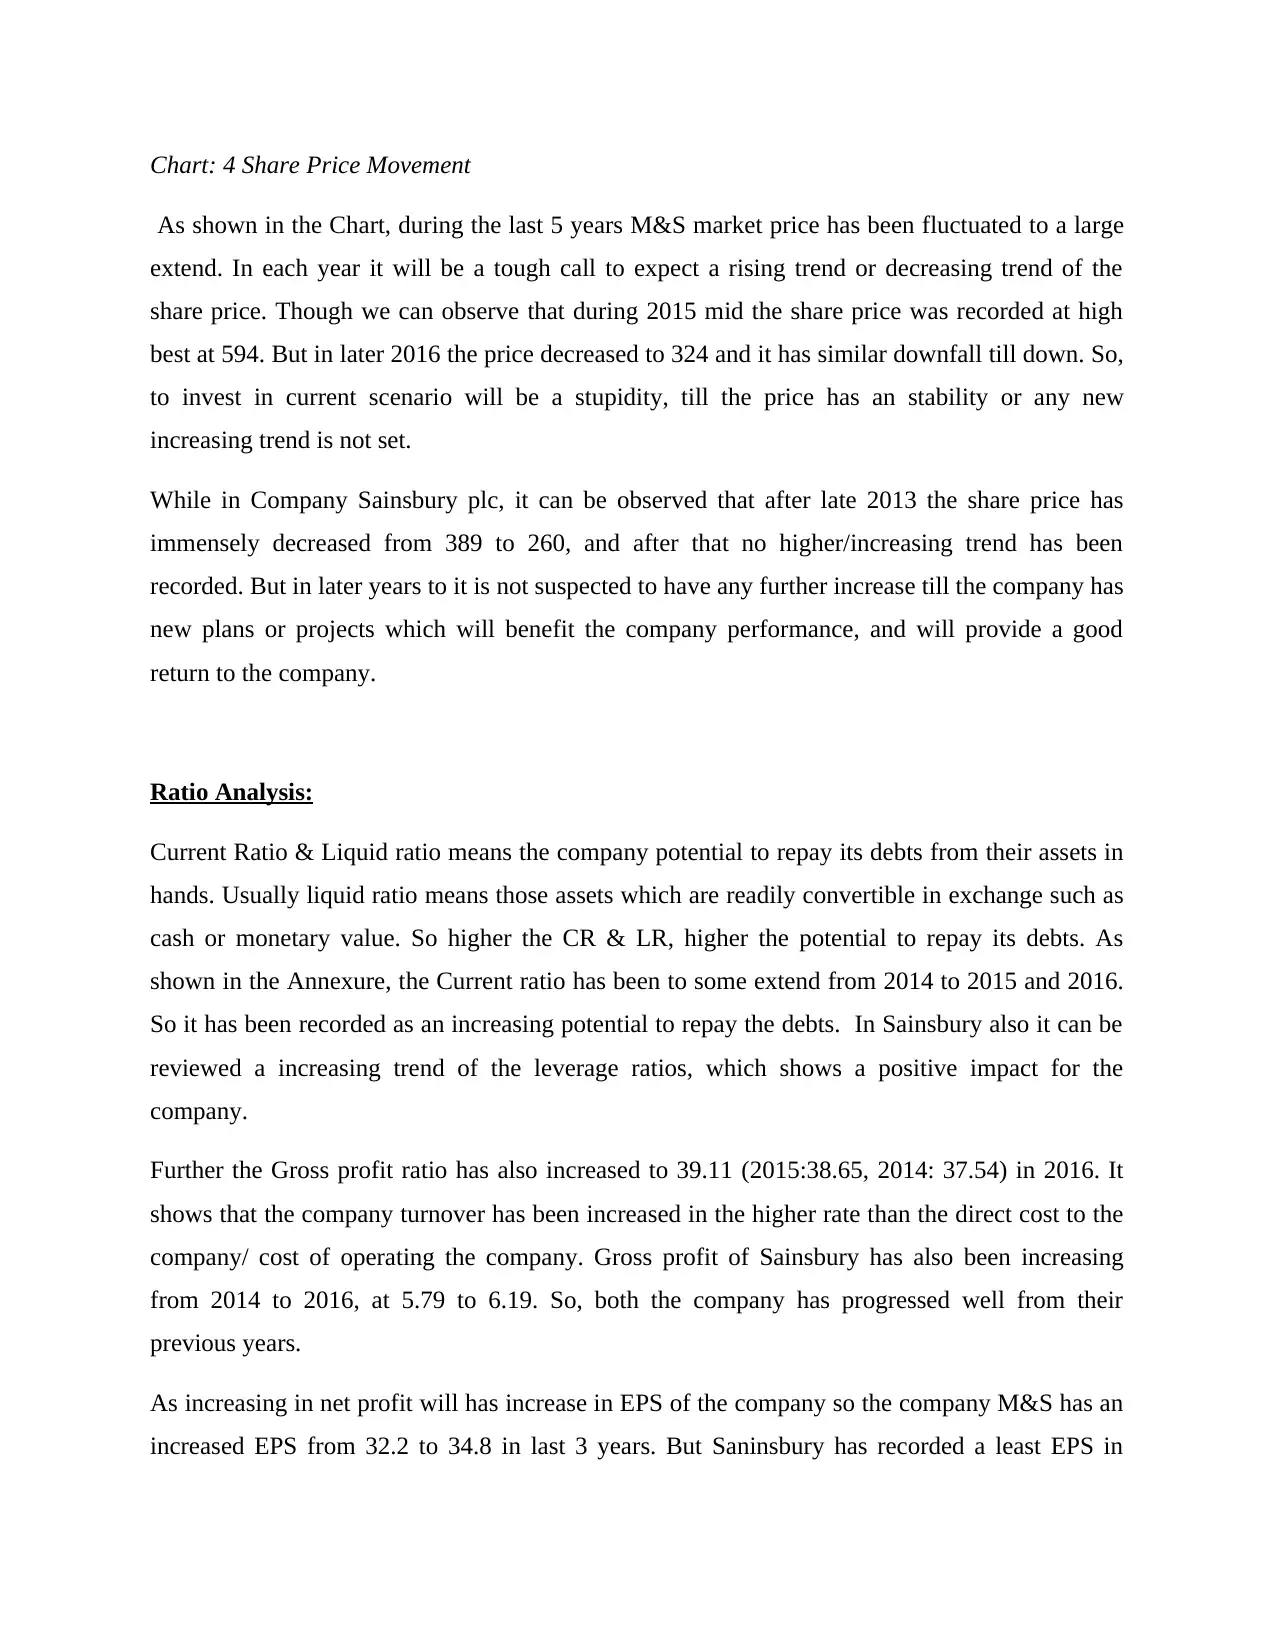
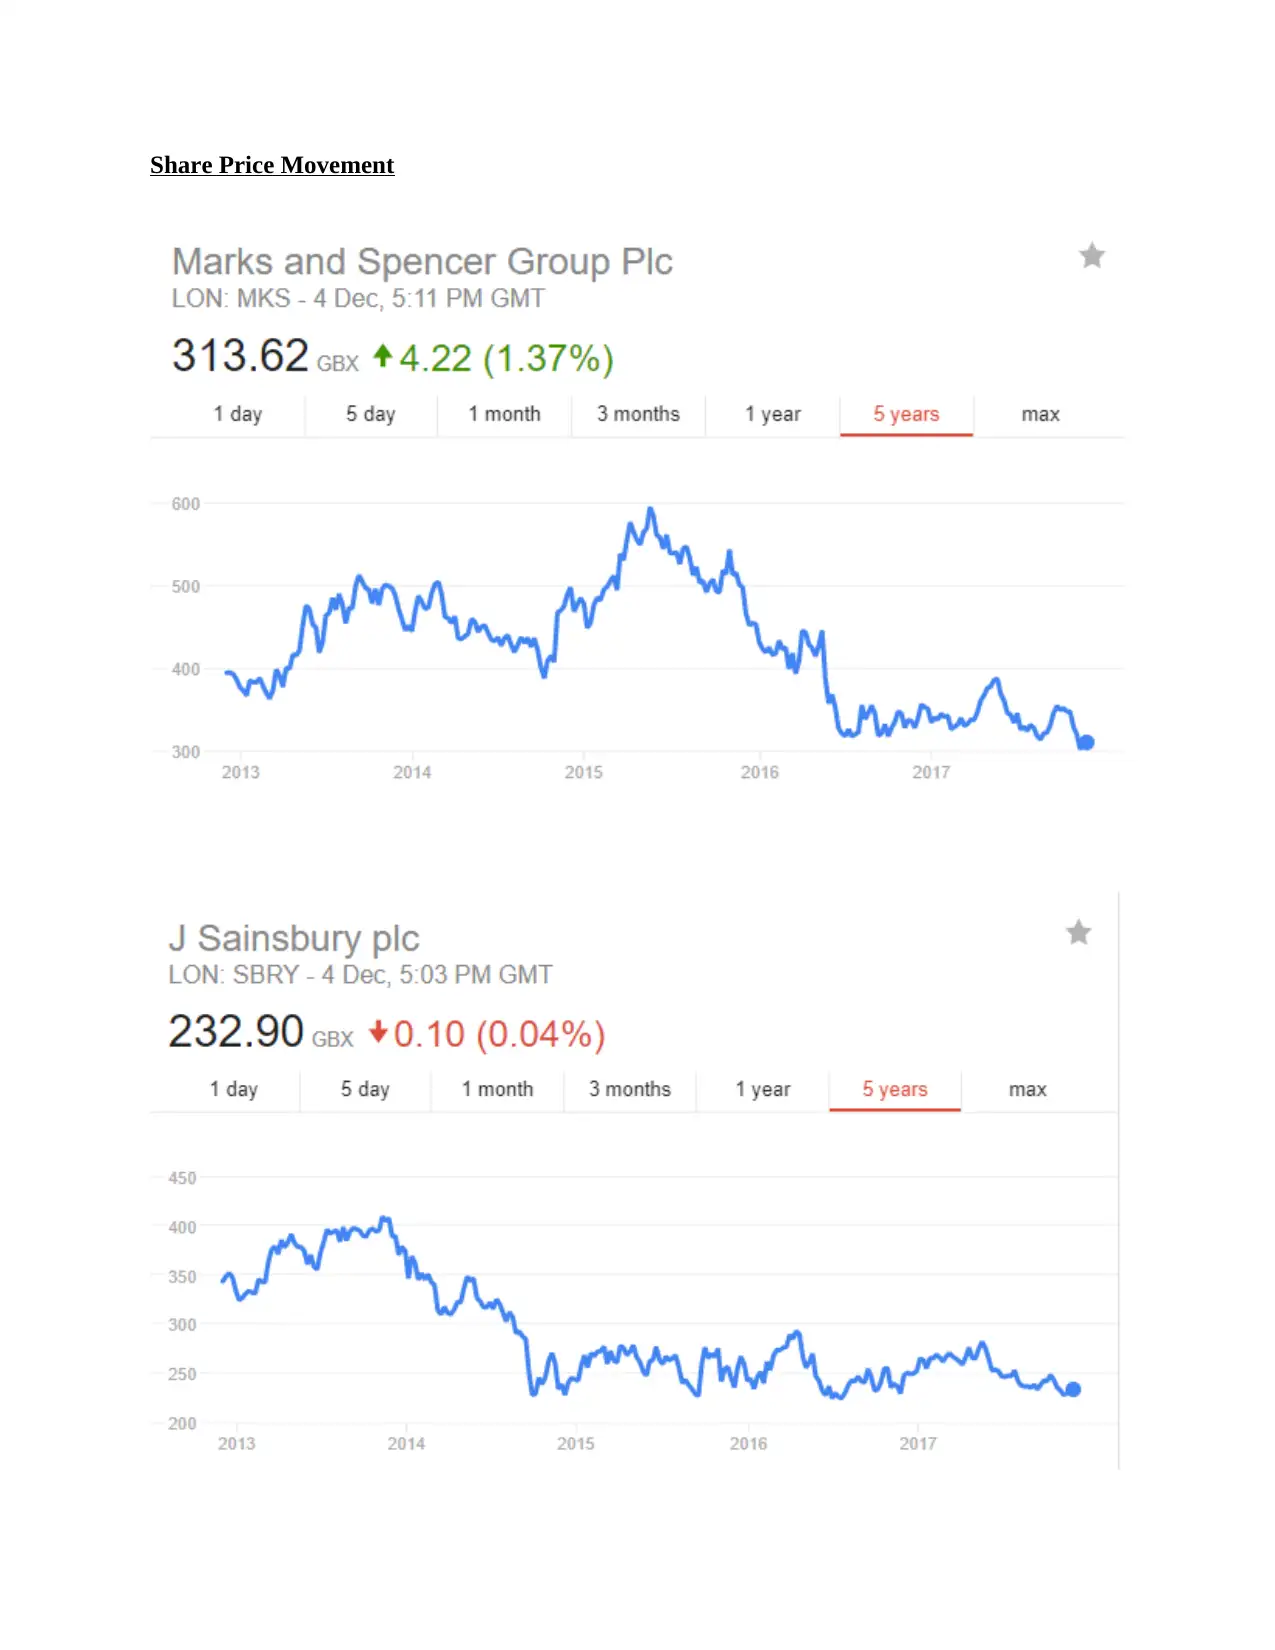
Chart: 4 Share Price Movement
As shown in the Chart, during the last 5 years M&S market price has been fluctuated to a large
extend. In each year it will be a tough call to expect a rising trend or decreasing trend of the
share price. Though we can observe that during 2015 mid the share price was recorded at high
best at 594. But in later 2016 the price decreased to 324 and it has similar downfall till down. So,
to invest in current scenario will be a stupidity, till the price has an stability or any new
increasing trend is not set.
While in Company Sainsbury plc, it can be observed that after late 2013 the share price has
immensely decreased from 389 to 260, and after that no higher/increasing trend has been
recorded. But in later years to it is not suspected to have any further increase till the company has
new plans or projects which will benefit the company performance, and will provide a good
return to the company.
Ratio Analysis:
Current Ratio & Liquid ratio means the company potential to repay its debts from their assets in
hands. Usually liquid ratio means those assets which are readily convertible in exchange such as
cash or monetary value. So higher the CR & LR, higher the potential to repay its debts. As
shown in the Annexure, the Current ratio has been to some extend from 2014 to 2015 and 2016.
So it has been recorded as an increasing potential to repay the debts. In Sainsbury also it can be
reviewed a increasing trend of the leverage ratios, which shows a positive impact for the
company.
Further the Gross profit ratio has also increased to 39.11 (2015:38.65, 2014: 37.54) in 2016. It
shows that the company turnover has been increased in the higher rate than the direct cost to the
company/ cost of operating the company. Gross profit of Sainsbury has also been increasing
from 2014 to 2016, at 5.79 to 6.19. So, both the company has progressed well from their
previous years.
As increasing in net profit will has increase in EPS of the company so the company M&S has an
increased EPS from 32.2 to 34.8 in last 3 years. But Saninsbury has recorded a least EPS in
Paraphrase This Document
Need a fresh take? Get an instant paraphrase of this document with our AI Paraphraser
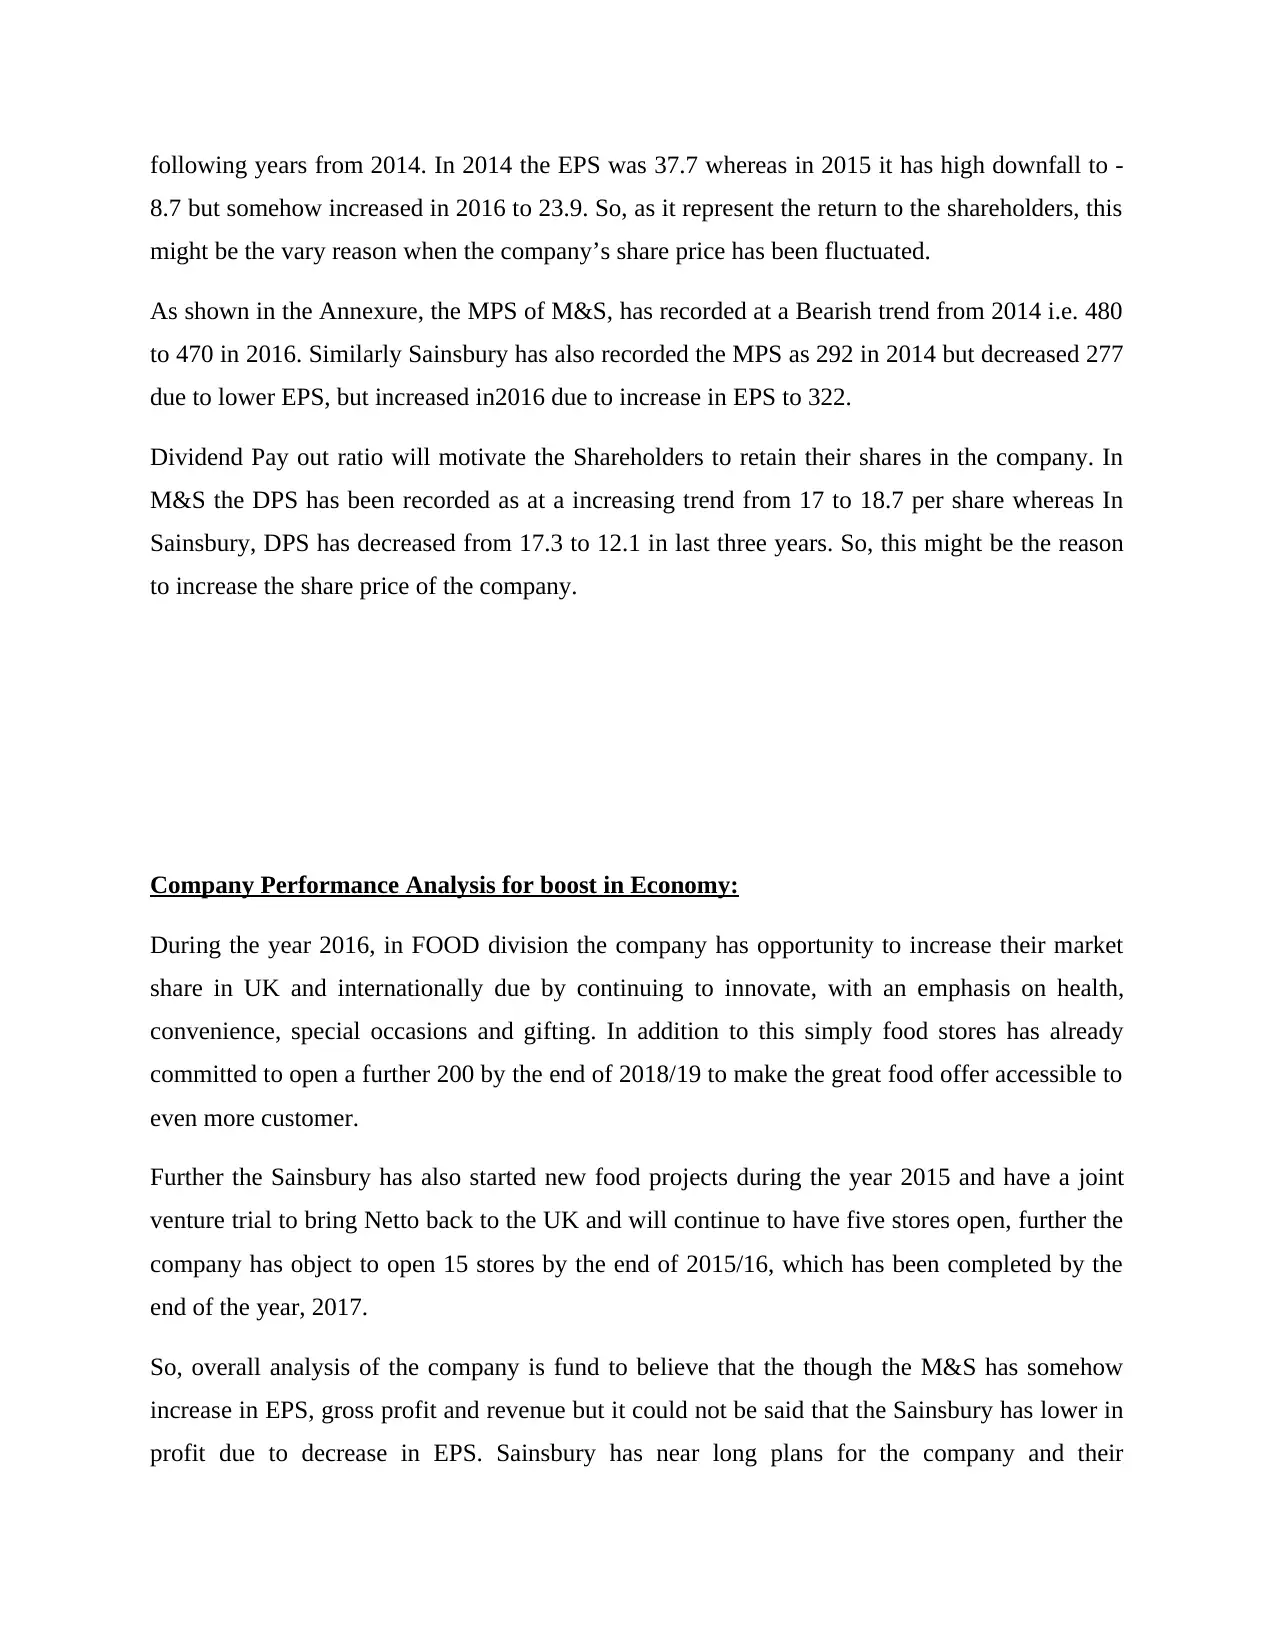
following years from 2014. In 2014 the EPS was 37.7 whereas in 2015 it has high downfall to -
8.7 but somehow increased in 2016 to 23.9. So, as it represent the return to the shareholders, this
might be the vary reason when the company’s share price has been fluctuated.
As shown in the Annexure, the MPS of M&S, has recorded at a Bearish trend from 2014 i.e. 480
to 470 in 2016. Similarly Sainsbury has also recorded the MPS as 292 in 2014 but decreased 277
due to lower EPS, but increased in2016 due to increase in EPS to 322.
Dividend Pay out ratio will motivate the Shareholders to retain their shares in the company. In
M&S the DPS has been recorded as at a increasing trend from 17 to 18.7 per share whereas In
Sainsbury, DPS has decreased from 17.3 to 12.1 in last three years. So, this might be the reason
to increase the share price of the company.
Company Performance Analysis for boost in Economy:
During the year 2016, in FOOD division the company has opportunity to increase their market
share in UK and internationally due by continuing to innovate, with an emphasis on health,
convenience, special occasions and gifting. In addition to this simply food stores has already
committed to open a further 200 by the end of 2018/19 to make the great food offer accessible to
even more customer.
Further the Sainsbury has also started new food projects during the year 2015 and have a joint
venture trial to bring Netto back to the UK and will continue to have five stores open, further the
company has object to open 15 stores by the end of 2015/16, which has been completed by the
end of the year, 2017.
So, overall analysis of the company is fund to believe that the though the M&S has somehow
increase in EPS, gross profit and revenue but it could not be said that the Sainsbury has lower in
profit due to decrease in EPS. Sainsbury has near long plans for the company and their
shareholders but the company M&S has large projects in other products also, so the FOOD
division of both the company will have a higher profit once the share market of these division
will be enhanced from UK to other international division too.
Some of the potential increase in sales is because of the service provided at store, online, at the
door or on the phone has really built customer trust and loyalty for the company. The company is
in believe that the product quality should be at the first priority rather than the price perception.
So, these strategy will help them to generate more revenue and trust in near futures. Retail sales
has also been observed as at higher point in comparing to the previous years. Board of Directors
pay attention to the frauds and internal controls in each division of the company progress, further
the audit and inspection are also been performed in regular basis so to recover the early losses
and any discrepancies in the operation of the company.
Conclusion:
After the analysis of the company’s financial performance in terms of vertical and horizontal
analysis, it can be observed that company has invested a huge capital in purchasing of PPE,
against which certain loan has been raised but mostly own profit has been used. This can also be
reviewed that rather than distributing the profit to the shareholders the company has used the
profit in the company purchasing the PPE. The different ratios were observed for the both the
companies and it has been reviewed that M&A has higher Gross profit in each three year than
the Sainsbury and even it has a positive EPS during last three years.
Recommendations:
Both the company has progressed well in the last three years but still company has to use their
resources in large extend. They have a large market in UK but in order to increase the revenue
the companies have to increase their market share in international platform as well. In such
reference company have to stablish some new stores and projects in such international platform
which will provide them nearby sale and easy for the customer based nearby. Increase in more
online platform will also leads to higher profit. The Board should be monitoring the inter-
division projects and should believe in benchmarking their products in comparing with other
companies.
⊘ This is a preview!⊘
Do you want full access?
Subscribe today to unlock all pages.
Trusted by 1+ million students worldwide
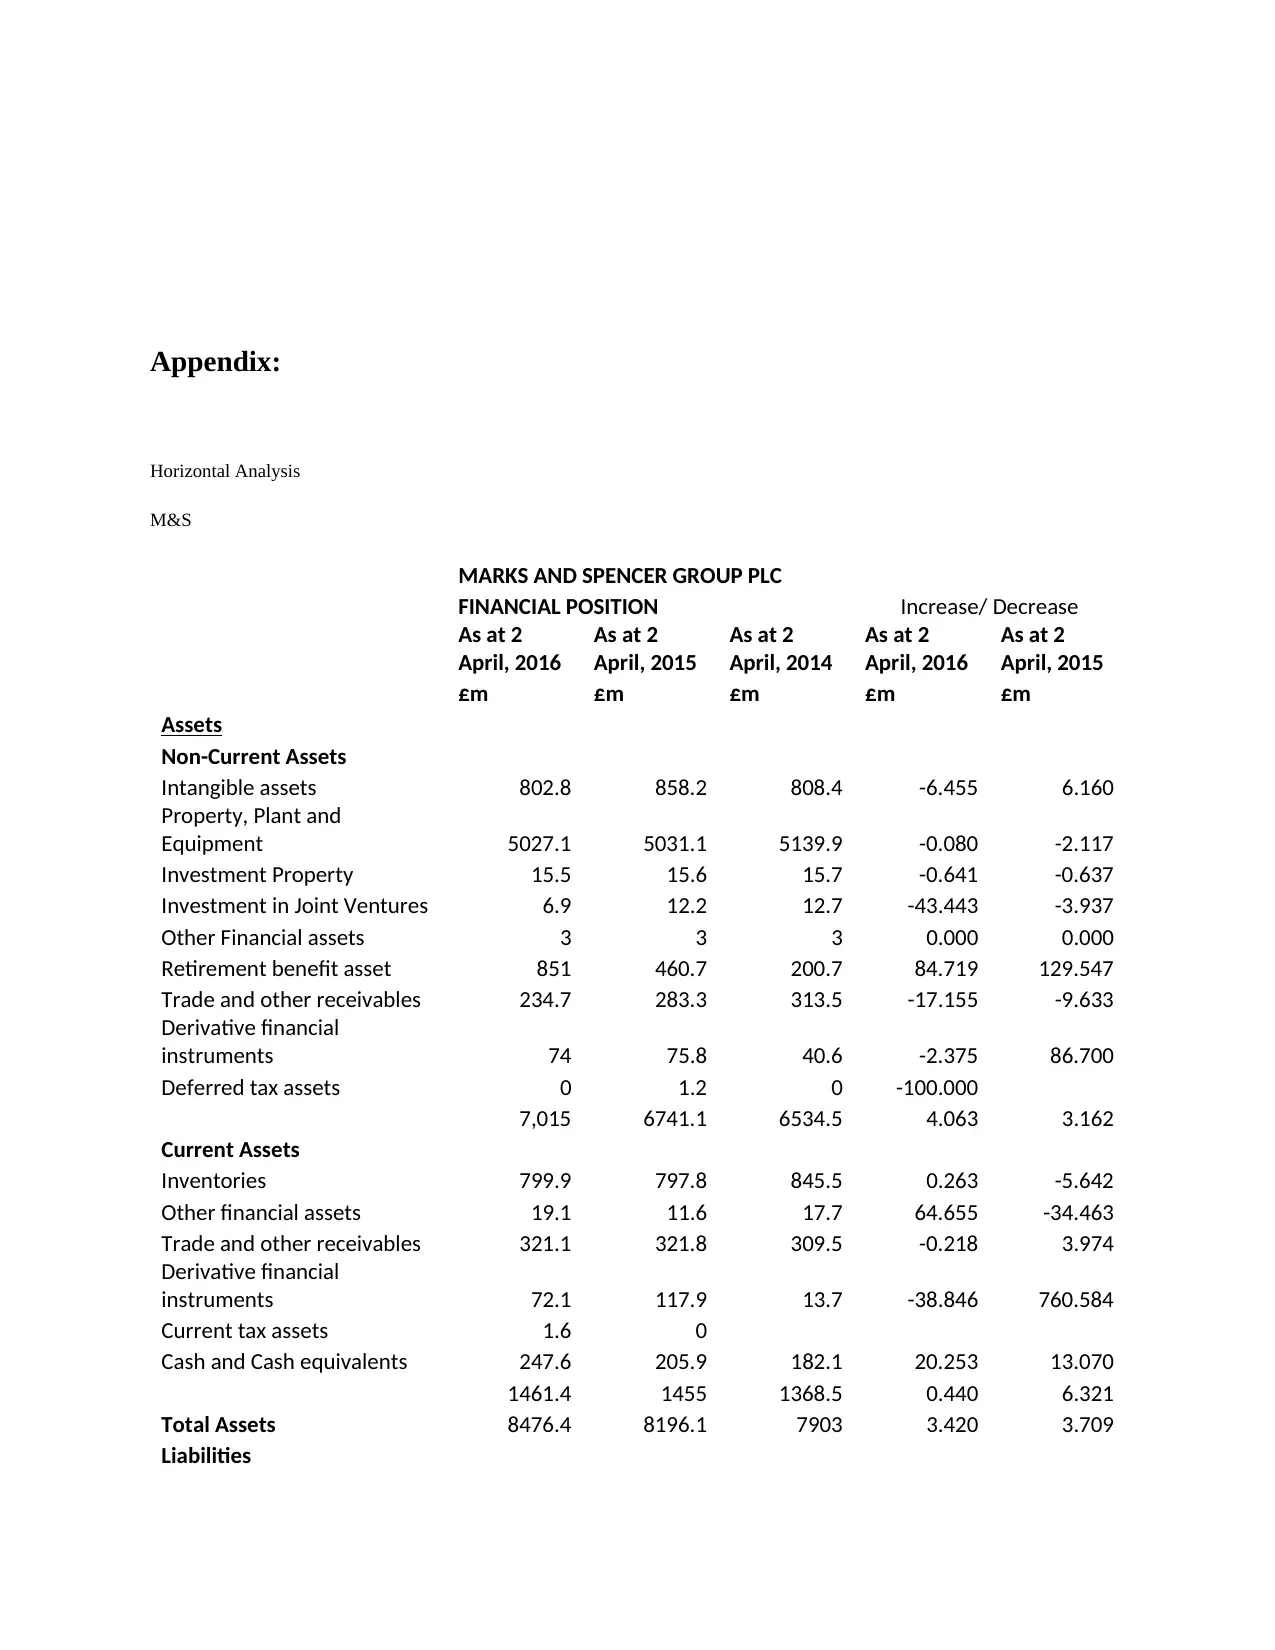
Appendix:
Horizontal Analysis
M&S
MARKS AND SPENCER GROUP PLC
FINANCIAL POSITION Increase/ Decrease
As at 2
April, 2016
As at 2
April, 2015
As at 2
April, 2014
As at 2
April, 2016
As at 2
April, 2015
£m £m £m £m £m
Assets
Non-Current Assets
Intangible assets 802.8 858.2 808.4 -6.455 6.160
Property, Plant and
Equipment 5027.1 5031.1 5139.9 -0.080 -2.117
Investment Property 15.5 15.6 15.7 -0.641 -0.637
Investment in Joint Ventures 6.9 12.2 12.7 -43.443 -3.937
Other Financial assets 3 3 3 0.000 0.000
Retirement benefit asset 851 460.7 200.7 84.719 129.547
Trade and other receivables 234.7 283.3 313.5 -17.155 -9.633
Derivative financial
instruments 74 75.8 40.6 -2.375 86.700
Deferred tax assets 0 1.2 0 -100.000
7,015 6741.1 6534.5 4.063 3.162
Current Assets
Inventories 799.9 797.8 845.5 0.263 -5.642
Other financial assets 19.1 11.6 17.7 64.655 -34.463
Trade and other receivables 321.1 321.8 309.5 -0.218 3.974
Derivative financial
instruments 72.1 117.9 13.7 -38.846 760.584
Current tax assets 1.6 0
Cash and Cash equivalents 247.6 205.9 182.1 20.253 13.070
1461.4 1455 1368.5 0.440 6.321
Total Assets 8476.4 8196.1 7903 3.420 3.709
Liabilities
Paraphrase This Document
Need a fresh take? Get an instant paraphrase of this document with our AI Paraphraser
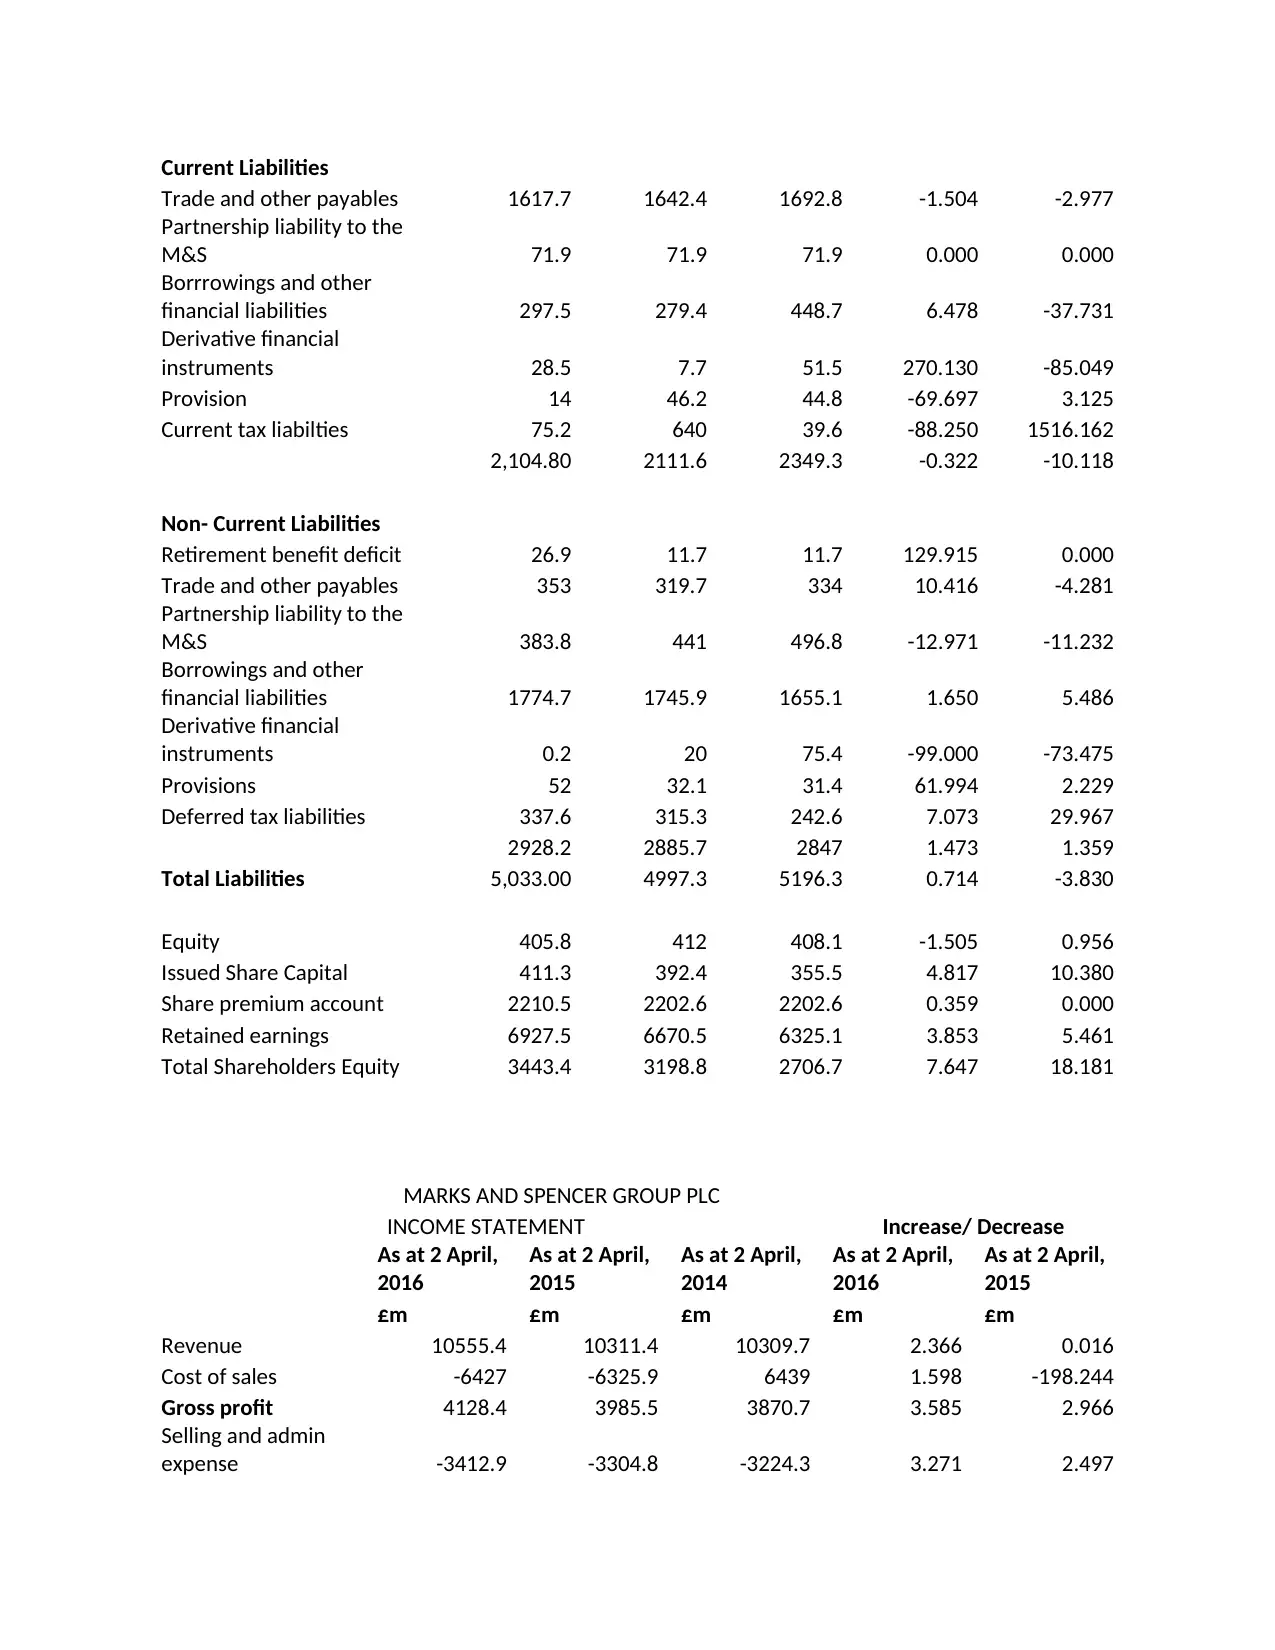
Current Liabilities
Trade and other payables 1617.7 1642.4 1692.8 -1.504 -2.977
Partnership liability to the
M&S 71.9 71.9 71.9 0.000 0.000
Borrrowings and other
financial liabilities 297.5 279.4 448.7 6.478 -37.731
Derivative financial
instruments 28.5 7.7 51.5 270.130 -85.049
Provision 14 46.2 44.8 -69.697 3.125
Current tax liabilties 75.2 640 39.6 -88.250 1516.162
2,104.80 2111.6 2349.3 -0.322 -10.118
Non- Current Liabilities
Retirement benefit deficit 26.9 11.7 11.7 129.915 0.000
Trade and other payables 353 319.7 334 10.416 -4.281
Partnership liability to the
M&S 383.8 441 496.8 -12.971 -11.232
Borrowings and other
financial liabilities 1774.7 1745.9 1655.1 1.650 5.486
Derivative financial
instruments 0.2 20 75.4 -99.000 -73.475
Provisions 52 32.1 31.4 61.994 2.229
Deferred tax liabilities 337.6 315.3 242.6 7.073 29.967
2928.2 2885.7 2847 1.473 1.359
Total Liabilities 5,033.00 4997.3 5196.3 0.714 -3.830
Equity 405.8 412 408.1 -1.505 0.956
Issued Share Capital 411.3 392.4 355.5 4.817 10.380
Share premium account 2210.5 2202.6 2202.6 0.359 0.000
Retained earnings 6927.5 6670.5 6325.1 3.853 5.461
Total Shareholders Equity 3443.4 3198.8 2706.7 7.647 18.181
MARKS AND SPENCER GROUP PLC
INCOME STATEMENT Increase/ Decrease
As at 2 April,
2016
As at 2 April,
2015
As at 2 April,
2014
As at 2 April,
2016
As at 2 April,
2015
£m £m £m £m £m
Revenue 10555.4 10311.4 10309.7 2.366 0.016
Cost of sales -6427 -6325.9 6439 1.598 -198.244
Gross profit 4128.4 3985.5 3870.7 3.585 2.966
Selling and admin
expense -3412.9 -3304.8 -3224.3 3.271 2.497
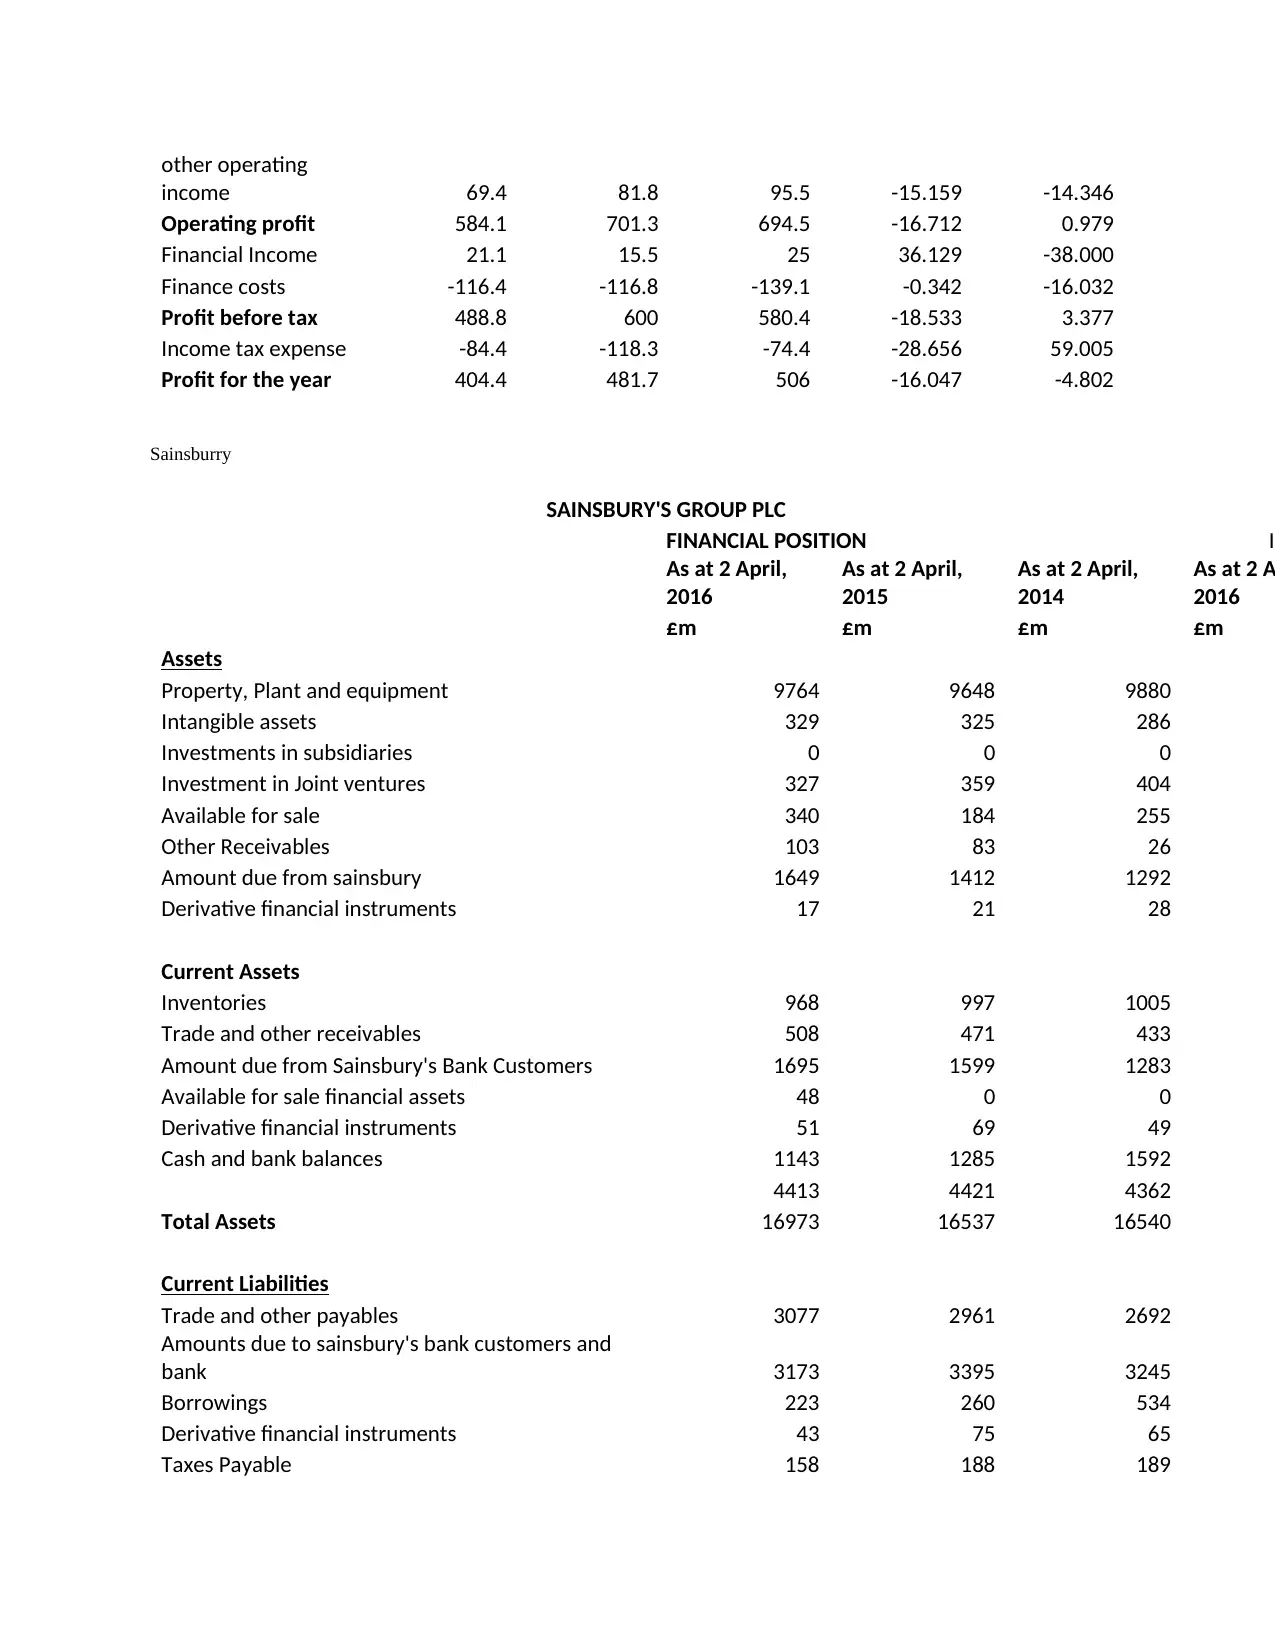
other operating
income 69.4 81.8 95.5 -15.159 -14.346
Operating profit 584.1 701.3 694.5 -16.712 0.979
Financial Income 21.1 15.5 25 36.129 -38.000
Finance costs -116.4 -116.8 -139.1 -0.342 -16.032
Profit before tax 488.8 600 580.4 -18.533 3.377
Income tax expense -84.4 -118.3 -74.4 -28.656 59.005
Profit for the year 404.4 481.7 506 -16.047 -4.802
Sainsburry
SAINSBURY'S GROUP PLC
FINANCIAL POSITION In
As at 2 April,
2016
As at 2 April,
2015
As at 2 April,
2014
As at 2 A
2016
£m £m £m £m
Assets
Property, Plant and equipment 9764 9648 9880
Intangible assets 329 325 286
Investments in subsidiaries 0 0 0
Investment in Joint ventures 327 359 404
Available for sale 340 184 255
Other Receivables 103 83 26
Amount due from sainsbury 1649 1412 1292
Derivative financial instruments 17 21 28
Current Assets
Inventories 968 997 1005
Trade and other receivables 508 471 433
Amount due from Sainsbury's Bank Customers 1695 1599 1283
Available for sale financial assets 48 0 0
Derivative financial instruments 51 69 49
Cash and bank balances 1143 1285 1592
4413 4421 4362
Total Assets 16973 16537 16540
Current Liabilities
Trade and other payables 3077 2961 2692
Amounts due to sainsbury's bank customers and
bank 3173 3395 3245
Borrowings 223 260 534
Derivative financial instruments 43 75 65
Taxes Payable 158 188 189
⊘ This is a preview!⊘
Do you want full access?
Subscribe today to unlock all pages.
Trusted by 1+ million students worldwide
1 out of 18
Related Documents


Your All-in-One AI-Powered Toolkit for Academic Success.
+13062052269
info@desklib.com
Available 24*7 on WhatsApp / Email
![[object Object]](/_next/static/media/star-bottom.7253800d.svg)
Unlock your academic potential
Copyright © 2020–2026 A2Z Services. All Rights Reserved. Developed and managed by ZUCOL.