Graduate Statistics PSY-520: MANOVA Project on Presentation Methods
VerifiedAdded on 2023/04/21
|6
|897
|312
Project
AI Summary
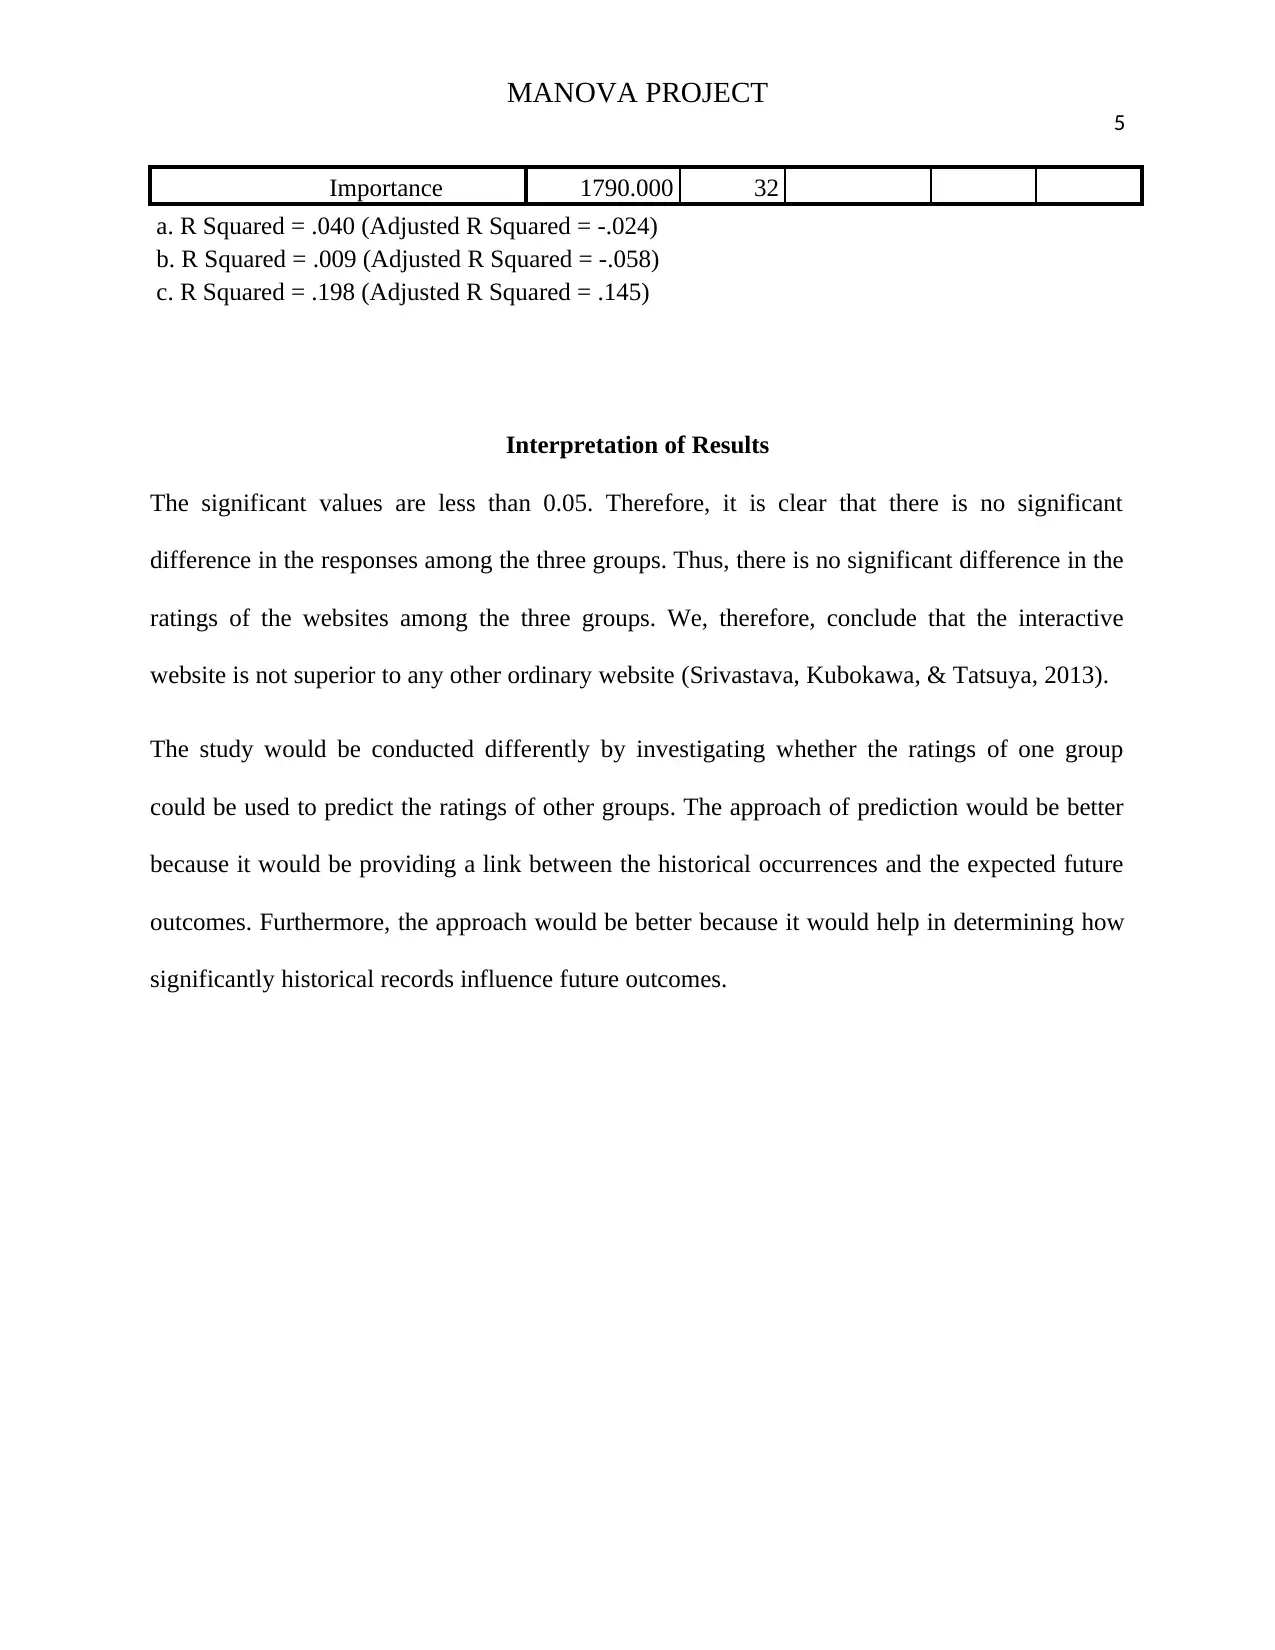
This project utilizes Multivariate Analysis of Variance (MANOVA) to investigate whether there are significant differences in the perceived difficulty, usefulness, and importance ratings of a presentation based on three different delivery methods: an interactive website, a nurse practitioner, and a video tape. The study aims to determine if the interactive website is a superior, cost-effective method. The analysis, conducted using SPSS, reveals no significant differences in ratings across the three groups, leading to the conclusion that the interactive website is not superior. The study suggests future research could focus on predicting ratings across groups to establish links between historical data and future outcomes.

Running Head: MANOVA PROJECT
1
MANOVA PROJECT
By (Name)
PSY-520 Graduate Statistics
1
MANOVA PROJECT
By (Name)
PSY-520 Graduate Statistics
Paraphrase This Document
Need a fresh take? Get an instant paraphrase of this document with our AI Paraphraser

MANOVA PROJECT 2
Introduction
The study looks at three different ratings of the presentation; difficulty, usefulness, and
importance to determine if there is a difference in the modes of presentation. The major aim of
this study is to investigate whether the interactive website is superior because that is the most
cost-effective way of delivering the information
The study has applied the use of multivariate analysis of variance to meet the objective. A
multivariate analysis of variance (MANOVA) is a technique that applied to comparing
multivariate means. Multivariate analysis of variance is suitable for use in this study because the
variables are from different samples. Moreover, the study seeks to establish whether there is any
significant difference in the means of the groups (Srivastava, Kubokawa, & Tatsuya, 2013).
The data set consists of three groups (group 1, group 2 and group 3). The data sets meets the
assumptions that are necessary for conducting a multivariate analysis of variance (Srivastava,
Kubokawa, & Tatsuya, 2013). For example, the data set consists of three independent variables
which are measured in intervals. The three groups consist of categorical variables. There are no
outliers and the sample size is adequate to conduct a multivariate analysis of variance
(Sugasawa, Shonosuke, Kubokawa, & Tatsuya, 2017).
Data Analysis
The table below outlines the number of observations in each group.

MANOVA PROJECT 3
Between-Subjects Factors
N
Group
1 11
2 12
3 10
The table below outlines the summary statistics of each category of response for each group.
Descriptive Statistics
Group Mean Std. Deviation N
Usefulness
1 21.45 3.804 11
2 23.17 5.750 12
3 21.10 4.095 10
Total 21.97 4.633 33
Difficulty
1 9.18 3.125 11
2 9.83 3.881 12
3 9.40 1.838 10
Total 9.48 3.043 33
Importance
1 15.64 6.786 11
2 8.67 7.402 12
3 8.70 6.430 10
Total 11.00 7.479 33
The table below outlines the output of the multivariate analysis of variance among the three
groups. Multivariate test investigates whether there is any significant difference in the average
values of the responses across the groups. The results have been obtained using SPSS. The
results indicate that the all the significant values are 0.00.
⊘ This is a preview!⊘
Do you want full access?
Subscribe today to unlock all pages.

Trusted by 1+ million students worldwide

MANOVA PROJECT 4
Multivariate Testsa
Effect Value F Hypothesis df Error df Sig.
Intercept
Pillai's Trace .971 313.177b 3.000 28.000 .000
Wilks' Lambda .029 313.177b 3.000 28.000 .000
Hotelling's Trace 33.555 313.177b 3.000 28.000 .000
Roy's Largest Root 33.555 313.177b 3.000 28.000 .000
Group
Pillai's Trace .265 1.478 6.000 58.000 .202
Wilks' Lambda .743 1.495b 6.000 56.000 .197
Hotelling's Trace .335 1.509 6.000 54.000 .193
Roy's Largest Root .299 2.889c 3.000 29.000 .052
a. Design: Intercept + Group
b. Exact statistic
c. The statistic is an upper bound on F that yields a lower bound on the significance level.
Tests of Between-Subjects Effects
Source Dependent
Variable
Type III Sum
of Squares
df Mean Square F Sig.
Corrected
Model
Usefulness 27.676a 2 13.838 .630 .540
Difficulty 2.539b 2 1.270 .130 .879
Importance 354.688c 2 177.344 3.707 .036
Intercept
Usefulness 15749.852 1 15749.852 716.669 .000
Difficulty 2944.186 1 2944.186 300.731 .000
Importance 3971.669 1 3971.669 83.013 .000
Group
Usefulness 27.676 2 13.838 .630 .540
Difficulty 2.539 2 1.270 .130 .879
Importance 354.688 2 177.344 3.707 .036
Error
Usefulness 659.294 30 21.976
Difficulty 293.703 30 9.790
Importance 1435.312 30 47.844
Total
Usefulness 16615.000 33
Difficulty 3265.000 33
Importance 5783.000 33
Corrected Total Usefulness 686.970 32
Difficulty 296.242 32
Paraphrase This Document
Need a fresh take? Get an instant paraphrase of this document with our AI Paraphraser

MANOVA PROJECT 5
Importance 1790.000 32
a. R Squared = .040 (Adjusted R Squared = -.024)
b. R Squared = .009 (Adjusted R Squared = -.058)
c. R Squared = .198 (Adjusted R Squared = .145)
Interpretation of Results
The significant values are less than 0.05. Therefore, it is clear that there is no significant
difference in the responses among the three groups. Thus, there is no significant difference in the
ratings of the websites among the three groups. We, therefore, conclude that the interactive
website is not superior to any other ordinary website (Srivastava, Kubokawa, & Tatsuya, 2013).
The study would be conducted differently by investigating whether the ratings of one group
could be used to predict the ratings of other groups. The approach of prediction would be better
because it would be providing a link between the historical occurrences and the expected future
outcomes. Furthermore, the approach would be better because it would help in determining how
significantly historical records influence future outcomes.

MANOVA PROJECT 6
References
Srivastava, M. S., Kubokawa, & Tatsuya. (2013). Tests for multivariate analysis of variance in
high dimension under non-normality. Journal of Multivariate Analysis, 11.
Sugasawa, Shonosuke, Kubokawa, & Tatsuya. (2017). Bayesian estimators in uncertain nested
error regression models. Journal of Multivariate Analysis, 23.
⊘ This is a preview!⊘
Do you want full access?
Subscribe today to unlock all pages.

Trusted by 1+ million students worldwide
1 out of 6
Related Documents
Your All-in-One AI-Powered Toolkit for Academic Success.
+13062052269
info@desklib.com
Available 24*7 on WhatsApp / Email
Unlock your academic potential
Copyright © 2020–2025 A2Z Services. All Rights Reserved. Developed and managed by ZUCOL.


