Preventive Maintenance KPIs: Performance Analysis in Manufacturing

Verified

Added on  2023/05/29

|6
|972
|240
Report
AI Summary
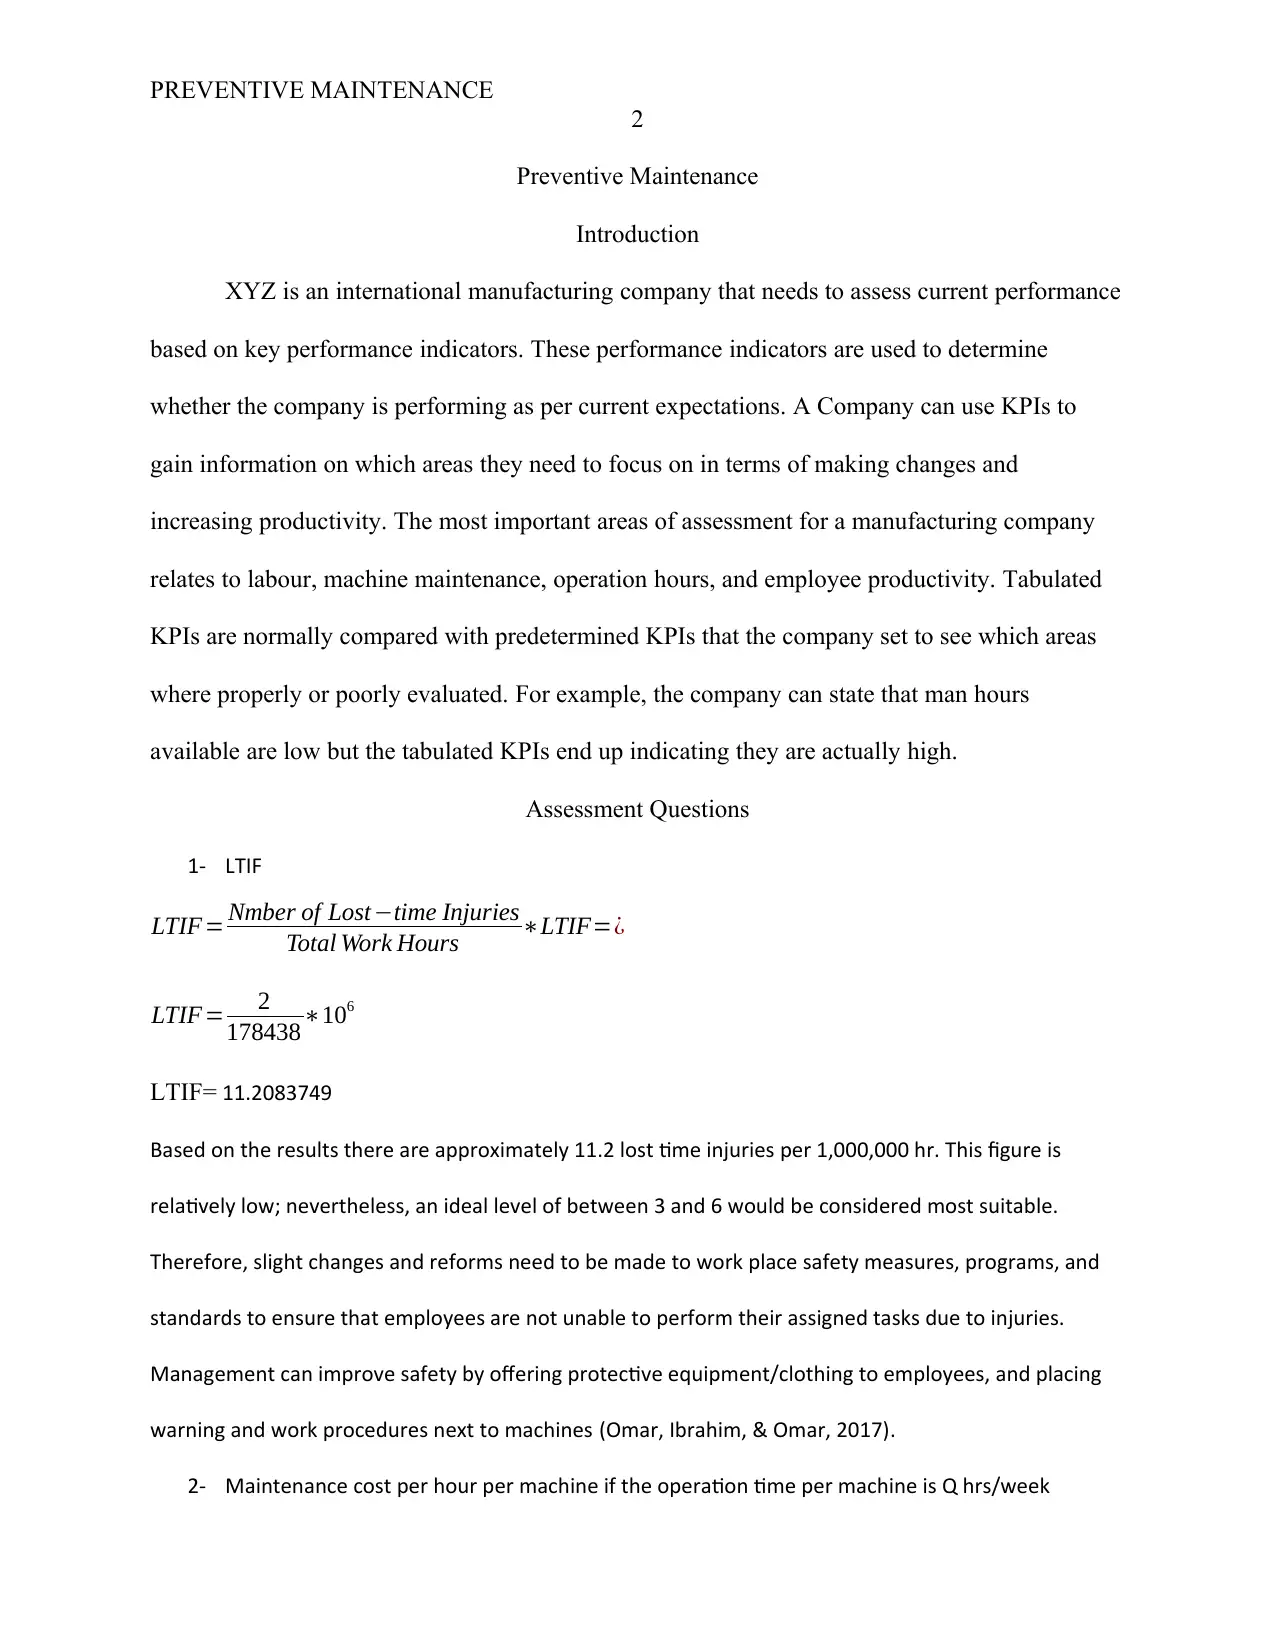
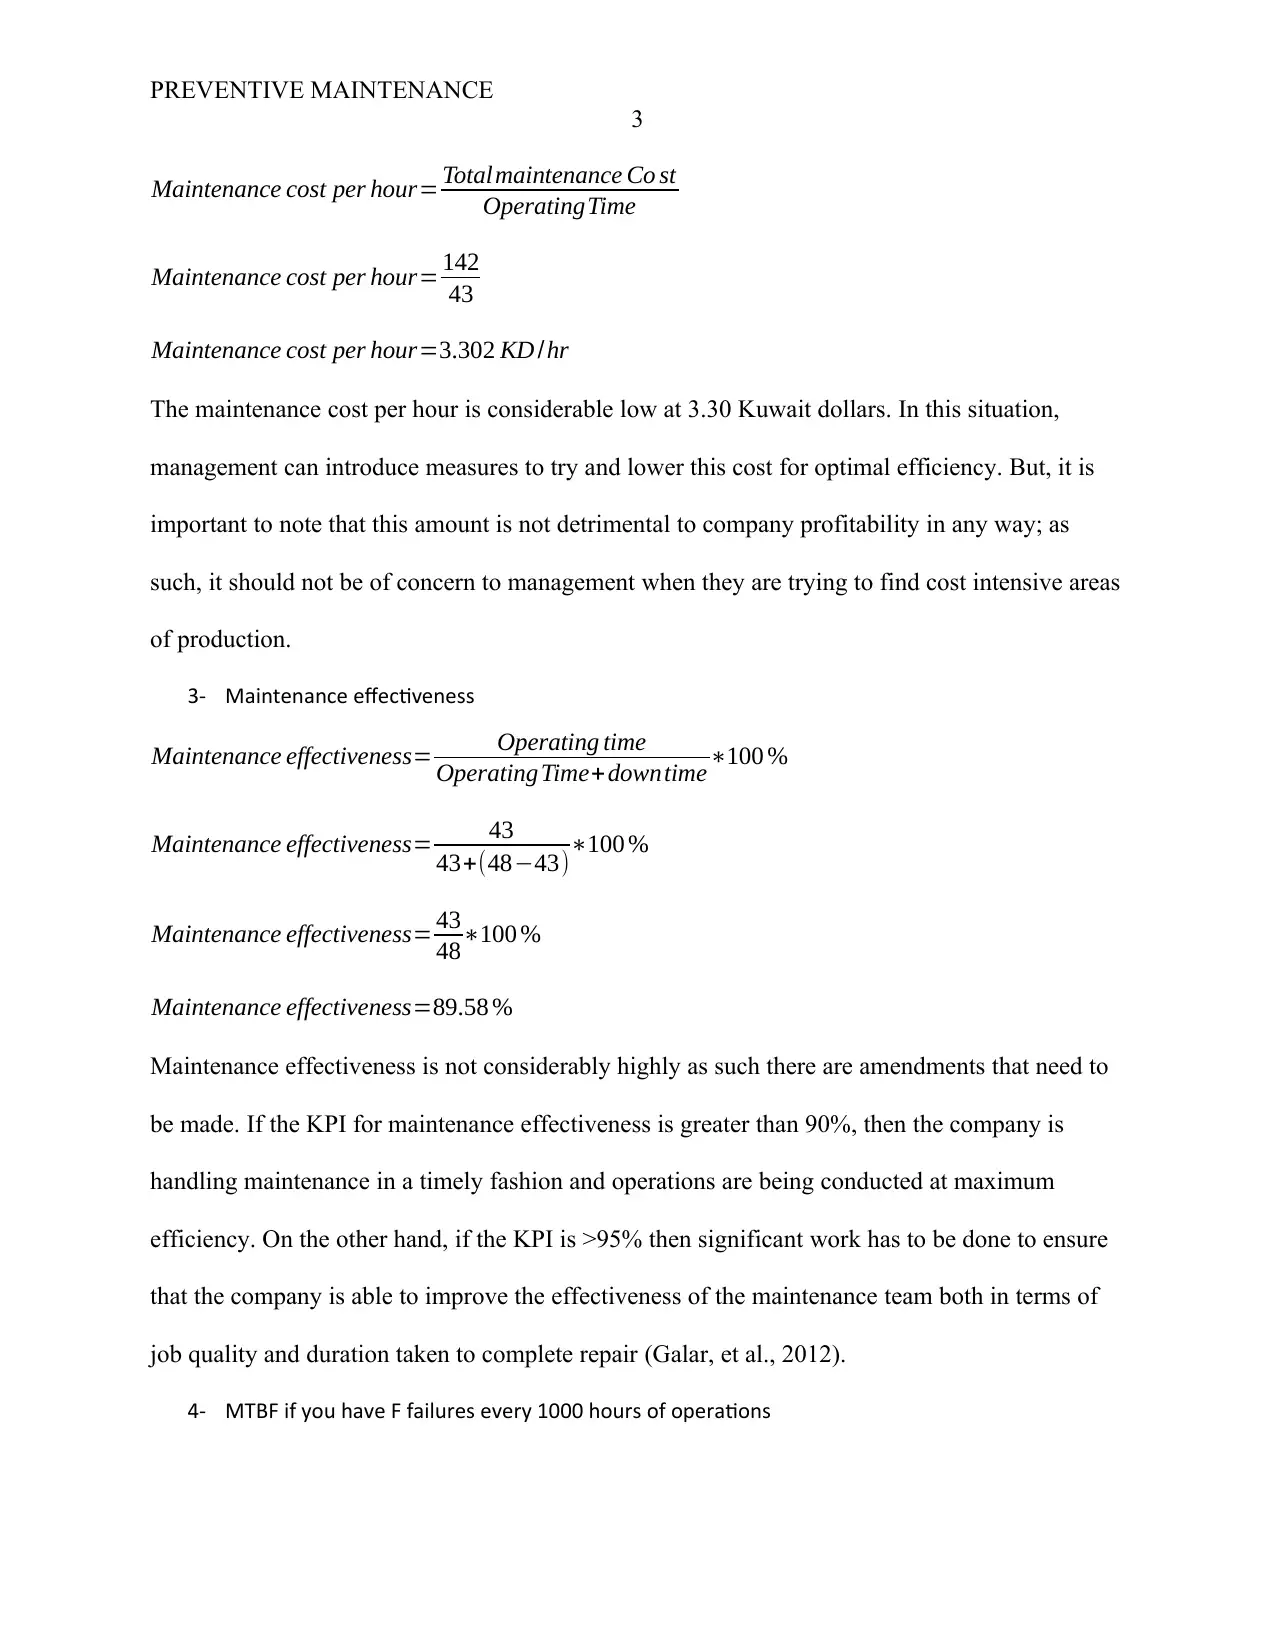
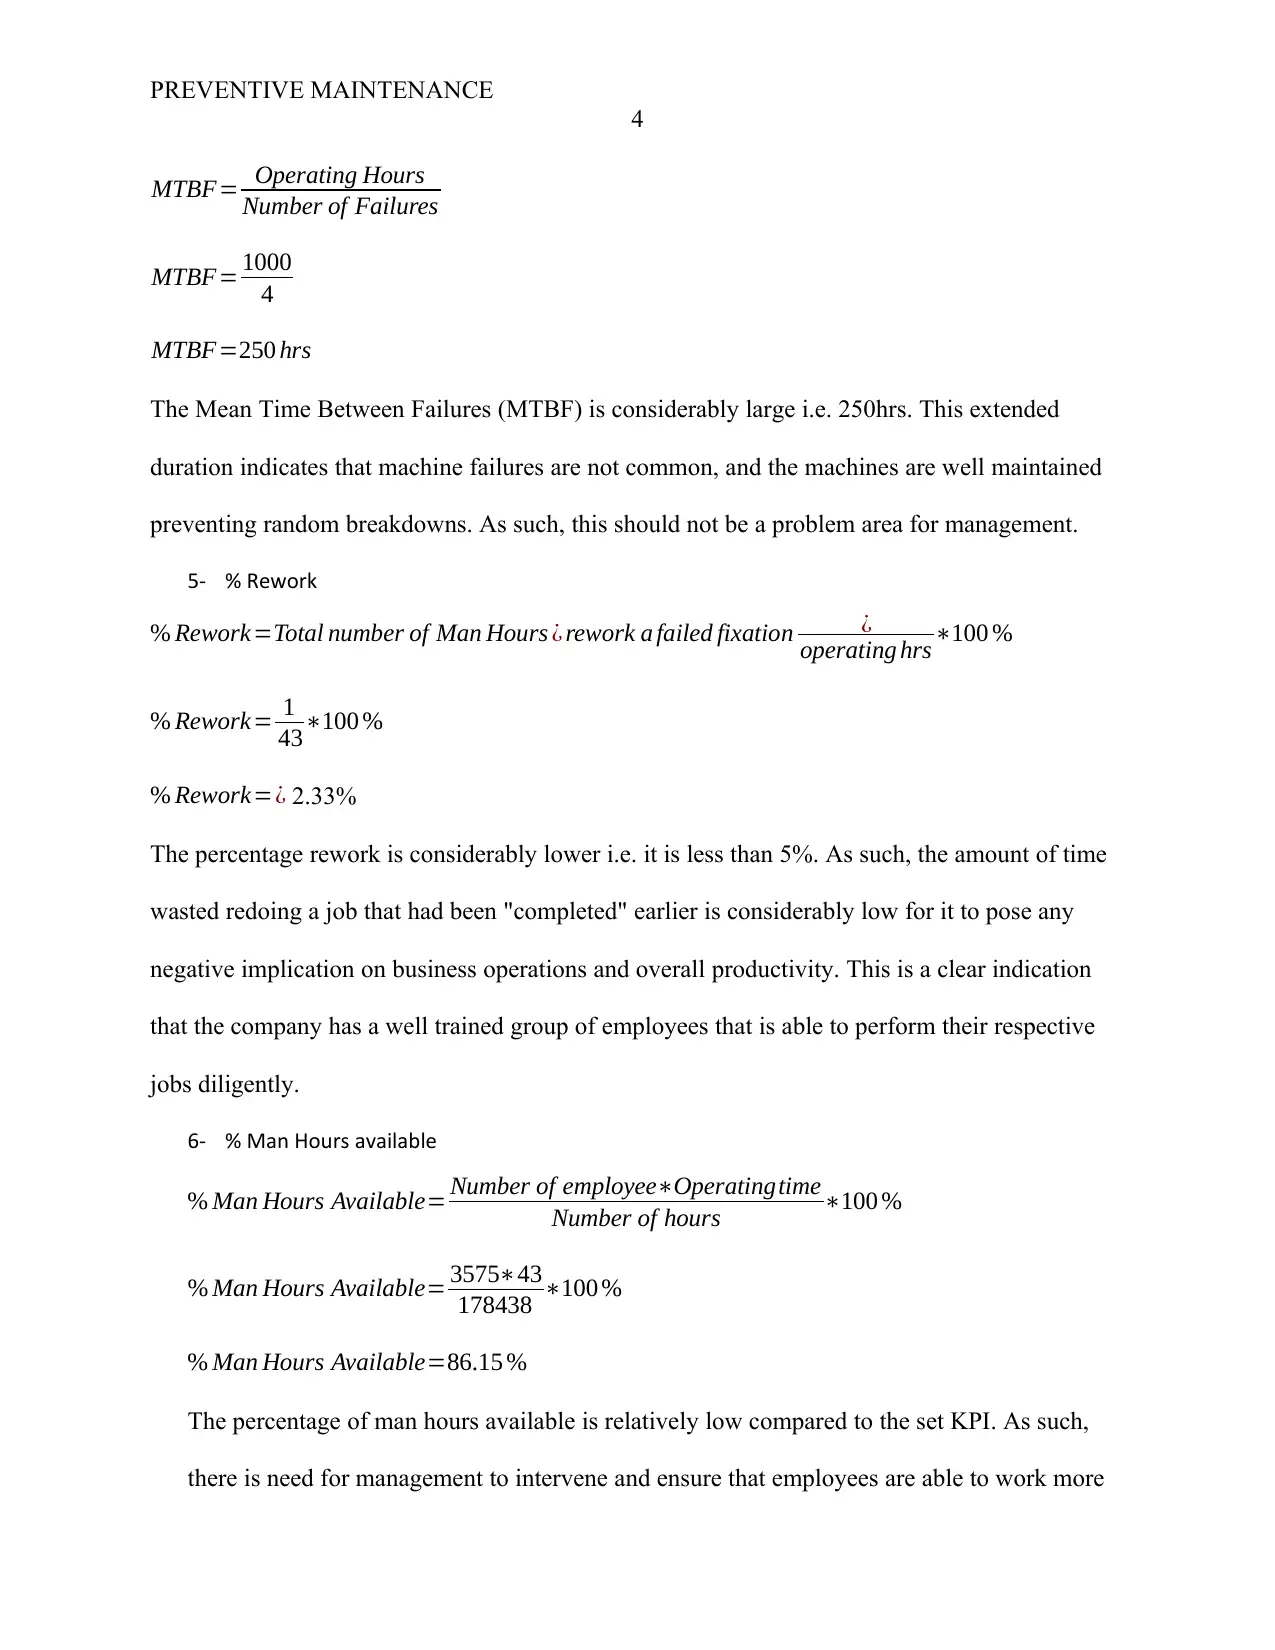
This report analyzes the Key Performance Indicators (KPIs) of an international manufacturing company, XYZ, to assess its current performance in areas like labor, machine maintenance, operation hours, and employee productivity. The analysis includes calculations and interpretations of metrics such as Lost Time Injury Frequency (LTIF), maintenance cost per hour, maintenance effectiveness, Mean Time Between Failures (MTBF), percentage rework, and percentage of man-hours available. The findings suggest that the company performs well in workplace safety, maintenance costs, MTBF, and rework reduction. However, there's room for improvement in maintenance effectiveness and increasing available man-hours to meet the set KPI standards. Management intervention is recommended to enhance employee engagement and optimize maintenance processes for maximum efficiency and productivity.
tabler-icon-diamond-filled.svg

Contribute Materials

Your contribution can guide someone’s learning journey. Share your documents today.
Document Page
Running head: PREVENTIVE MAINTENANCE
1
Preventive Maintenance Paper
Student's Name
Professor's Name
Affiliation
Date
tabler-icon-diamond-filled.svg

Secure Best Marks with AI Grader

Need help grading? Try our AI Grader for instant feedback on your assignments.
Document Page
PREVENTIVE MAINTENANCE
2
Preventive Maintenance
Introduction
XYZ is an international manufacturing company that needs to assess current performance
based on key performance indicators. These performance indicators are used to determine
whether the company is performing as per current expectations. A Company can use KPIs to
gain information on which areas they need to focus on in terms of making changes and
increasing productivity. The most important areas of assessment for a manufacturing company
relates to labour, machine maintenance, operation hours, and employee productivity. Tabulated
KPIs are normally compared with predetermined KPIs that the company set to see which areas
where properly or poorly evaluated. For example, the company can state that man hours
available are low but the tabulated KPIs end up indicating they are actually high.
Assessment Questions
1- LTIF
LTIF= Nmber of Losttime Injuries
Total Work Hours LTIF=¿
LTIF= 2
178438106
LTIF= 11.2083749
Based on the results there are approximately 11.2 lost time injuries per 1,000,000 hr. This figure is
relatively low; nevertheless, an ideal level of between 3 and 6 would be considered most suitable.
Therefore, slight changes and reforms need to be made to work place safety measures, programs, and
standards to ensure that employees are not unable to perform their assigned tasks due to injuries.
Management can improve safety by offering protective equipment/clothing to employees, and placing
warning and work procedures next to machines (Omar, Ibrahim, & Omar, 2017).
2- Maintenance cost per hour per machine if the operation time per machine is Q hrs/week
Document Page
PREVENTIVE MAINTENANCE
3
Maintenance cost per hour= Totalmaintenance Co st
OperatingTime
Maintenance cost per hour= 142
43
Maintenance cost per hour=3.302 KD /hr
The maintenance cost per hour is considerable low at 3.30 Kuwait dollars. In this situation,
management can introduce measures to try and lower this cost for optimal efficiency. But, it is
important to note that this amount is not detrimental to company profitability in any way; as
such, it should not be of concern to management when they are trying to find cost intensive areas
of production.
3- Maintenance effectiveness
Maintenance effectiveness= Operating time
OperatingTime+downtime100 %
Maintenance effectiveness= 43
43+(4843)100 %
Maintenance effectiveness= 43
48100 %
Maintenance effectiveness=89.58 %
Maintenance effectiveness is not considerably highly as such there are amendments that need to
be made. If the KPI for maintenance effectiveness is greater than 90%, then the company is
handling maintenance in a timely fashion and operations are being conducted at maximum
efficiency. On the other hand, if the KPI is >95% then significant work has to be done to ensure
that the company is able to improve the effectiveness of the maintenance team both in terms of
job quality and duration taken to complete repair (Galar, et al., 2012).
4- MTBF if you have F failures every 1000 hours of operations
Document Page
PREVENTIVE MAINTENANCE
4
MTBF= Operating Hours
Number of Failures
MTBF= 1000
4
MTBF=250 hrs
The Mean Time Between Failures (MTBF) is considerably large i.e. 250hrs. This extended
duration indicates that machine failures are not common, and the machines are well maintained
preventing random breakdowns. As such, this should not be a problem area for management.
5- % Rework
% Rework=Total number of Man Hours ¿ rework a failed fixation ¿
operating hrs100 %
% Rework= 1
43100 %
% Rework=¿ 2.33%
The percentage rework is considerably lower i.e. it is less than 5%. As such, the amount of time
wasted redoing a job that had been "completed" earlier is considerably low for it to pose any
negative implication on business operations and overall productivity. This is a clear indication
that the company has a well trained group of employees that is able to perform their respective
jobs diligently.
6- % Man Hours available
% Man Hours Available= Number of employeeOperatingtime
Number of hours 100 %
% Man Hours Available= 357543
178438 100 %
% Man Hours Available=86.15 %
The percentage of man hours available is relatively low compared to the set KPI. As such,
there is need for management to intervene and ensure that employees are able to work more
tabler-icon-diamond-filled.svg

Secure Best Marks with AI Grader

Need help grading? Try our AI Grader for instant feedback on your assignments.
Document Page
PREVENTIVE MAINTENANCE
5
within the stipulated hours. For example, management can create reward incentives for
employees that will push operation hours from 43 to a figure close or equivalent to 48.
Conclusion
The KPIs standards set by XYZ international manufacturing company were met
according to the parameters that were calculated in the above question. The results indicate
that the company is performing favourably in terms of: upholding proper workplace safety
standard, reducing maintenance costs, MTBF, and mitigating the percentage rework
observed. On the other hand, the company need to works on improving performance
associated with maintenance effectiveness, and increasing man hours available.
References
Galar, D., Parida, A., Kumar, U., Baglee, D., & Morant, A. (2012). The measurement of maintenance
function efficiency through financial KPIs. Journal of Physics , 1-15.
Document Page
PREVENTIVE MAINTENANCE
6
Omar, M. F., Ibrahim, F. A., & Omar, W. M. (2017). Key Performance Indicators for Maintenance
Management Effectiveness of Public Hospital Building. MATEC Web of Conferences , 1-6.
chevron_up_icon
1 out of 6
circle_padding
hide_on_mobile
zoom_out_icon
logo.png

Your All-in-One AI-Powered Toolkit for Academic Success.

Available 24*7 on WhatsApp / Email

[object Object]