Manufacturing Systems Report: Performance, Flow Analysis, and Layouts
VerifiedAdded on 2023/04/21
|23
|6090
|118
Report
AI Summary
This comprehensive report delves into the intricacies of manufacturing systems, commencing with a review of key performance indicators (KPIs) and their significance in evaluating operational efficiency. It explores approaches to establish performance measures at the shop floor level, emphasizing their implementation to achieve corporate objectives. The report elucidates Product Flow Analysis (PFA) and Value Stream Mapping (VSM) methodologies, illustrating their application with practical examples. It then describes various plant layouts, highlighting their benefits in relation to production varieties, volume, and economies of scale. A critical review and comparison of lean manufacturing tools and techniques are provided, followed by definitions of relevant acronyms. Finally, the report includes a case study analyzing the performance of a manufacturing plant, incorporating data analysis and evaluation to assess its operational effectiveness and identify areas for enhancement. The report is a valuable resource for students studying manufacturing systems, providing a detailed overview of key concepts, methodologies, and practical applications.
Running head: MANUFACTURING SYSTEMS
Manufacturing Systems
Name of the Student
Name of the University
Author’s note
Manufacturing Systems
Name of the Student
Name of the University
Author’s note
Paraphrase This Document
Need a fresh take? Get an instant paraphrase of this document with our AI Paraphraser
1MANUFACTURING SYSTEMS
Table of Contents
Part A...............................................................................................................................................2
i) Review of Manufacturing Systems and Key Performance Indicators (KPIs)..........................2
ii) Approach for Establishing Performance Measures at Shop Floor Level Production.............3
iii) Product Flow Analysis (PFA) and Value Stream Mapping (VSM).......................................5
iv) Description of Plant Layouts..................................................................................................7
v) Critical Review and Comparison of Various Tools and Techniques......................................8
vi) Definitions of Terms............................................................................................................10
Part B.............................................................................................................................................11
Case Study: Performance Assessment of Manufacturing Plant................................................11
Part C.............................................................................................................................................15
Question 3..................................................................................................................................15
Question 7..................................................................................................................................16
References......................................................................................................................................17
2MANUFACTURING SYSTEMS
Part A
i) Review of Manufacturing Systems and Key Performance Indicators (KPIs)
Key Performance Indicators (KPIs) could be defined as the strategic and quantifiable
measurements that would be able to reflect the critical success factors of an enterprise. The
international standard ISO 22400 has been able to define a set of KPIs for the purpose of
evaluation of the kind of performance within the manufacturing operation systems (May et al.
2015). The rapid expansion within the modern manufacturing industry have led the production
enterprises to maintain a sufficient level of flexibility, higher standards of quality, sustainability
and productivity. Hence, in the recent times, the manufacturing systems mainly implement
performance measurement system in order to evaluate the state of operation within the activities
of manufacturing (Parmenter 2015). The modern kind of tools that have been implemented with
the help of IT systems have been able to provide opportunities for gathering a larger set of
necessary data and estimation. Hence, the KPIs that have been used for the evaluation of
performance of manufacturing systems have been put under major focus in the recent years. One
of the most critical issue based on evaluation of manufacturing operations is not only based on
defining of KPIs, but also to identify and select the most useful form of KPIs. The proper form of
selection and improved understanding of KPIs would prove to be helpful for the manufacturing
systems to help in fulfilling the desired objectives of business.
Based on the standards, the KPIs would be primarily described within their means of
formula, measuring unit timings and certain other characteristics. In spite of the efforts for
making the standards to be generally applicable to each of the manufacturing systems, the KPIs
would be primarily designed for the evaluation of performance based within discrete industry
⊘ This is a preview!⊘
Do you want full access?
Subscribe today to unlock all pages.
Trusted by 1+ million students worldwide
3MANUFACTURING SYSTEMS
(Feiz et al. 2015). In some cases, the standards of ISO 22400 would be able to explicitly indicate
that the indicators would be unsuitable for continuous form of processes.
In the recent years, there have been several kinds of developments in the Manufacturing
systems. As the different trends play a major factor in the manufacturing systems, large
executives should be much proactive on roles that would lead to consolidation and concentration.
Due to various competitive pressures, different manufacturers should experience increasing form
of pressure for focusing on one particular role. The most likely result of such kind of
developments within the manufacturing systems is based on significant restructuring. The list of
recommendations based on competitive issues have emerged with the recent kind of
developments. Creation of a competitive advantage would require the determination of several
factors that would put the manufacturing firm in such a better position based in relation with the
competitors present within the marketplace (Kylili Fokaides and Jimenez 2016). With the
massive form of developments, there have been a massive change in the manufacturing systems.
Different kinds of new invention in technology have been able to address the issues based on
competitiveness.
ii) Approach for Establishing Performance Measures at Shop Floor Level Production
Performance measurement is necessary within an organisation in order to determine the
proper functioning of the manufacturing systems. Performance measurement could be applied to
the overall organisation and also to subgroups within the organisation. Indirect form of measures
based on performance that would include costing of operations could be useful for the
identification of problems (Paolucci and Sacile 2016). Numerous kinds of planning and methods
of scheduling have been developed based on discrete form of manufacturing systems. The
continuous processes within manufacturing systems would require different forms of modelling
Paraphrase This Document
Need a fresh take? Get an instant paraphrase of this document with our AI Paraphraser
4MANUFACTURING SYSTEMS
approaches. In the current scenario, the approach that is used by plant management mostly
prioritize the product quality in which the switchover of the project is minimized.
One of the approach that could be used for establishing performance measures within the
shop floor level (Product/batch) is known as Simple Heuristic approach. This kind of approach is
able to define the optimal sequencing of products with respect to their due data within a single
machine system. In this approach, linear programming models were mostly developed. This kind
of approach was also applied for the purpose of solving large-scale constraint satisfaction and
problems based on scheduling (Rahmani and Heydari 2014). This kind of measure based on
simple heuristic approach could be implemented within manufacturing companies in order to
achieve the corporate objectives. An efficient use of this approach would be helpful for the
scheduling operations based on exploiting the critical path within a network.
Another approach that could be used within the manufacturing systems is known as linear
programming model. This would be dependent on the simultaneous planning of production and
scheduling based on multi-product batch manufacturing systems. This kind of model of approach
would involve a simplistic representation of the problem of scheduling in which different
possible constraints would not be considered (Gunasekaran et al. 2015). There are also certain
aspects of scheduling problems that includes operational pre-conditions, which would be
important for avoiding compromising of the final product. Different other forms of research
within the scheduling of activities within the manufacturing systems also included the
development of certain models based on scheduling of faster consumer good manufacturing
processes. The main objectives of this study was based on scheduling of production within the
manufacturing systems. The main purpose of this study was meant for inventory, production and
planning of horizon costs that would be greatly minimized.
5MANUFACTURING SYSTEMS
A proper use of the above mentioned approaches would help in determining the problems
arising within the manufacturing systems. Based on following such kind of strategy, these
manufacturing companies would mostly be benefited as they would be able to invest proper
resources within the business. A well-defined and well-executed strategy and action plan would
help the manufacturing company to move forward in order to achieve their corporate objectives,
capture more share within the present market, improve their products and also increase
satisfaction of customers (Guo et al. 2015). Effective strategic planning within the manufacturing
business would also require a methodical and dynamical process that would help the organisation
to focus on the right issues and take necessary actions.
iii) Product Flow Analysis (PFA) and Value Stream Mapping (VSM)
Product Flow Analysis (PFA) could be defined as a well-established methodology that is
primarily used for transforming the traditional functional layout into a different product-oriented
layout. The method employed in PFA makes uses of part routings for finding natural clusters
within workstations that would form production cells (Nakatani and Moriguchi 2014). They
would thus be able to complete parts and form components in a swift manner with the help of
simplified form of flow of material. Once the PFA would be implemented, the scheduling system
would be based on control of period batch. It would aim for establishing fixed planning,
production and final delivery cycles based on the entire unit of production. PFA is traditionally
been applied within functional layouts. This kind of methodology helps in the reduction of lead
times, improvement of quality and providing of motivation among the personnel (Rubio-
Martinez et al. 2014). The impact of PFA would help in the reduction of non-value adding
operations and diminishes the variability of process. These impacts made by PFA helps in
contributing towards efficient management of operations.
⊘ This is a preview!⊘
Do you want full access?
Subscribe today to unlock all pages.
Trusted by 1+ million students worldwide
6MANUFACTURING SYSTEMS
Value Stream Mapping (VSM) is defined as a lean management method based on
analysing the present state and based on that, it would assist in designing the future state for the
series of desired events. The design of the series of events would initiate from the beginning and
end at the side of the customers. This would be reduced with lean wastes as compared with the
current map (Tyagi et al. 2015). The value stream would primarily focus on such areas of a firm,
which would help in adding value to a certain service or product. On the other hand, the value
chain would refer to each of the activities of the company. The VSM is also known as the value
stream analysis and lean process mapping. It could be defined as a lean tool, which is able to
employ the documentation of flow diagram by detailing each step in the process (Brown,
Amundson and Badurdeen 2014). Many of the lean practitioners have viewed VSM as one of the
fundamental tool in order to identify the waste, reduce the process cycle times and also
implement the improvement of processes.
In the manufacturing industry, the VSM helps in introspection along with analysis and
improvement of processes. Within a manufacturing company, the inputs for a value stream map
is able to include each resource for leveraging of produced goods or services. The route followed
consists of value adding steps. It also includes attendant non-value adding steps.
Paraphrase This Document
Need a fresh take? Get an instant paraphrase of this document with our AI Paraphraser
7MANUFACTURING SYSTEMS
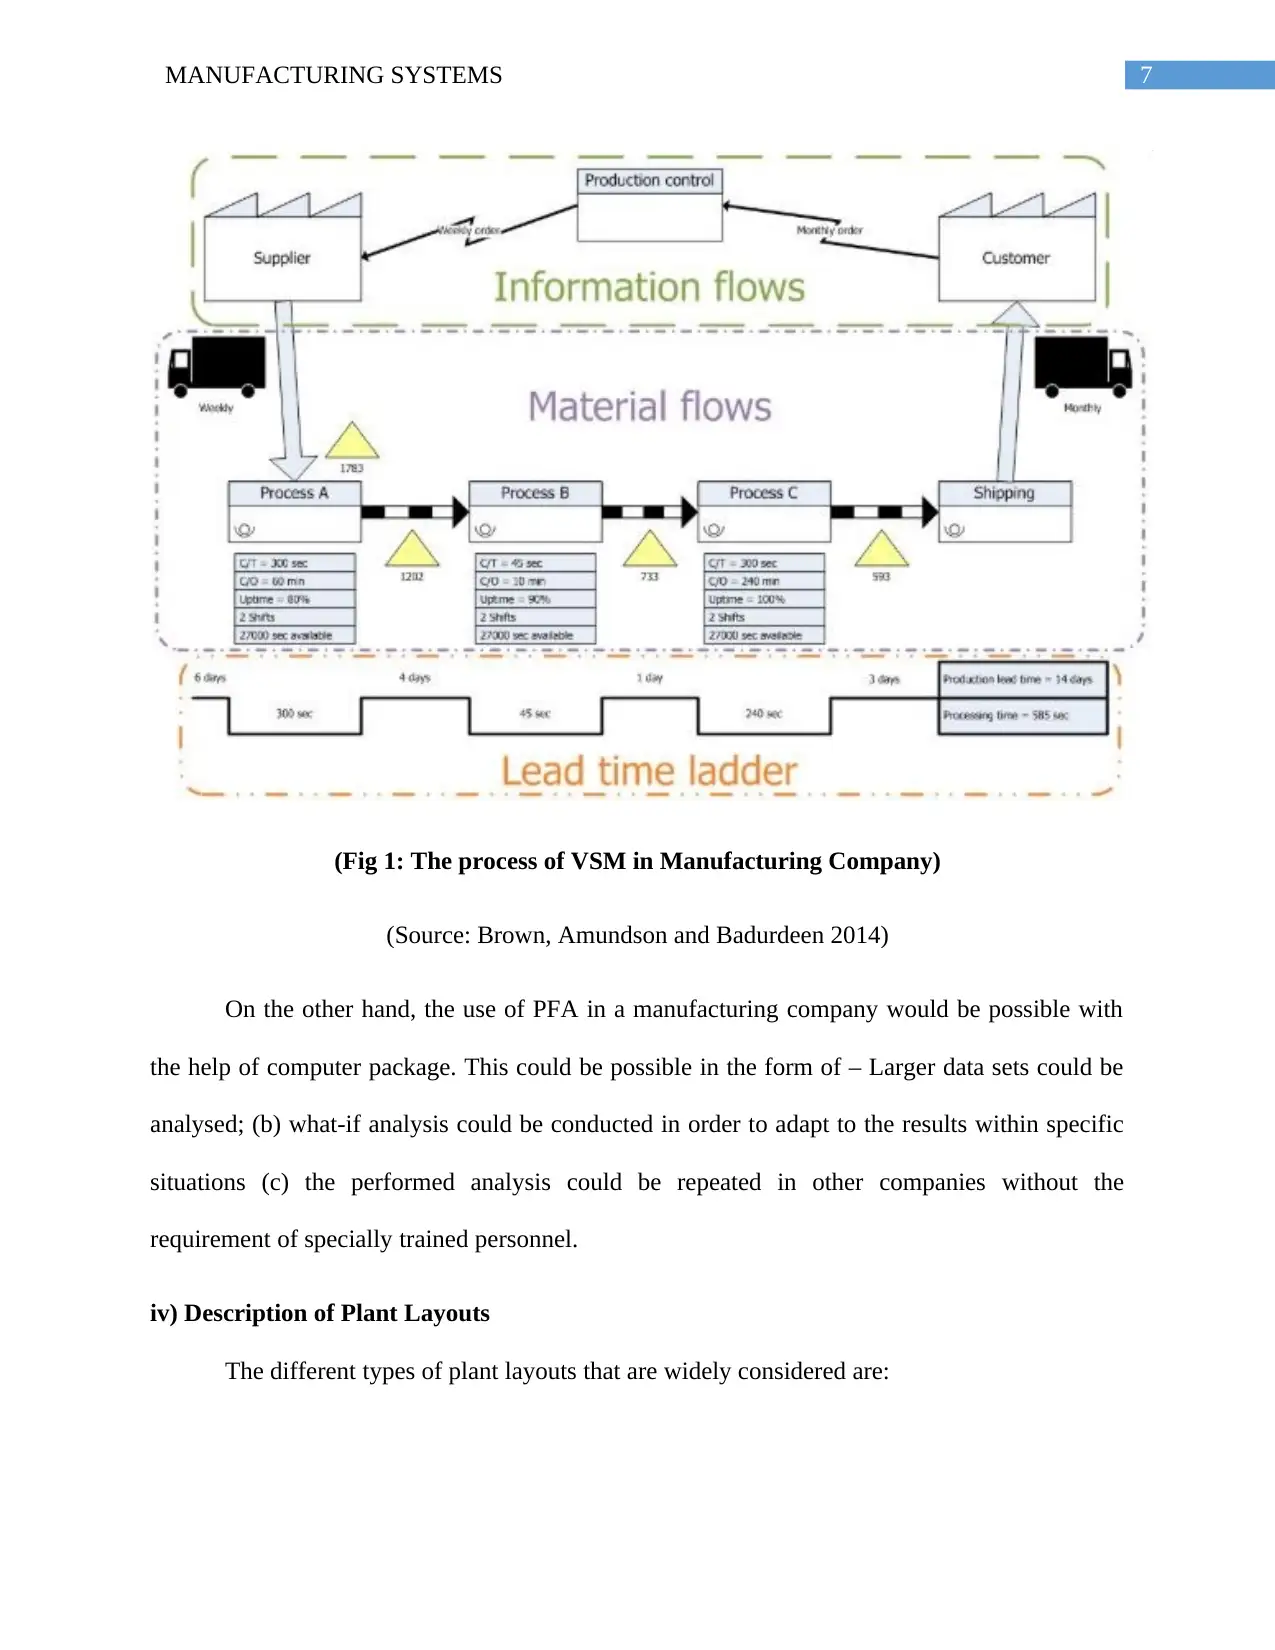
(Fig 1: The process of VSM in Manufacturing Company)
(Source: Brown, Amundson and Badurdeen 2014)
On the other hand, the use of PFA in a manufacturing company would be possible with
the help of computer package. This could be possible in the form of – Larger data sets could be
analysed; (b) what-if analysis could be conducted in order to adapt to the results within specific
situations (c) the performed analysis could be repeated in other companies without the
requirement of specially trained personnel.
iv) Description of Plant Layouts
The different types of plant layouts that are widely considered are:
8MANUFACTURING SYSTEMS
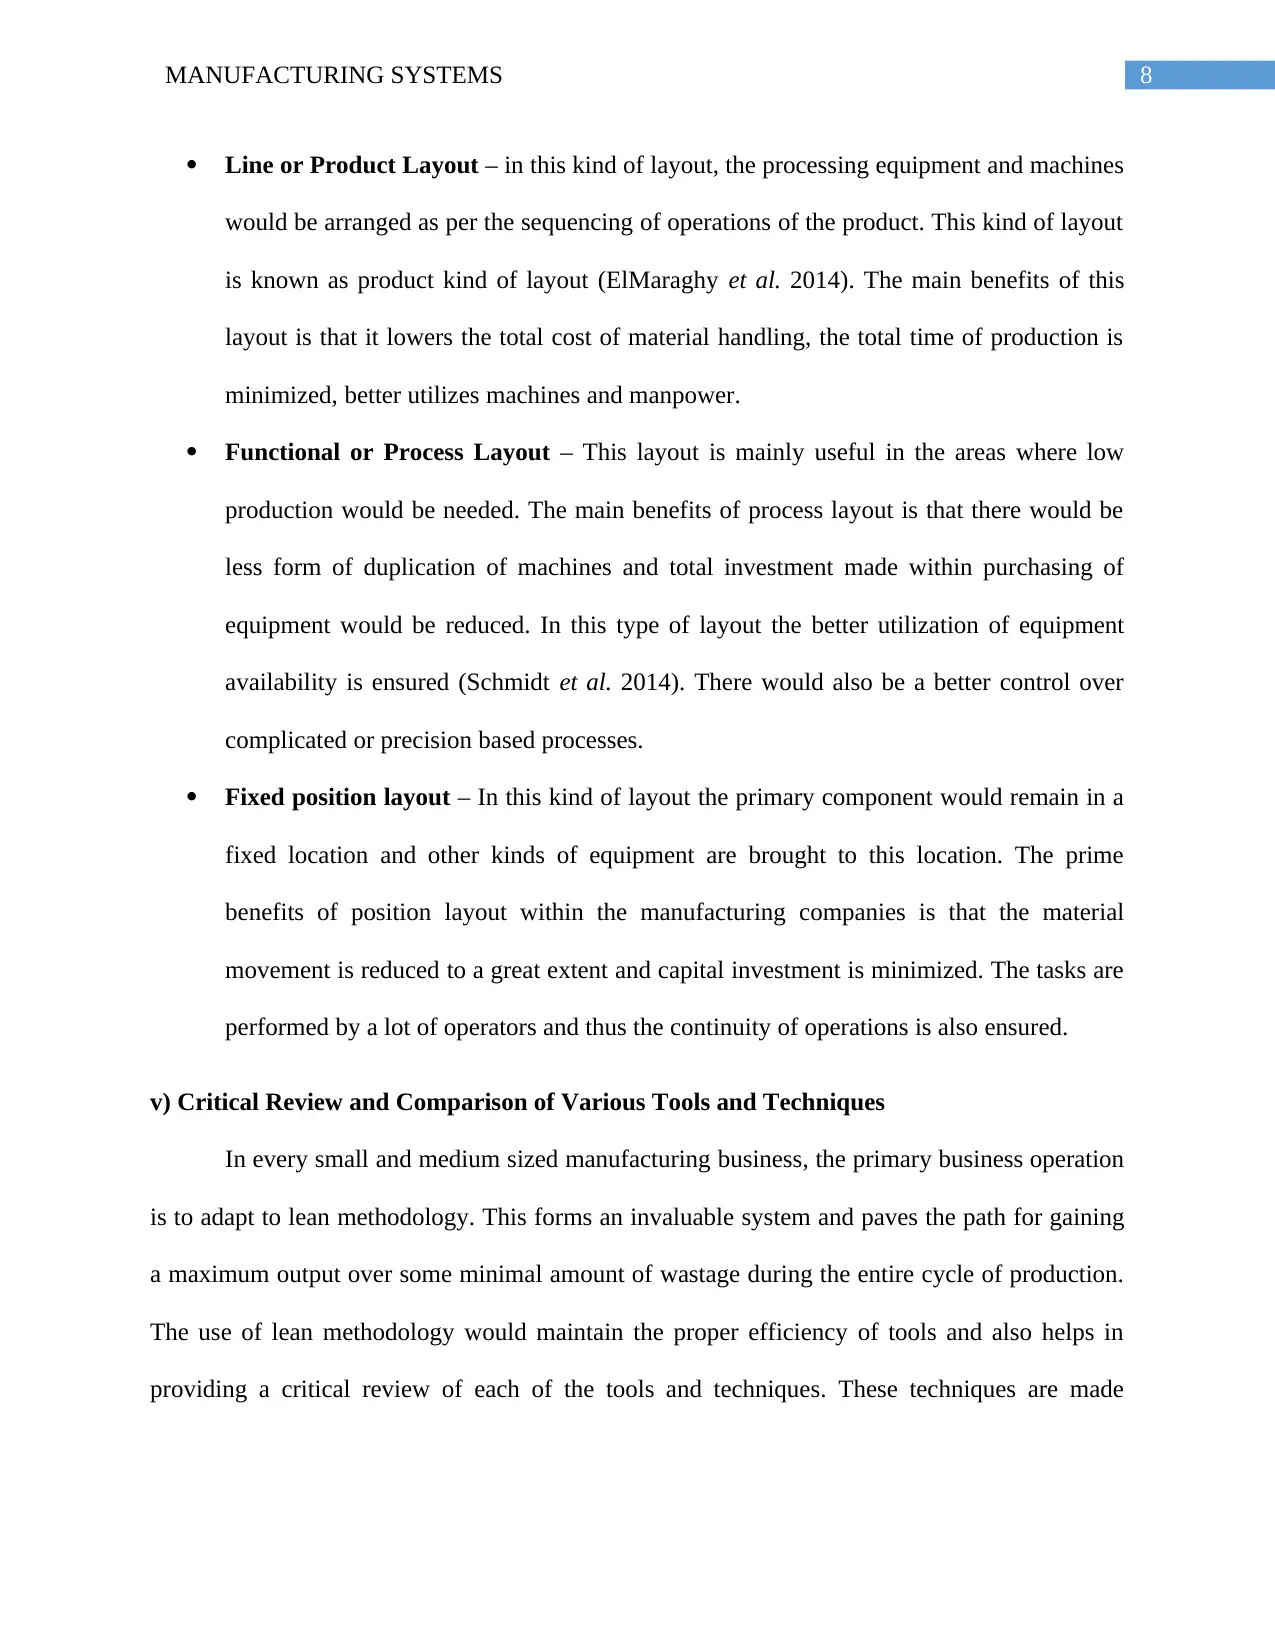
Line or Product Layout – in this kind of layout, the processing equipment and machines
would be arranged as per the sequencing of operations of the product. This kind of layout
is known as product kind of layout (ElMaraghy et al. 2014). The main benefits of this
layout is that it lowers the total cost of material handling, the total time of production is
minimized, better utilizes machines and manpower.
Functional or Process Layout – This layout is mainly useful in the areas where low
production would be needed. The main benefits of process layout is that there would be
less form of duplication of machines and total investment made within purchasing of
equipment would be reduced. In this type of layout the better utilization of equipment
availability is ensured (Schmidt et al. 2014). There would also be a better control over
complicated or precision based processes.
Fixed position layout – In this kind of layout the primary component would remain in a
fixed location and other kinds of equipment are brought to this location. The prime
benefits of position layout within the manufacturing companies is that the material
movement is reduced to a great extent and capital investment is minimized. The tasks are
performed by a lot of operators and thus the continuity of operations is also ensured.
v) Critical Review and Comparison of Various Tools and Techniques
In every small and medium sized manufacturing business, the primary business operation
is to adapt to lean methodology. This forms an invaluable system and paves the path for gaining
a maximum output over some minimal amount of wastage during the entire cycle of production.
The use of lean methodology would maintain the proper efficiency of tools and also helps in
providing a critical review of each of the tools and techniques. These techniques are made
⊘ This is a preview!⊘
Do you want full access?
Subscribe today to unlock all pages.
Trusted by 1+ million students worldwide
9MANUFACTURING SYSTEMS
available for the purpose of improvement of processes within the primary scope of lean
manufacturing systems:
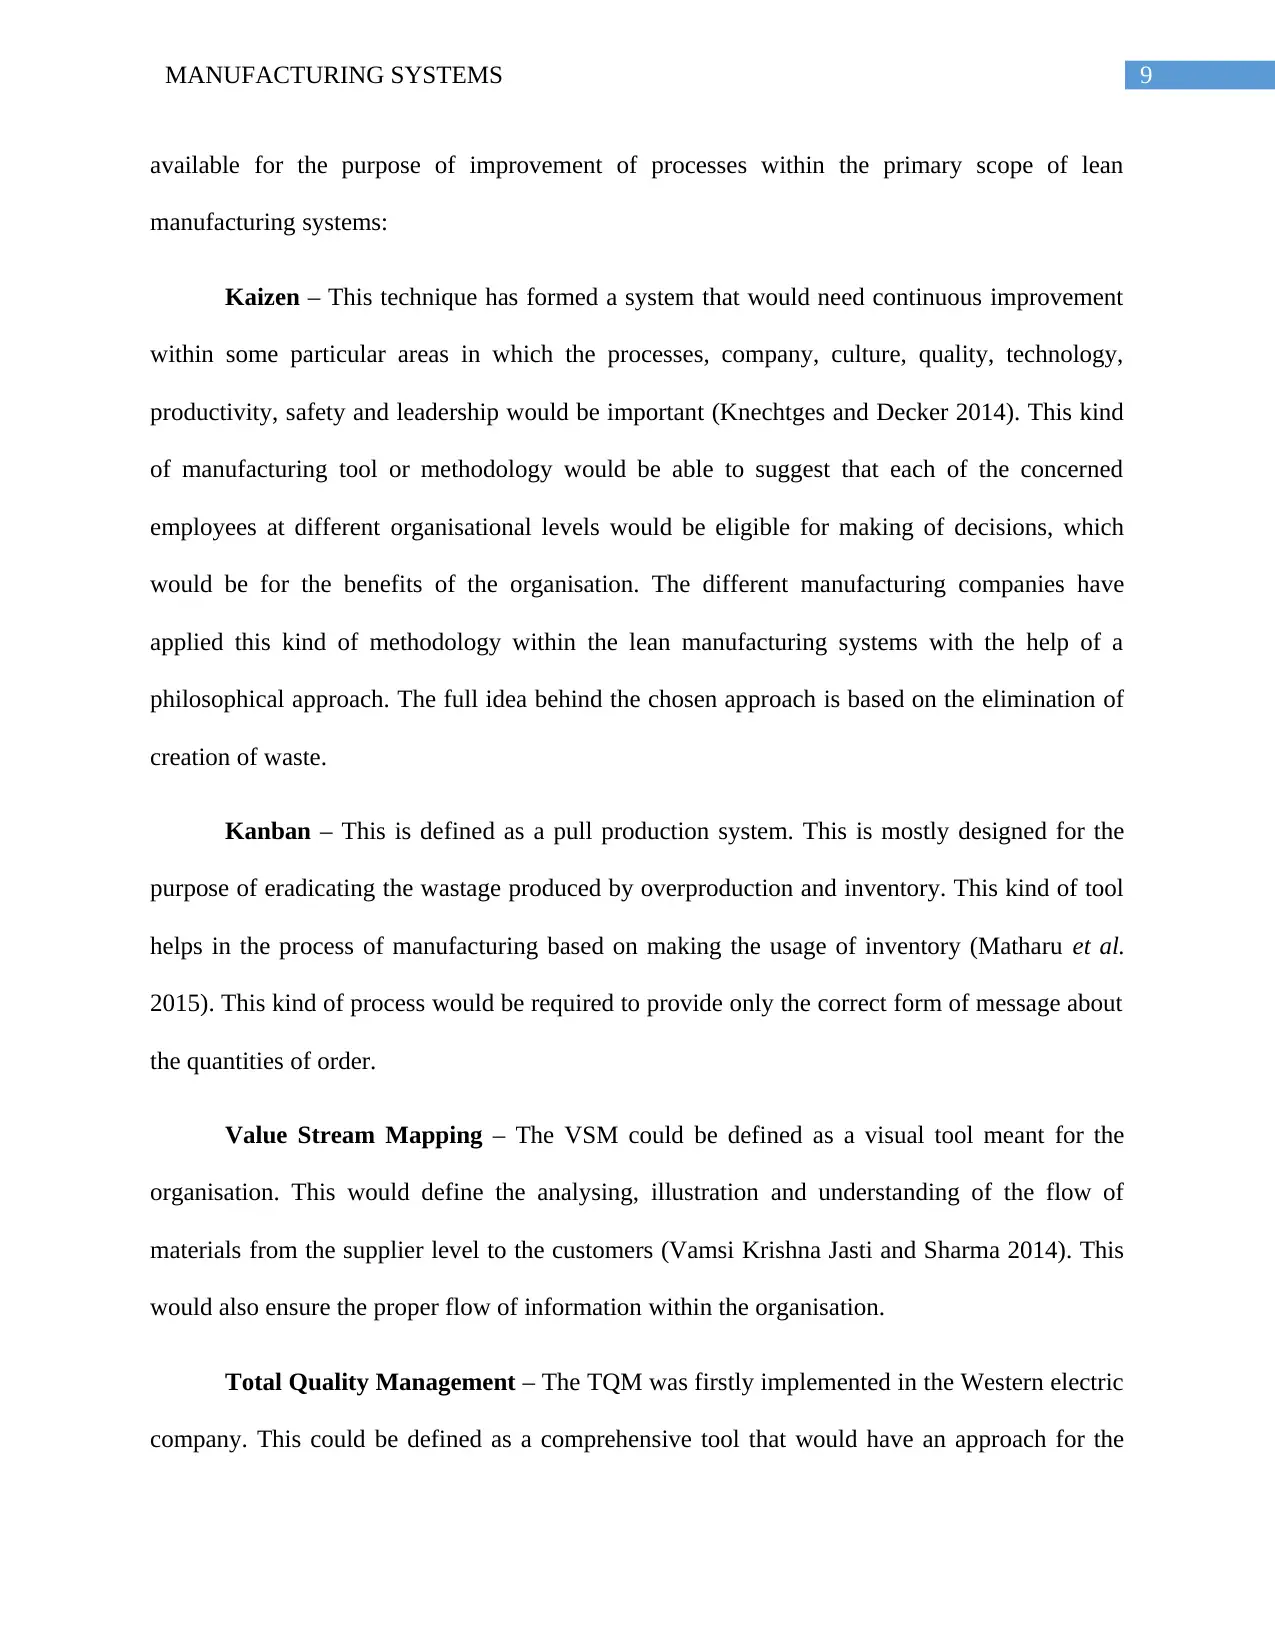
Kaizen – This technique has formed a system that would need continuous improvement
within some particular areas in which the processes, company, culture, quality, technology,
productivity, safety and leadership would be important (Knechtges and Decker 2014). This kind
of manufacturing tool or methodology would be able to suggest that each of the concerned
employees at different organisational levels would be eligible for making of decisions, which
would be for the benefits of the organisation. The different manufacturing companies have
applied this kind of methodology within the lean manufacturing systems with the help of a
philosophical approach. The full idea behind the chosen approach is based on the elimination of
creation of waste.
Kanban – This is defined as a pull production system. This is mostly designed for the
purpose of eradicating the wastage produced by overproduction and inventory. This kind of tool
helps in the process of manufacturing based on making the usage of inventory (Matharu et al.
2015). This kind of process would be required to provide only the correct form of message about
the quantities of order.
Value Stream Mapping – The VSM could be defined as a visual tool meant for the
organisation. This would define the analysing, illustration and understanding of the flow of
materials from the supplier level to the customers (Vamsi Krishna Jasti and Sharma 2014). This
would also ensure the proper flow of information within the organisation.
Total Quality Management – The TQM was firstly implemented in the Western electric
company. This could be defined as a comprehensive tool that would have an approach for the
available for the purpose of improvement of processes within the primary scope of lean
manufacturing systems:
Kaizen – This technique has formed a system that would need continuous improvement
within some particular areas in which the processes, company, culture, quality, technology,
productivity, safety and leadership would be important (Knechtges and Decker 2014). This kind
of manufacturing tool or methodology would be able to suggest that each of the concerned
employees at different organisational levels would be eligible for making of decisions, which
would be for the benefits of the organisation. The different manufacturing companies have
applied this kind of methodology within the lean manufacturing systems with the help of a
philosophical approach. The full idea behind the chosen approach is based on the elimination of
creation of waste.
Kanban – This is defined as a pull production system. This is mostly designed for the
purpose of eradicating the wastage produced by overproduction and inventory. This kind of tool
helps in the process of manufacturing based on making the usage of inventory (Matharu et al.
2015). This kind of process would be required to provide only the correct form of message about
the quantities of order.
Value Stream Mapping – The VSM could be defined as a visual tool meant for the
organisation. This would define the analysing, illustration and understanding of the flow of
materials from the supplier level to the customers (Vamsi Krishna Jasti and Sharma 2014). This
would also ensure the proper flow of information within the organisation.
Total Quality Management – The TQM was firstly implemented in the Western electric
company. This could be defined as a comprehensive tool that would have an approach for the
Paraphrase This Document
Need a fresh take? Get an instant paraphrase of this document with our AI Paraphraser
10MANUFACTURING SYSTEMS
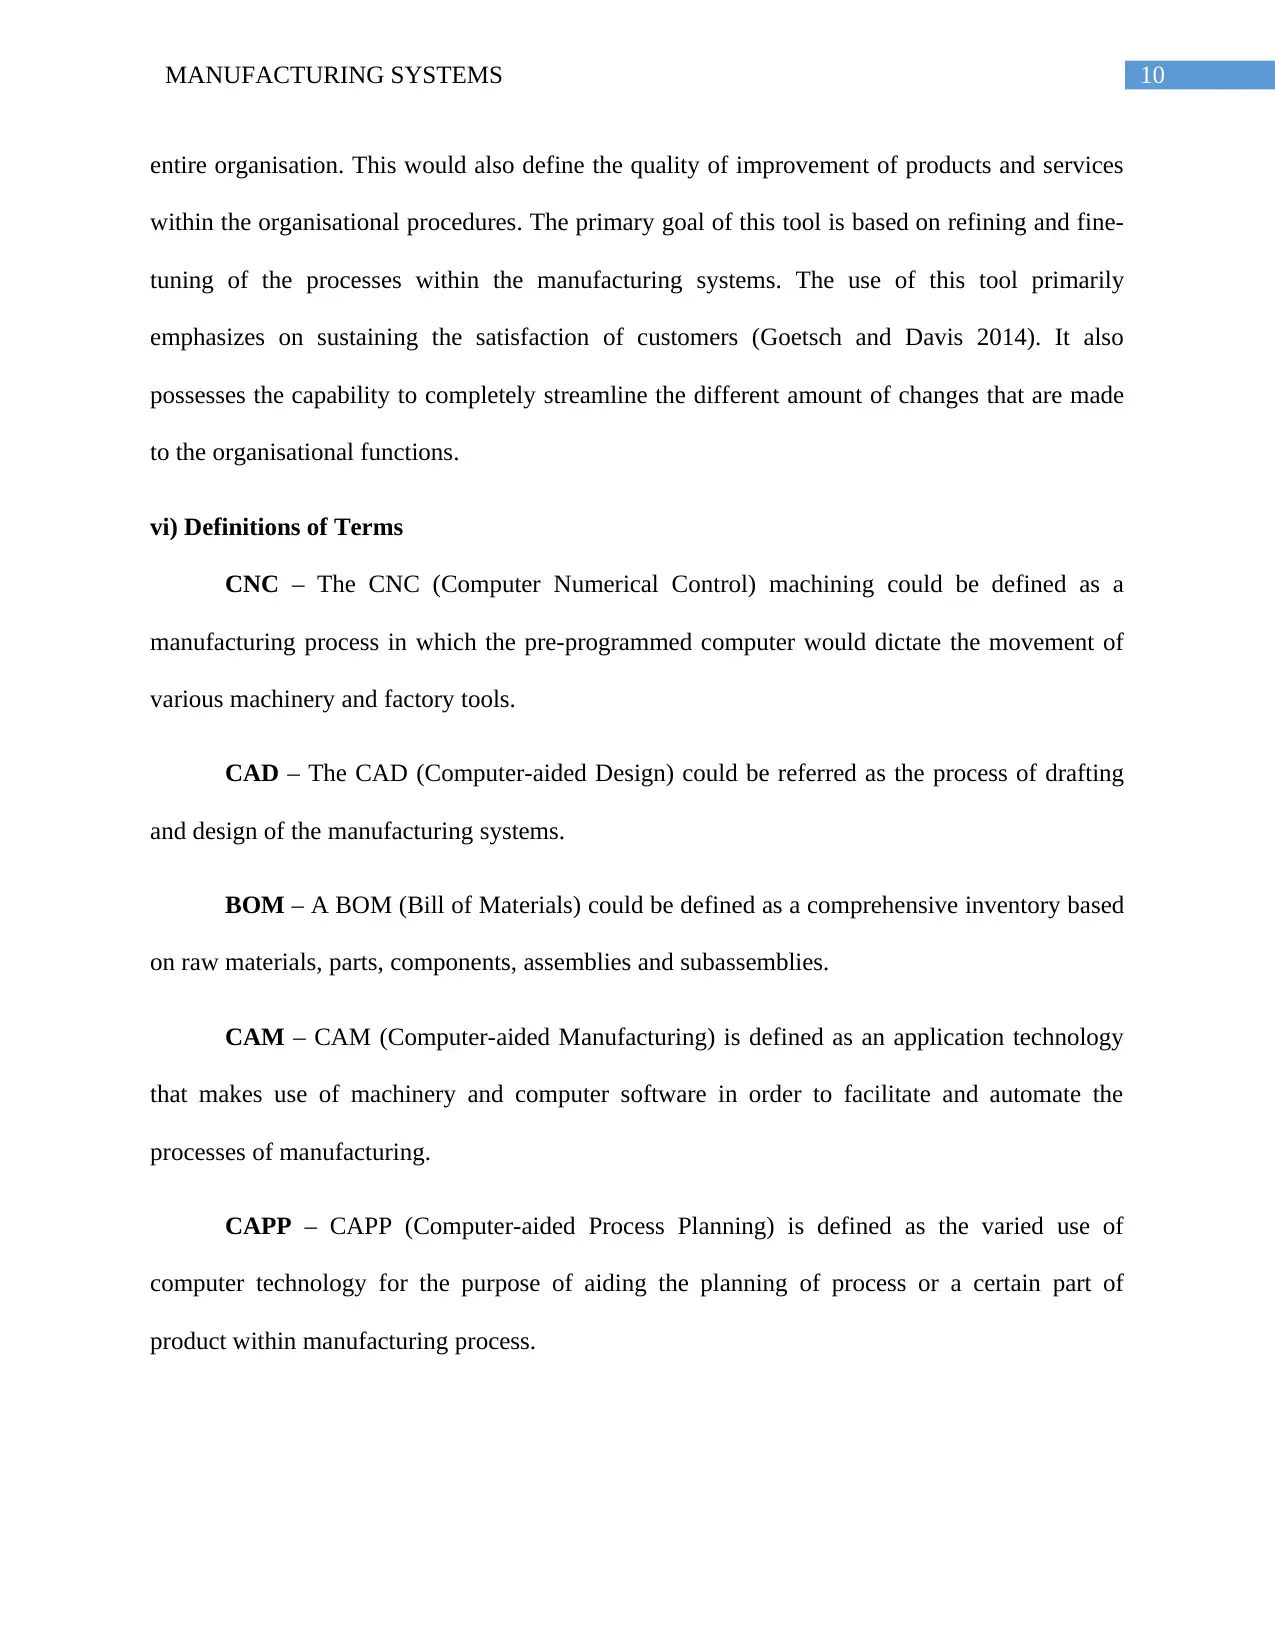
entire organisation. This would also define the quality of improvement of products and services
within the organisational procedures. The primary goal of this tool is based on refining and fine-
tuning of the processes within the manufacturing systems. The use of this tool primarily
emphasizes on sustaining the satisfaction of customers (Goetsch and Davis 2014). It also
possesses the capability to completely streamline the different amount of changes that are made
to the organisational functions.
vi) Definitions of Terms
CNC – The CNC (Computer Numerical Control) machining could be defined as a
manufacturing process in which the pre-programmed computer would dictate the movement of
various machinery and factory tools.
CAD – The CAD (Computer-aided Design) could be referred as the process of drafting
and design of the manufacturing systems.
BOM – A BOM (Bill of Materials) could be defined as a comprehensive inventory based
on raw materials, parts, components, assemblies and subassemblies.
CAM – CAM (Computer-aided Manufacturing) is defined as an application technology
that makes use of machinery and computer software in order to facilitate and automate the
processes of manufacturing.
CAPP – CAPP (Computer-aided Process Planning) is defined as the varied use of
computer technology for the purpose of aiding the planning of process or a certain part of
product within manufacturing process.
11MANUFACTURING SYSTEMS
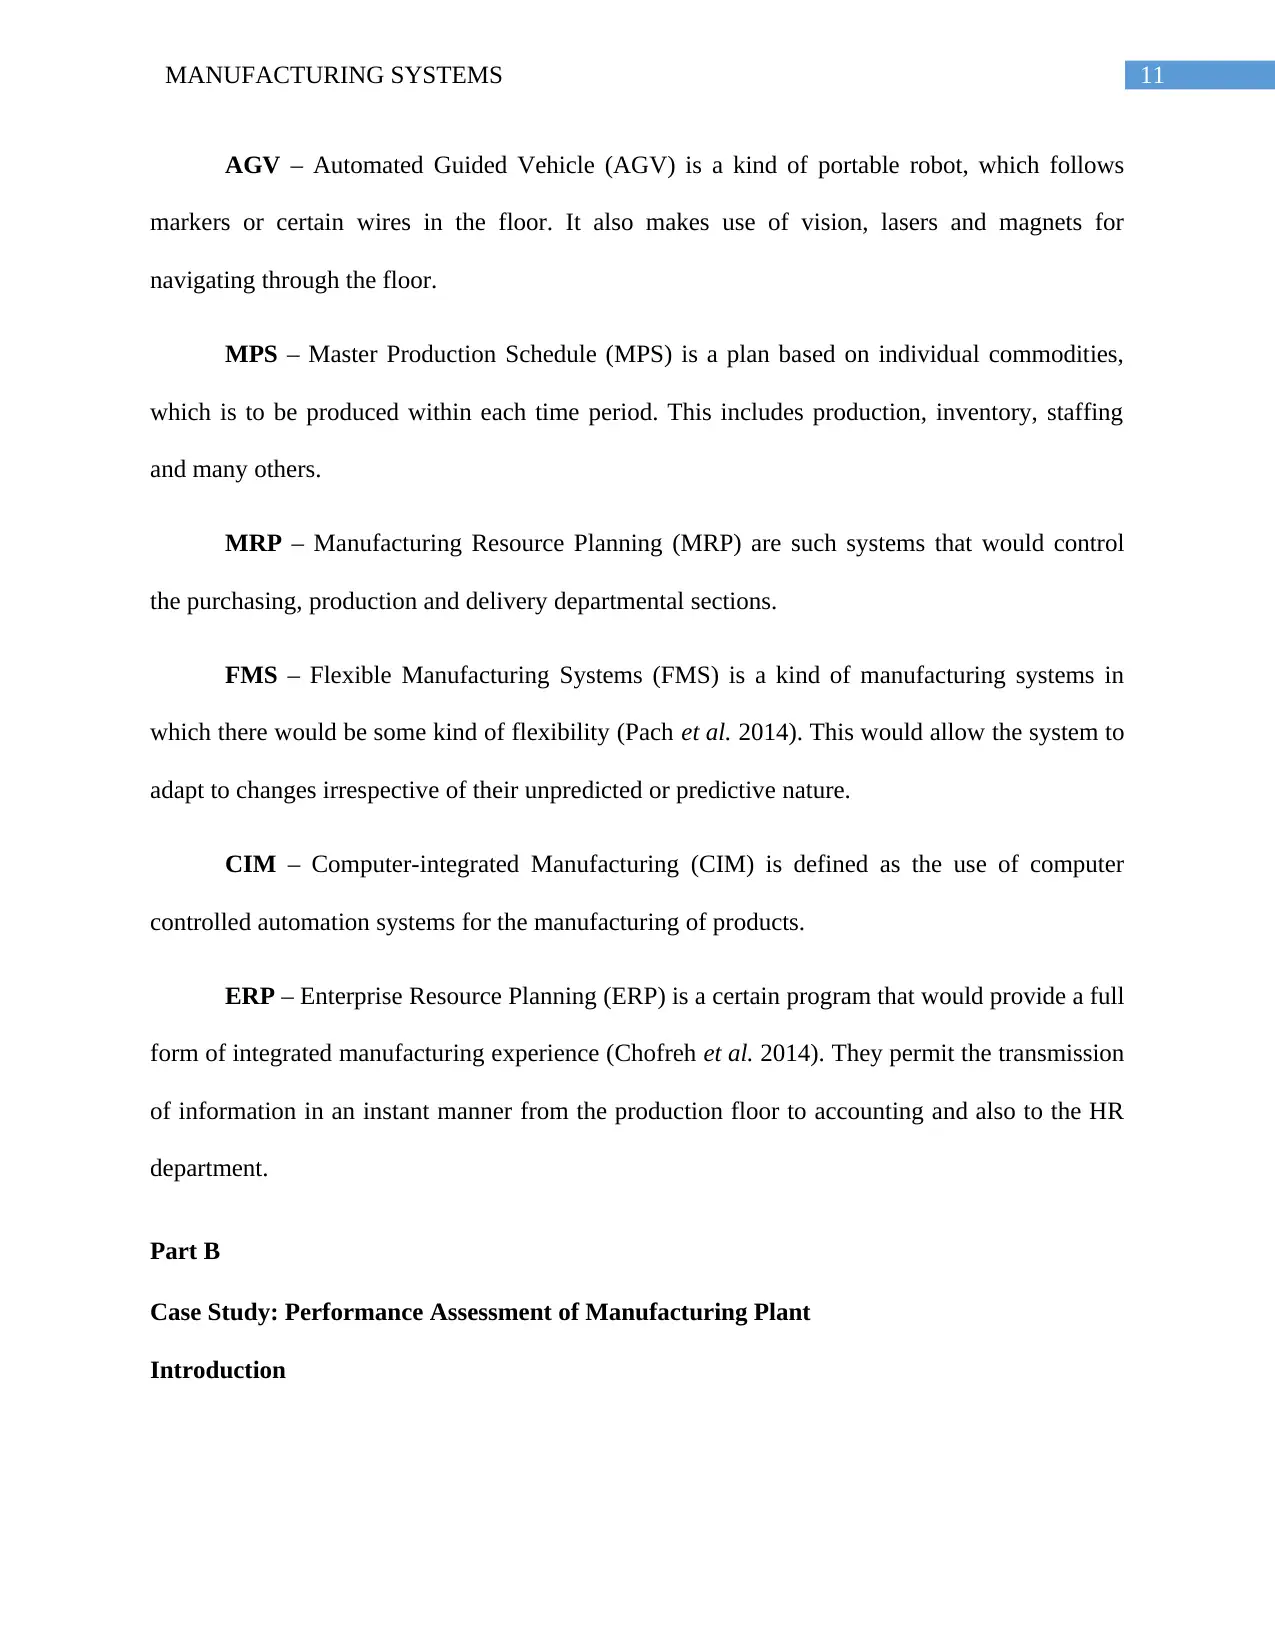
AGV – Automated Guided Vehicle (AGV) is a kind of portable robot, which follows
markers or certain wires in the floor. It also makes use of vision, lasers and magnets for
navigating through the floor.
MPS – Master Production Schedule (MPS) is a plan based on individual commodities,
which is to be produced within each time period. This includes production, inventory, staffing
and many others.
MRP – Manufacturing Resource Planning (MRP) are such systems that would control
the purchasing, production and delivery departmental sections.
FMS – Flexible Manufacturing Systems (FMS) is a kind of manufacturing systems in
which there would be some kind of flexibility (Pach et al. 2014). This would allow the system to
adapt to changes irrespective of their unpredicted or predictive nature.
CIM – Computer-integrated Manufacturing (CIM) is defined as the use of computer
controlled automation systems for the manufacturing of products.
ERP – Enterprise Resource Planning (ERP) is a certain program that would provide a full
form of integrated manufacturing experience (Chofreh et al. 2014). They permit the transmission
of information in an instant manner from the production floor to accounting and also to the HR
department.
Part B
Case Study: Performance Assessment of Manufacturing Plant
Introduction
⊘ This is a preview!⊘
Do you want full access?
Subscribe today to unlock all pages.
Trusted by 1+ million students worldwide
1 out of 23
Related Documents


Your All-in-One AI-Powered Toolkit for Academic Success.
+13062052269
info@desklib.com
Available 24*7 on WhatsApp / Email
![[object Object]](/_next/static/media/star-bottom.7253800d.svg)
Unlock your academic potential
Copyright © 2020–2026 A2Z Services. All Rights Reserved. Developed and managed by ZUCOL.