MAP4C - Characteristics of Linear Functions Assignment, Lesson 12

Verified

Added on  2022/09/08

|7
|1809
|34
Homework Assignment
AI Summary
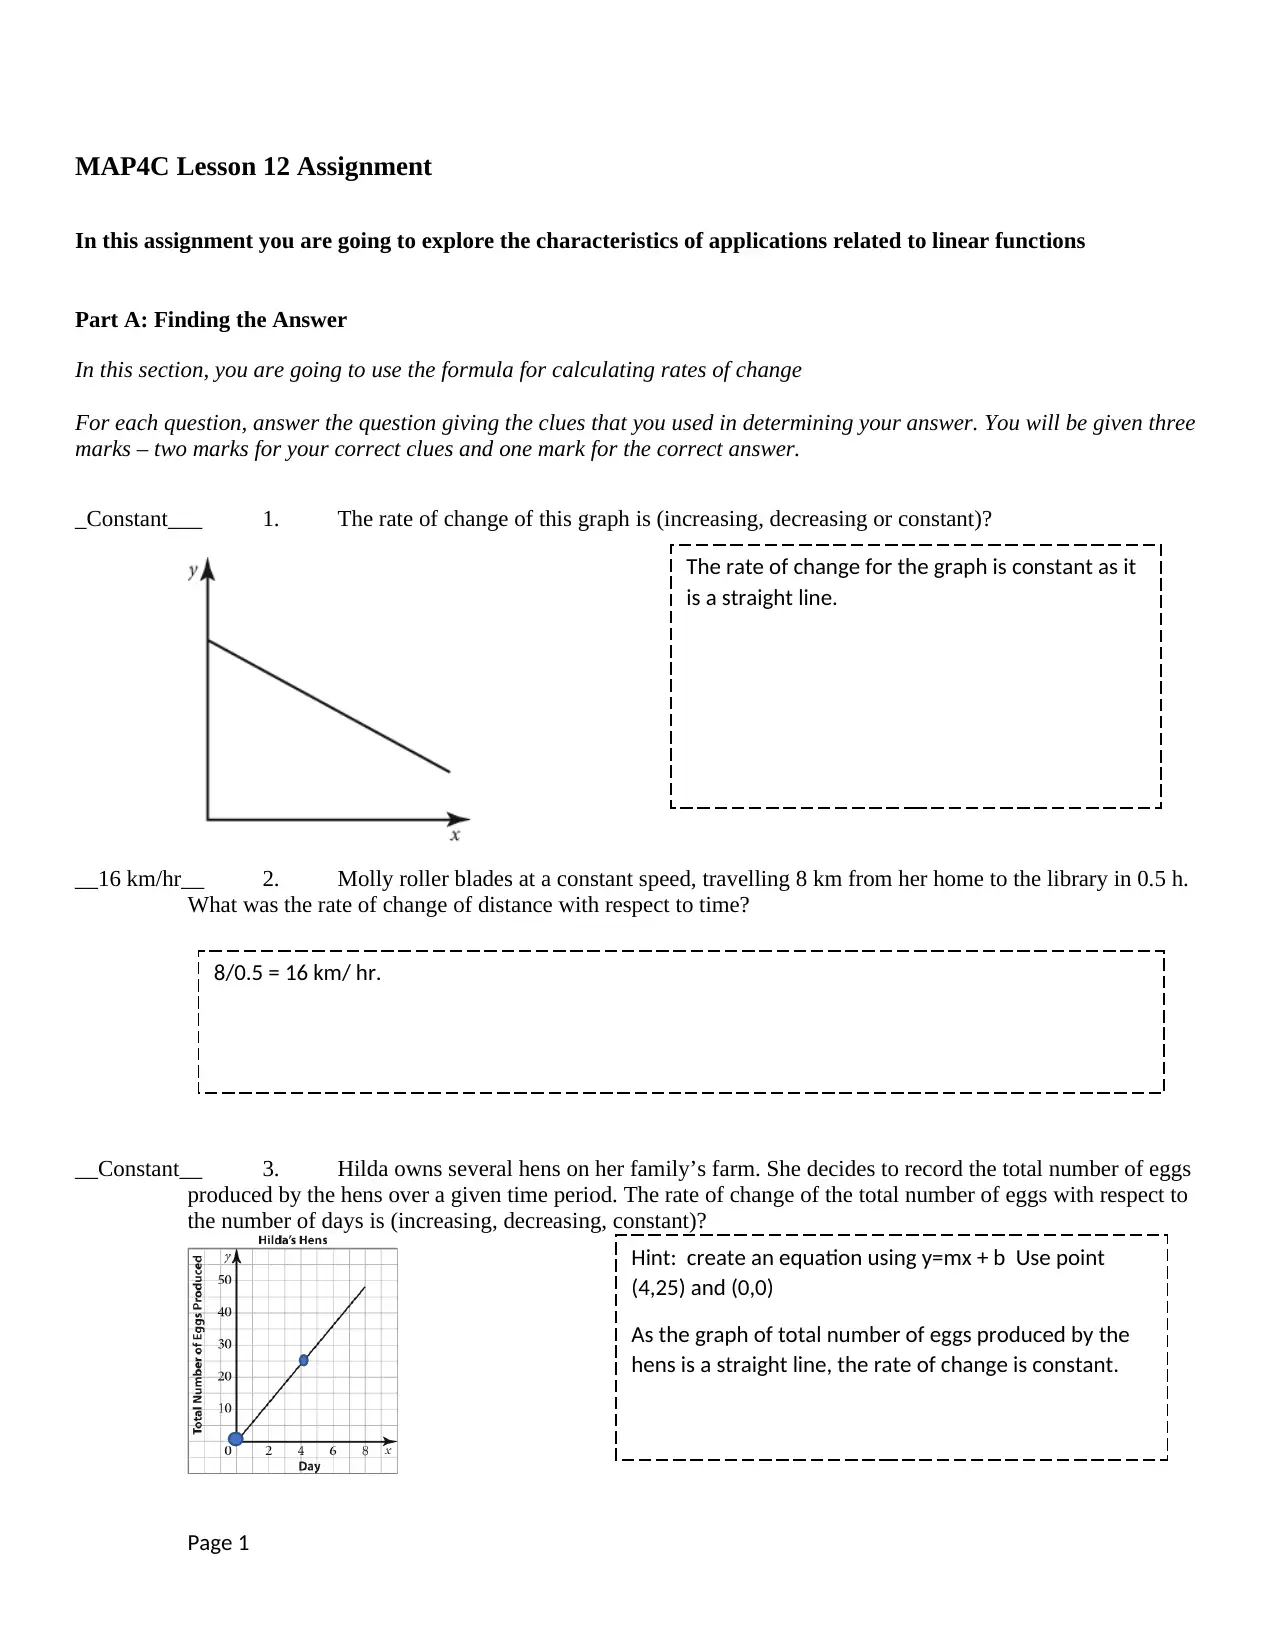
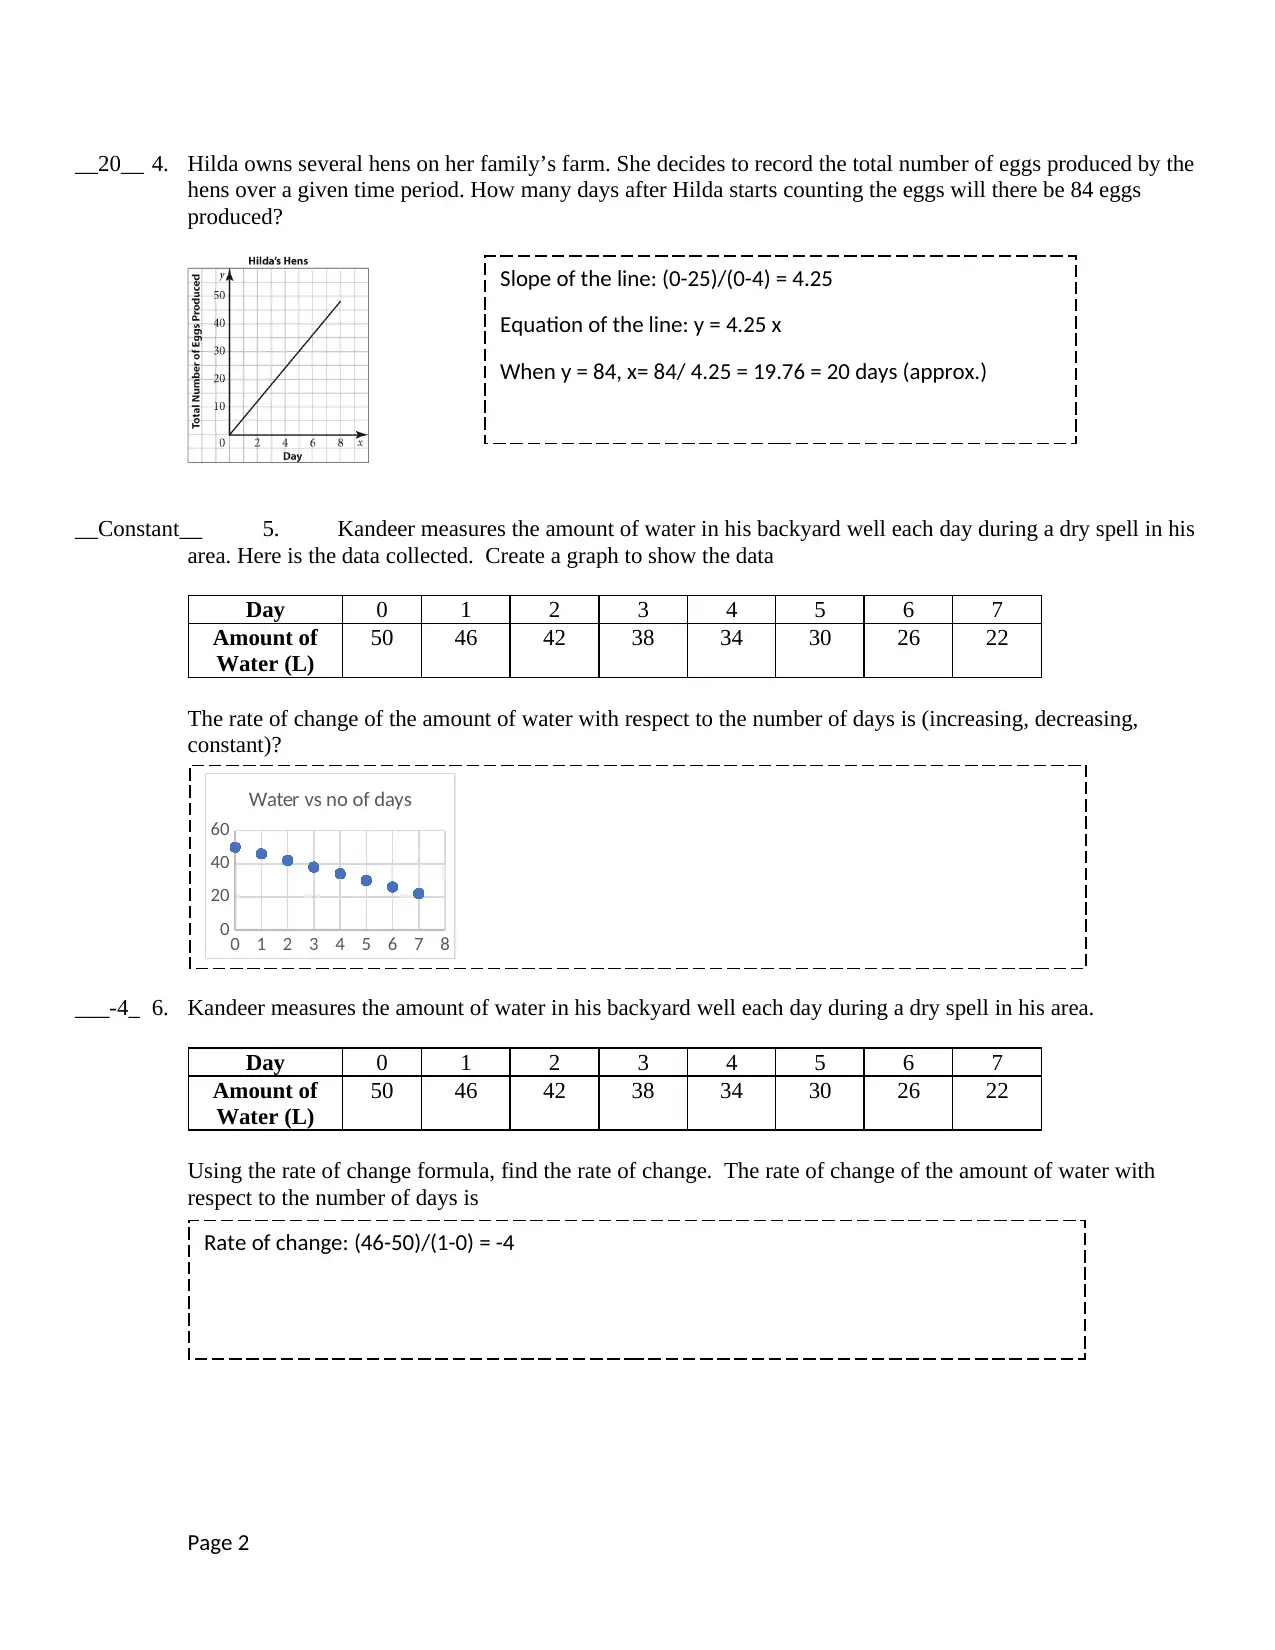
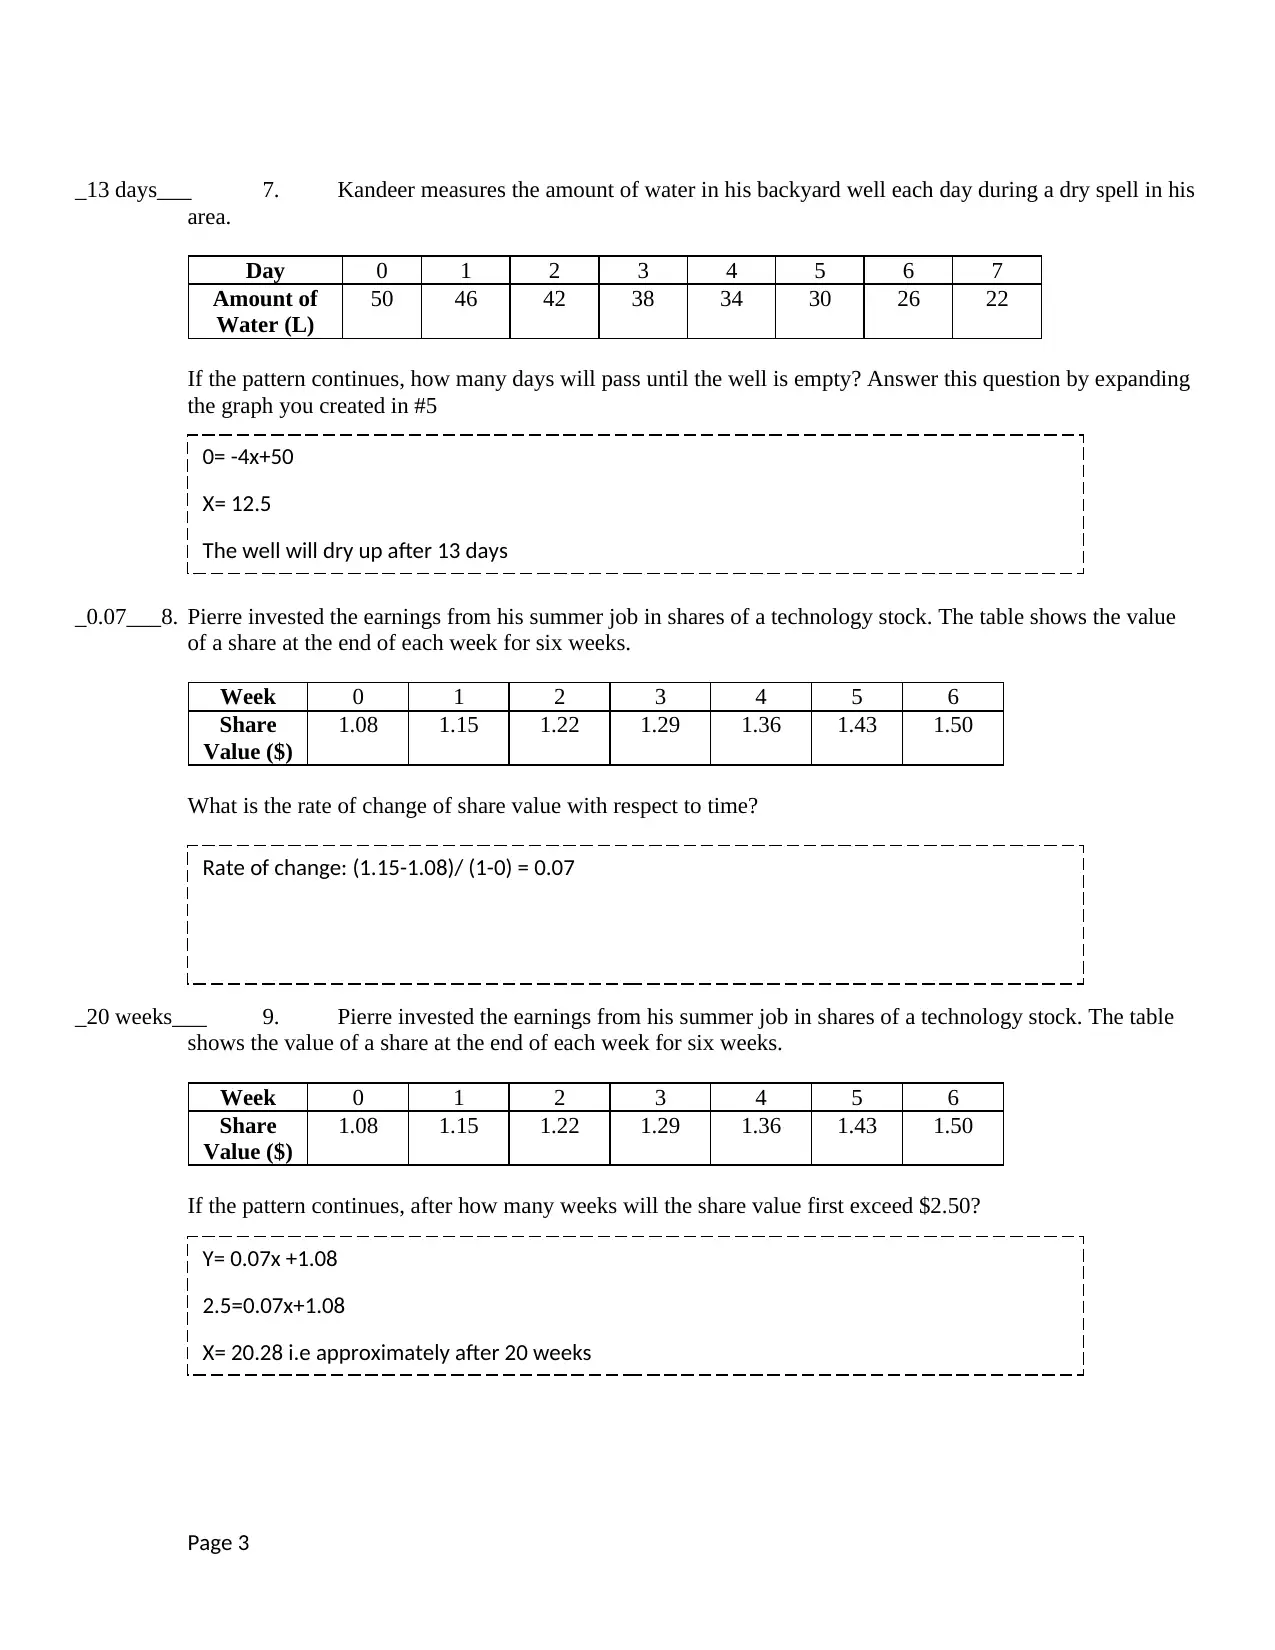
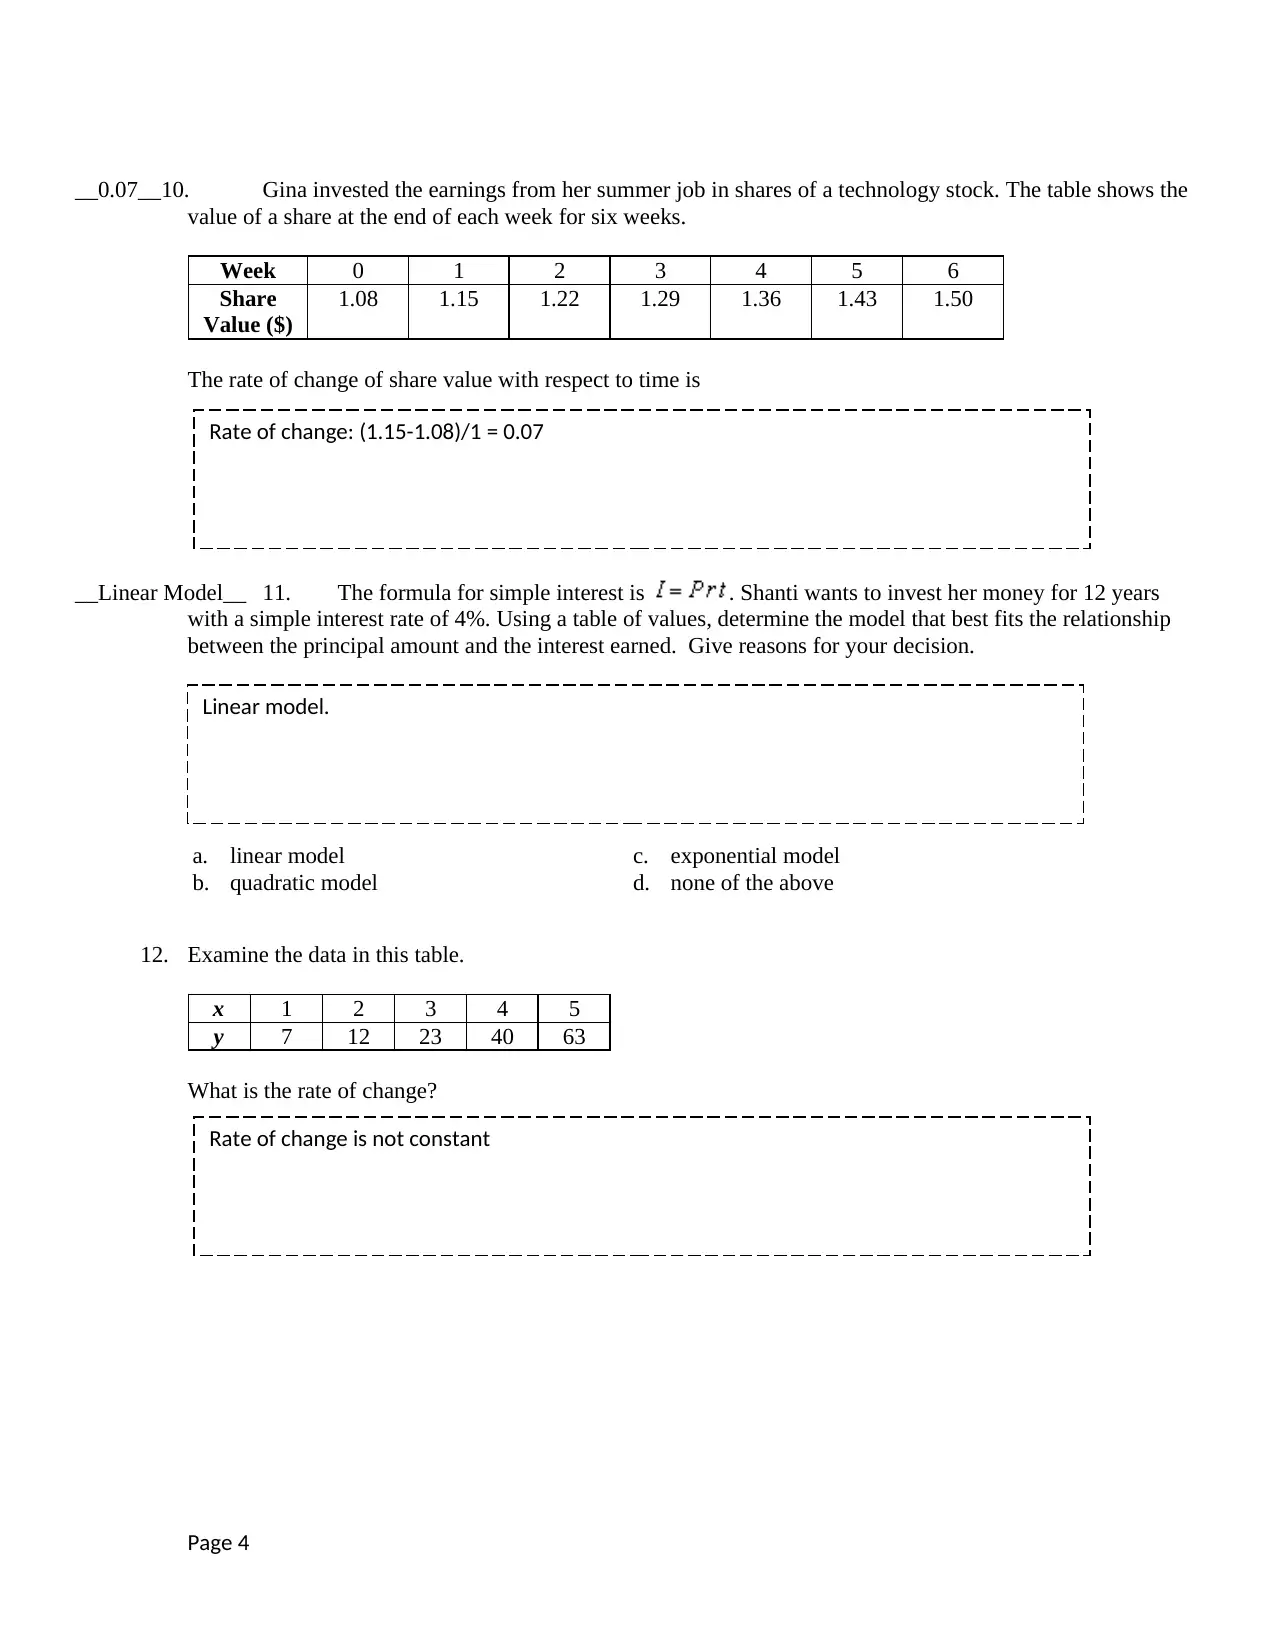
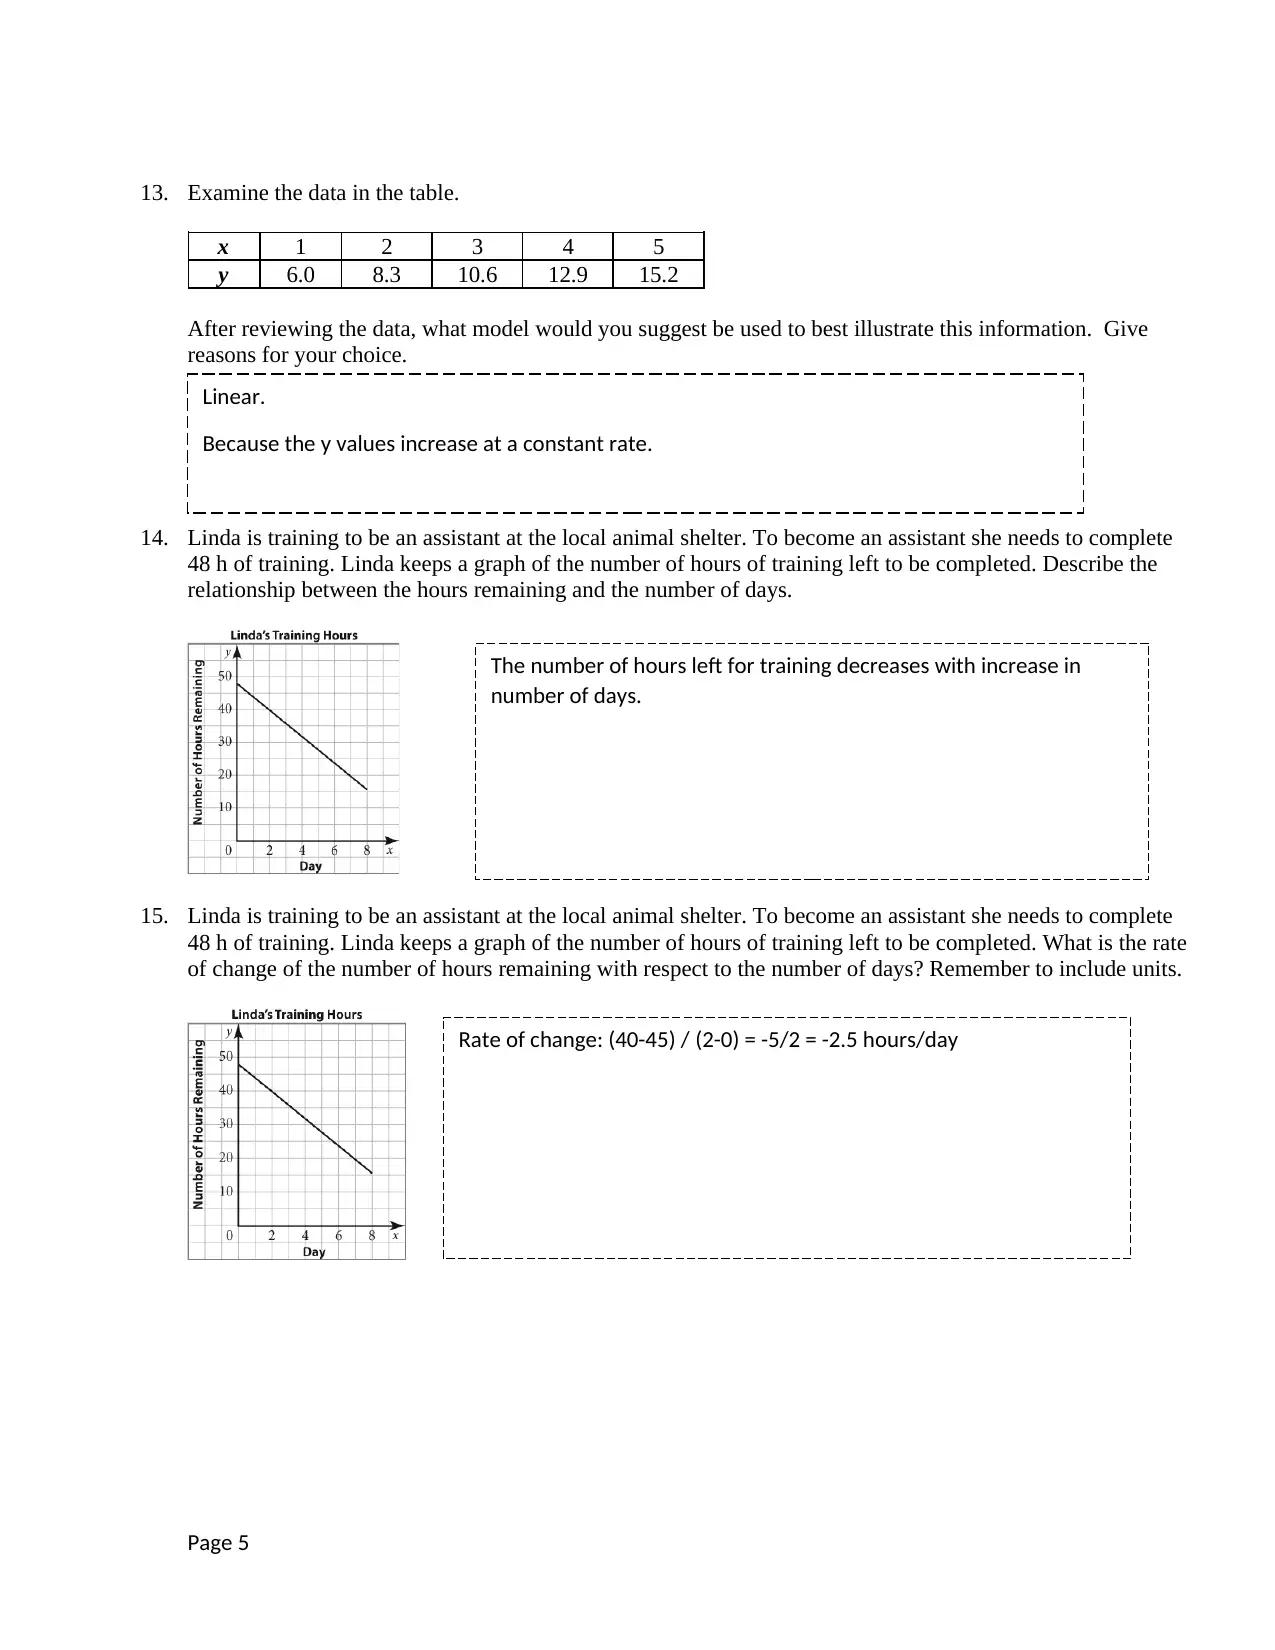
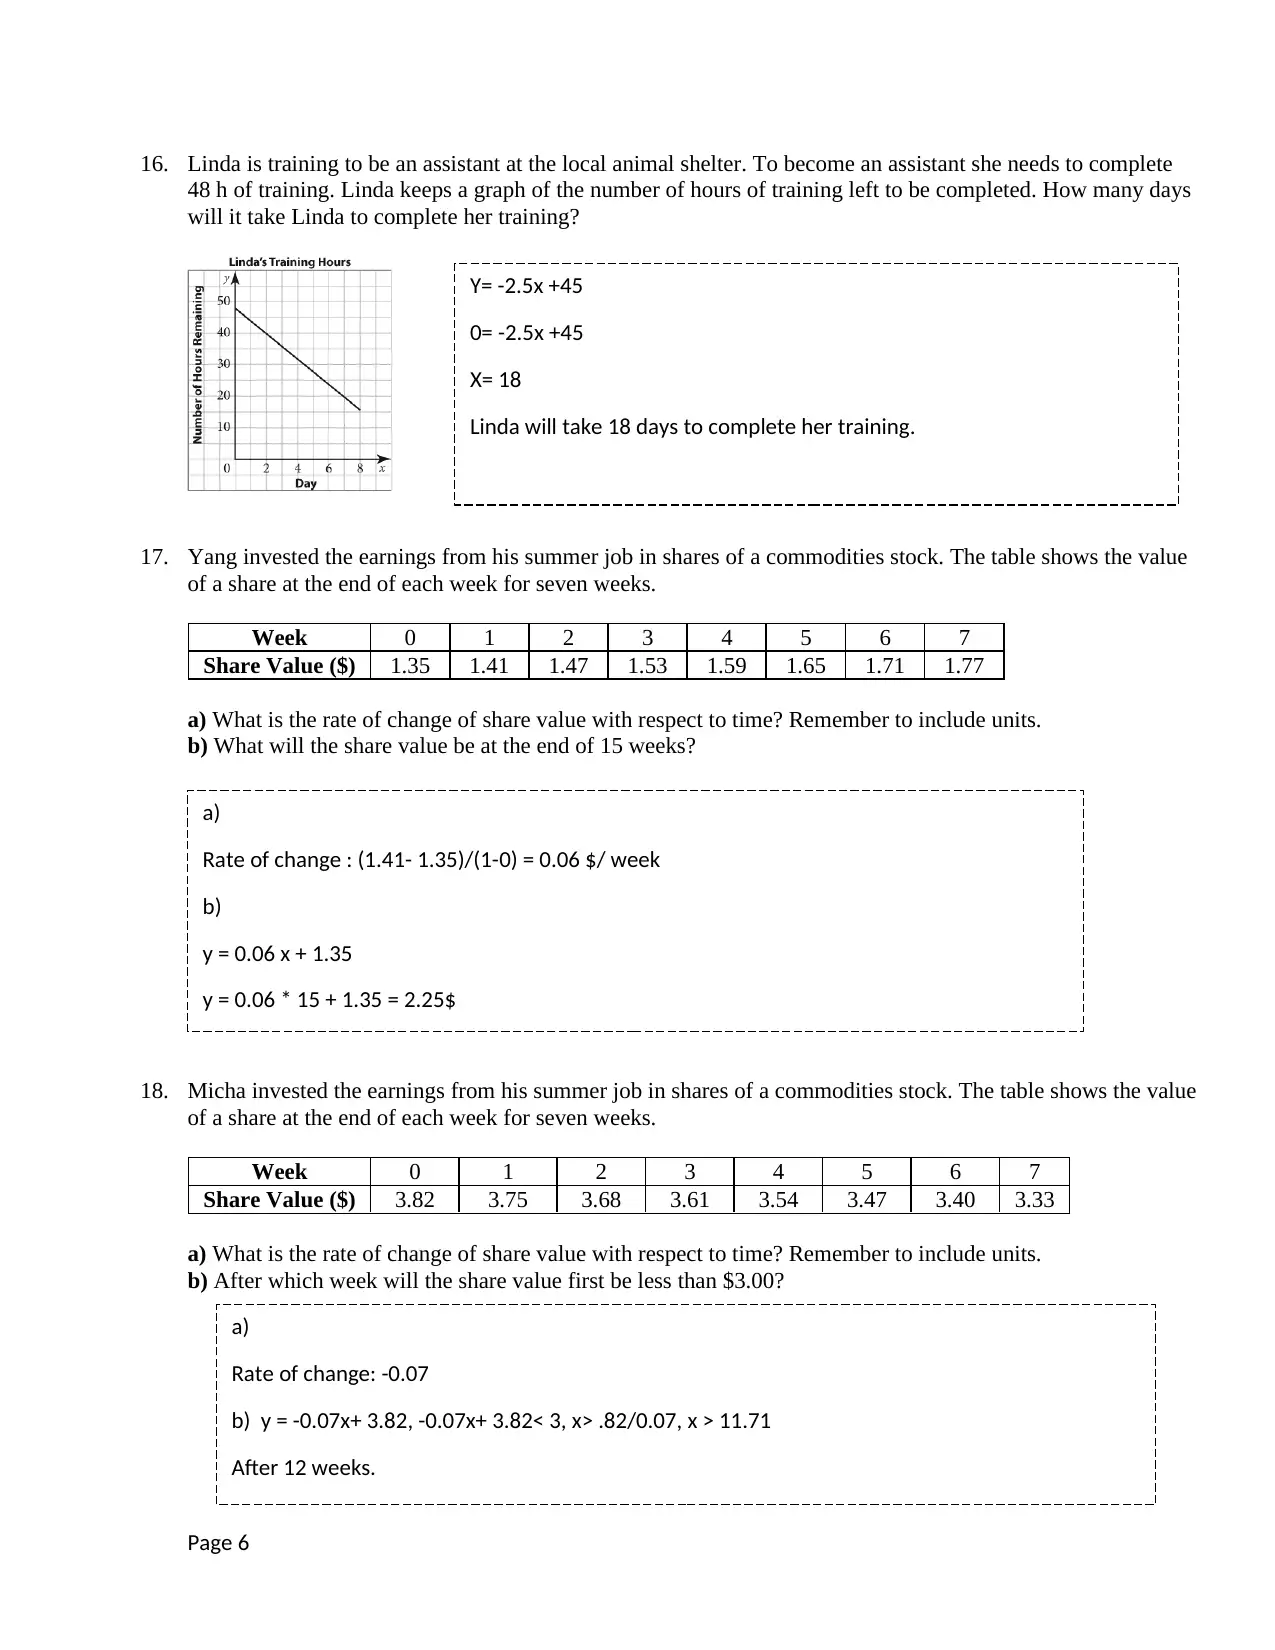
This assignment focuses on exploring the characteristics and applications of linear functions. It includes problems involving calculating the rate of change from graphs and data, determining whether the rate of change is constant, increasing, or decreasing, and solving real-world problems related to linear relationships. The assignment covers topics such as calculating speed, analyzing egg production, measuring water levels in a well, and evaluating stock values. Students are required to provide answers along with the clues used in determining the answers. The assignment also includes questions about identifying the best model to represent given data and solving problems related to linear functions, like determining the number of days required to complete training or when a stock value will exceed a specific amount. The document provides solutions and explanations for each question, demonstrating the application of linear function concepts in various scenarios. This assignment is designed to enhance the understanding of linear functions and their practical applications.
Document Page
MAP4C Lesson 12 Assignment
In this assignment you are going to explore the characteristics of applications related to linear functions
Part A: Finding the Answer
In this section, you are going to use the formula for calculating rates of change
For each question, answer the question giving the clues that you used in determining your answer. You will be given three
marks – two marks for your correct clues and one mark for the correct answer.
_Constant___ 1. The rate of change of this graph is (increasing, decreasing or constant)?
__16 km/hr__ 2. Molly roller blades at a constant speed, travelling 8 km from her home to the library in 0.5 h.
What was the rate of change of distance with respect to time?
__Constant__ 3. Hilda owns several hens on her family’s farm. She decides to record the total number of eggs
produced by the hens over a given time period. The rate of change of the total number of eggs with respect to
the number of days is (increasing, decreasing, constant)?
Page 1
The rate of change for the graph is constant as it
is a straight line.
8/0.5 = 16 km/ hr.
Hint: create an equation using y=mx + b Use point
(4,25) and (0,0)
As the graph of total number of eggs produced by the
hens is a straight line, the rate of change is constant.
tabler-icon-diamond-filled.svg

Secure Best Marks with AI Grader

Need help grading? Try our AI Grader for instant feedback on your assignments.
Document Page
__20__ 4. Hilda owns several hens on her family’s farm. She decides to record the total number of eggs produced by the
hens over a given time period. How many days after Hilda starts counting the eggs will there be 84 eggs
produced?
__Constant__ 5. Kandeer measures the amount of water in his backyard well each day during a dry spell in his
area. Here is the data collected. Create a graph to show the data
Day 0 1 2 3 4 5 6 7
Amount of
Water (L)
50 46 42 38 34 30 26 22
The rate of change of the amount of water with respect to the number of days is (increasing, decreasing,
constant)?
___-4_ 6. Kandeer measures the amount of water in his backyard well each day during a dry spell in his area.
Day 0 1 2 3 4 5 6 7
Amount of
Water (L)
50 46 42 38 34 30 26 22
Using the rate of change formula, find the rate of change. The rate of change of the amount of water with
respect to the number of days is
Page 2
Slope of the line: (0-25)/(0-4) = 4.25
Equation of the line: y = 4.25 x
When y = 84, x= 84/ 4.25 = 19.76 = 20 days (approx.)
0 1 2 3 4 5 6 7 8
0
20
40
60
Water vs no of days
Rate of change: (46-50)/(1-0) = -4
Document Page
_13 days___ 7. Kandeer measures the amount of water in his backyard well each day during a dry spell in his
area.
Day 0 1 2 3 4 5 6 7
Amount of
Water (L)
50 46 42 38 34 30 26 22
If the pattern continues, how many days will pass until the well is empty? Answer this question by expanding
the graph you created in #5
_0.07___8. Pierre invested the earnings from his summer job in shares of a technology stock. The table shows the value
of a share at the end of each week for six weeks.
Week 0 1 2 3 4 5 6
Share
Value ($)
1.08 1.15 1.22 1.29 1.36 1.43 1.50
What is the rate of change of share value with respect to time?
_20 weeks___ 9. Pierre invested the earnings from his summer job in shares of a technology stock. The table
shows the value of a share at the end of each week for six weeks.
Week 0 1 2 3 4 5 6
Share
Value ($)
1.08 1.15 1.22 1.29 1.36 1.43 1.50
If the pattern continues, after how many weeks will the share value first exceed $2.50?
Page 3
0= -4x+50
X= 12.5
The well will dry up after 13 days
Rate of change: (1.15-1.08)/ (1-0) = 0.07
Y= 0.07x +1.08
2.5=0.07x+1.08
X= 20.28 i.e approximately after 20 weeks
Document Page
__0.07__10. Gina invested the earnings from her summer job in shares of a technology stock. The table shows the
value of a share at the end of each week for six weeks.
Week 0 1 2 3 4 5 6
Share
Value ($)
1.08 1.15 1.22 1.29 1.36 1.43 1.50
The rate of change of share value with respect to time is
__Linear Model__ 11. The formula for simple interest is . Shanti wants to invest her money for 12 years
with a simple interest rate of 4%. Using a table of values, determine the model that best fits the relationship
between the principal amount and the interest earned. Give reasons for your decision.
a. linear model c. exponential model
b. quadratic model d. none of the above
12. Examine the data in this table.
x 1 2 3 4 5
y 7 12 23 40 63
What is the rate of change?
Page 4
Rate of change: (1.15-1.08)/1 = 0.07
Linear model.
Rate of change is not constant
tabler-icon-diamond-filled.svg

Secure Best Marks with AI Grader

Need help grading? Try our AI Grader for instant feedback on your assignments.
Document Page
13. Examine the data in the table.
x 1 2 3 4 5
y 6.0 8.3 10.6 12.9 15.2
After reviewing the data, what model would you suggest be used to best illustrate this information. Give
reasons for your choice.
14. Linda is training to be an assistant at the local animal shelter. To become an assistant she needs to complete
48 h of training. Linda keeps a graph of the number of hours of training left to be completed. Describe the
relationship between the hours remaining and the number of days.
15. Linda is training to be an assistant at the local animal shelter. To become an assistant she needs to complete
48 h of training. Linda keeps a graph of the number of hours of training left to be completed. What is the rate
of change of the number of hours remaining with respect to the number of days? Remember to include units.
Page 5
Linear.
Because the y values increase at a constant rate.
The number of hours left for training decreases with increase in
number of days.
Rate of change: (40-45) / (2-0) = -5/2 = -2.5 hours/day
Document Page
16. Linda is training to be an assistant at the local animal shelter. To become an assistant she needs to complete
48 h of training. Linda keeps a graph of the number of hours of training left to be completed. How many days
will it take Linda to complete her training?
17. Yang invested the earnings from his summer job in shares of a commodities stock. The table shows the value
of a share at the end of each week for seven weeks.
Week 0 1 2 3 4 5 6 7
Share Value ($) 1.35 1.41 1.47 1.53 1.59 1.65 1.71 1.77
a) What is the rate of change of share value with respect to time? Remember to include units.
b) What will the share value be at the end of 15 weeks?
18. Micha invested the earnings from his summer job in shares of a commodities stock. The table shows the value
of a share at the end of each week for seven weeks.
Week 0 1 2 3 4 5 6 7
Share Value ($) 3.82 3.75 3.68 3.61 3.54 3.47 3.40 3.33
a) What is the rate of change of share value with respect to time? Remember to include units.
b) After which week will the share value first be less than $3.00?
Page 6
Y= -2.5x +45
0= -2.5x +45
X= 18
Linda will take 18 days to complete her training.
a)
Rate of change : (1.41- 1.35)/(1-0) = 0.06 $/ week
b)
y = 0.06 x + 1.35
y = 0.06 * 15 + 1.35 = 2.25$
a)
Rate of change: -0.07
b) y = -0.07x+ 3.82, -0.07x+ 3.82< 3, x> .82/0.07, x > 11.71
After 12 weeks.
Document Page
Page 7
chevron_up_icon
1 out of 7
circle_padding
hide_on_mobile
zoom_out_icon
logo.png

Your All-in-One AI-Powered Toolkit for Academic Success.

Available 24*7 on WhatsApp / Email

[object Object]