MAPM5029 Management Accounting and Performance: Cost & Budget Report
VerifiedAdded on 2023/04/17
|11
|2922
|239
Report
AI Summary
This management accounting report analyzes the cost and revenue structure of a cookie manufacturing business, Kkrunchies Cookies, including a break-even analysis. It details the introduction of the business, market analysis, target market size, and penetration strategies. The report discusses various funding strategies such as debts, asset financing, equity, and mortgage. It computes the break-even point by evaluating fixed and variable costs, presenting a cost structure that includes branding, staffing, fixed input costs, and variable input costs. The analysis includes considerations for attracting and retaining customers, focusing on tourists, children, local residents, and working professionals. The report uses assumptions regarding cost structure, revenue, demand, and supply to provide a comprehensive financial overview.

UNIVERSITY NAME Australia
Paraphrase This Document
Need a fresh take? Get an instant paraphrase of this document with our AI Paraphraser
Table of Contents
SECTION A...................................................................................................................................................2
(A) INTRODUCTION.................................................................................................................................2
(B) STRUCTURE OF COST AND REVENUE.................................................................................................3
(C ) BREAK EVEN ANALYSIS.....................................................................................................................5
(D) CONCLUSION.....................................................................................................................................7
SECTION B....................................................................................................................................................8
(A) COST STATEMENT..............................................................................................................................8
(B) OPERATING BUDGET.........................................................................................................................8
(C) CASH FLOW BUDGET..........................................................................................................................9
References.................................................................................................................................................10
SECTION A
(A) INTRODUCTION
The type of the business which has been chosen by us is the manufacturing business which
manufactures cookies of variant flavors. The name of the manufacturing business is Kkrunchies Cookies.
This is a new business in the market of FMCG though there is already existing market for cookies.
However, the businesses of eateries are a flourishing one and have a positive growth chart (Arnott, et
al., 2017). Kkrunchies already have a customer base with its existing business of wafers and has decided
to diversify its business by entering into manufacturing cookies as well. To understand the existing
market base of cookies and existing competitors in the same business. There are number of competitors
in the market producing cookies and having established customer base. According to the recent market
survey we have analyzed the pricing structure and customer sale in the table given below:
Revenue/Sales Year 1 Year 2 Year 3 Year 4 Year 5
Average spend per customer 22 24 27 30 33
Averge no. of sales to each
customer in a year 100 100 100 100 100
Other income - - - - -
Estimated Revenue / Total
Income
731,6
00
1,158,7
88
1,802,2
85
2,900,
976
3,785,08
5
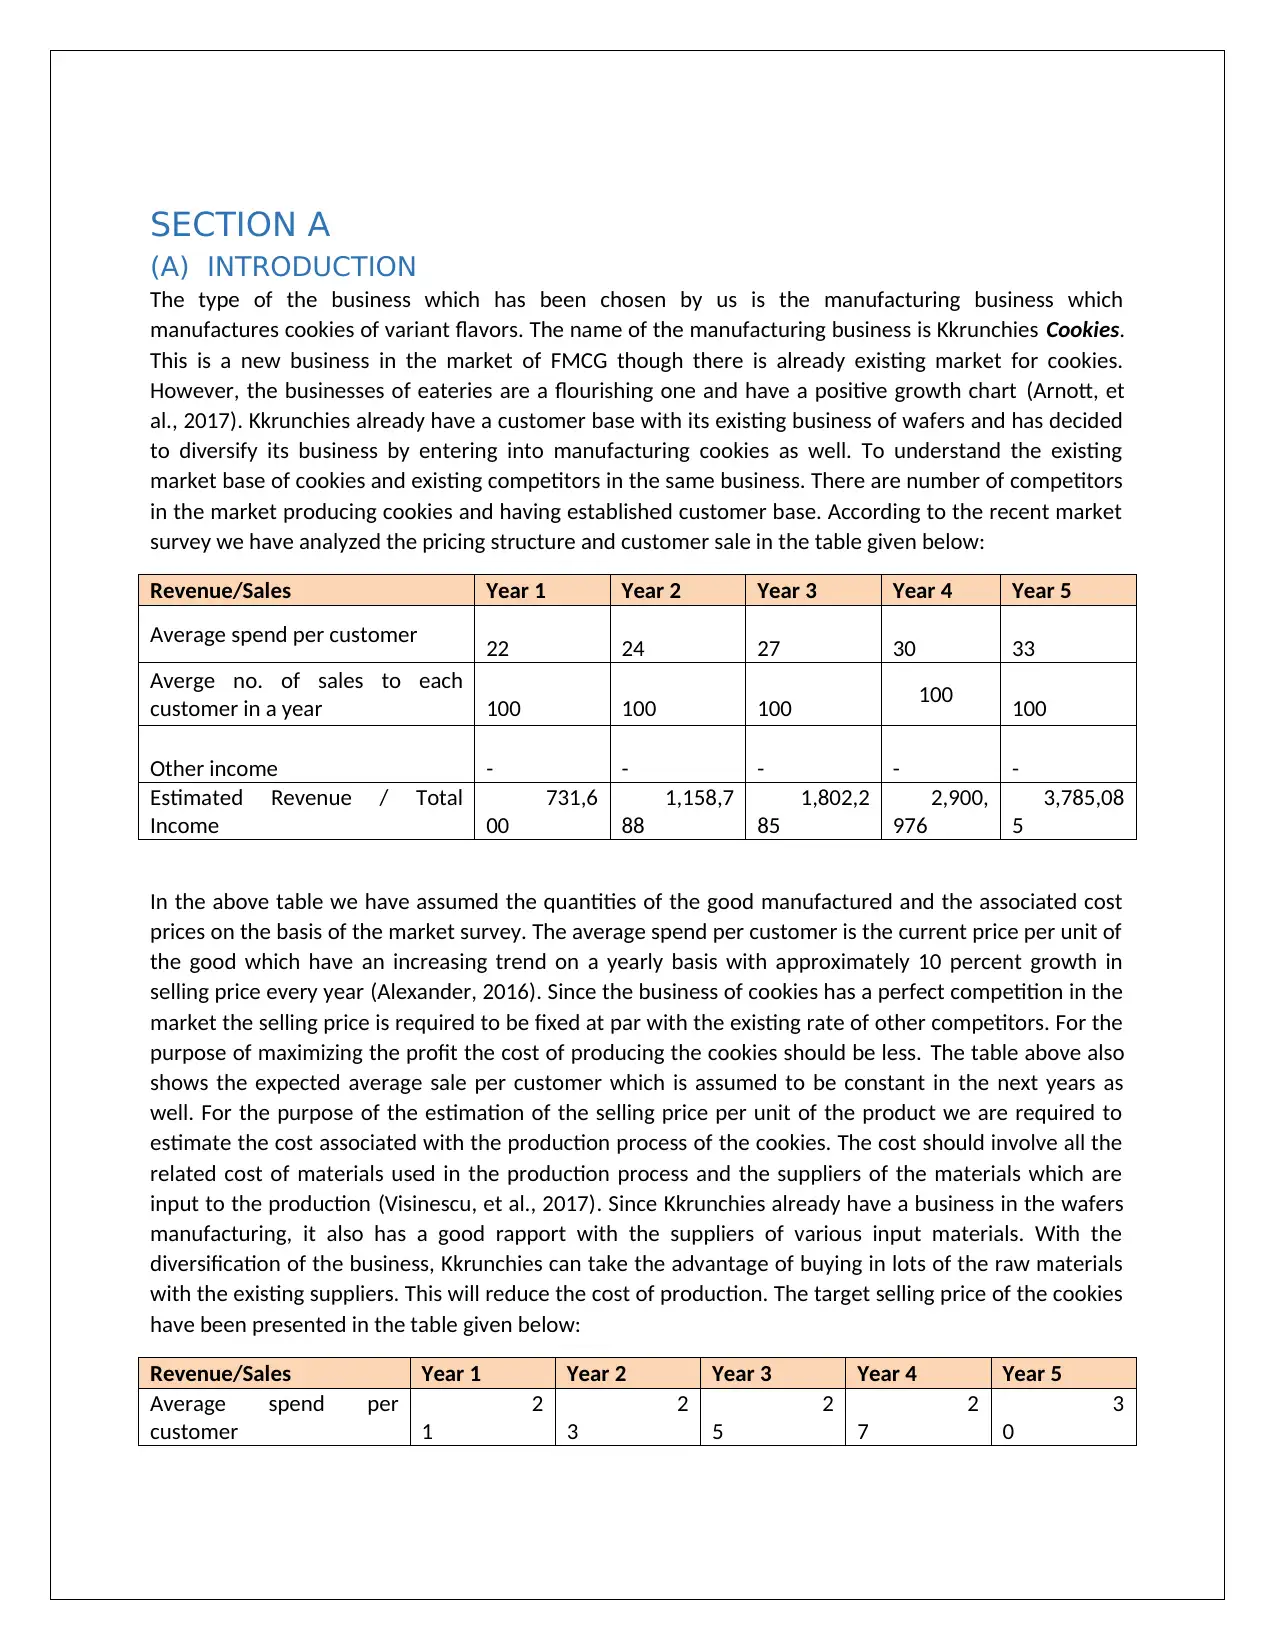
In the above table we have assumed the quantities of the good manufactured and the associated cost
prices on the basis of the market survey. The average spend per customer is the current price per unit of
the good which have an increasing trend on a yearly basis with approximately 10 percent growth in
selling price every year (Alexander, 2016). Since the business of cookies has a perfect competition in the
market the selling price is required to be fixed at par with the existing rate of other competitors. For the
purpose of maximizing the profit the cost of producing the cookies should be less. The table above also
shows the expected average sale per customer which is assumed to be constant in the next years as
well. For the purpose of the estimation of the selling price per unit of the product we are required to
estimate the cost associated with the production process of the cookies. The cost should involve all the
related cost of materials used in the production process and the suppliers of the materials which are
input to the production (Visinescu, et al., 2017). Since Kkrunchies already have a business in the wafers
manufacturing, it also has a good rapport with the suppliers of various input materials. With the
diversification of the business, Kkrunchies can take the advantage of buying in lots of the raw materials
with the existing suppliers. This will reduce the cost of production. The target selling price of the cookies
have been presented in the table given below:
Revenue/Sales Year 1 Year 2 Year 3 Year 4 Year 5
Average spend per
customer
2
1
2
3
2
5
2
7
3
0
(A) INTRODUCTION
The type of the business which has been chosen by us is the manufacturing business which
manufactures cookies of variant flavors. The name of the manufacturing business is Kkrunchies Cookies.
This is a new business in the market of FMCG though there is already existing market for cookies.
However, the businesses of eateries are a flourishing one and have a positive growth chart (Arnott, et
al., 2017). Kkrunchies already have a customer base with its existing business of wafers and has decided
to diversify its business by entering into manufacturing cookies as well. To understand the existing
market base of cookies and existing competitors in the same business. There are number of competitors
in the market producing cookies and having established customer base. According to the recent market
survey we have analyzed the pricing structure and customer sale in the table given below:
Revenue/Sales Year 1 Year 2 Year 3 Year 4 Year 5
Average spend per customer 22 24 27 30 33
Averge no. of sales to each
customer in a year 100 100 100 100 100
Other income - - - - -
Estimated Revenue / Total
Income
731,6
00
1,158,7
88
1,802,2
85
2,900,
976
3,785,08
5
In the above table we have assumed the quantities of the good manufactured and the associated cost
prices on the basis of the market survey. The average spend per customer is the current price per unit of
the good which have an increasing trend on a yearly basis with approximately 10 percent growth in
selling price every year (Alexander, 2016). Since the business of cookies has a perfect competition in the
market the selling price is required to be fixed at par with the existing rate of other competitors. For the
purpose of maximizing the profit the cost of producing the cookies should be less. The table above also
shows the expected average sale per customer which is assumed to be constant in the next years as
well. For the purpose of the estimation of the selling price per unit of the product we are required to
estimate the cost associated with the production process of the cookies. The cost should involve all the
related cost of materials used in the production process and the suppliers of the materials which are
input to the production (Visinescu, et al., 2017). Since Kkrunchies already have a business in the wafers
manufacturing, it also has a good rapport with the suppliers of various input materials. With the
diversification of the business, Kkrunchies can take the advantage of buying in lots of the raw materials
with the existing suppliers. This will reduce the cost of production. The target selling price of the cookies
have been presented in the table given below:
Revenue/Sales Year 1 Year 2 Year 3 Year 4 Year 5
Average spend per
customer
2
1
2
3
2
5
2
7
3
0
⊘ This is a preview!⊘
Do you want full access?
Subscribe today to unlock all pages.
Trusted by 1+ million students worldwide
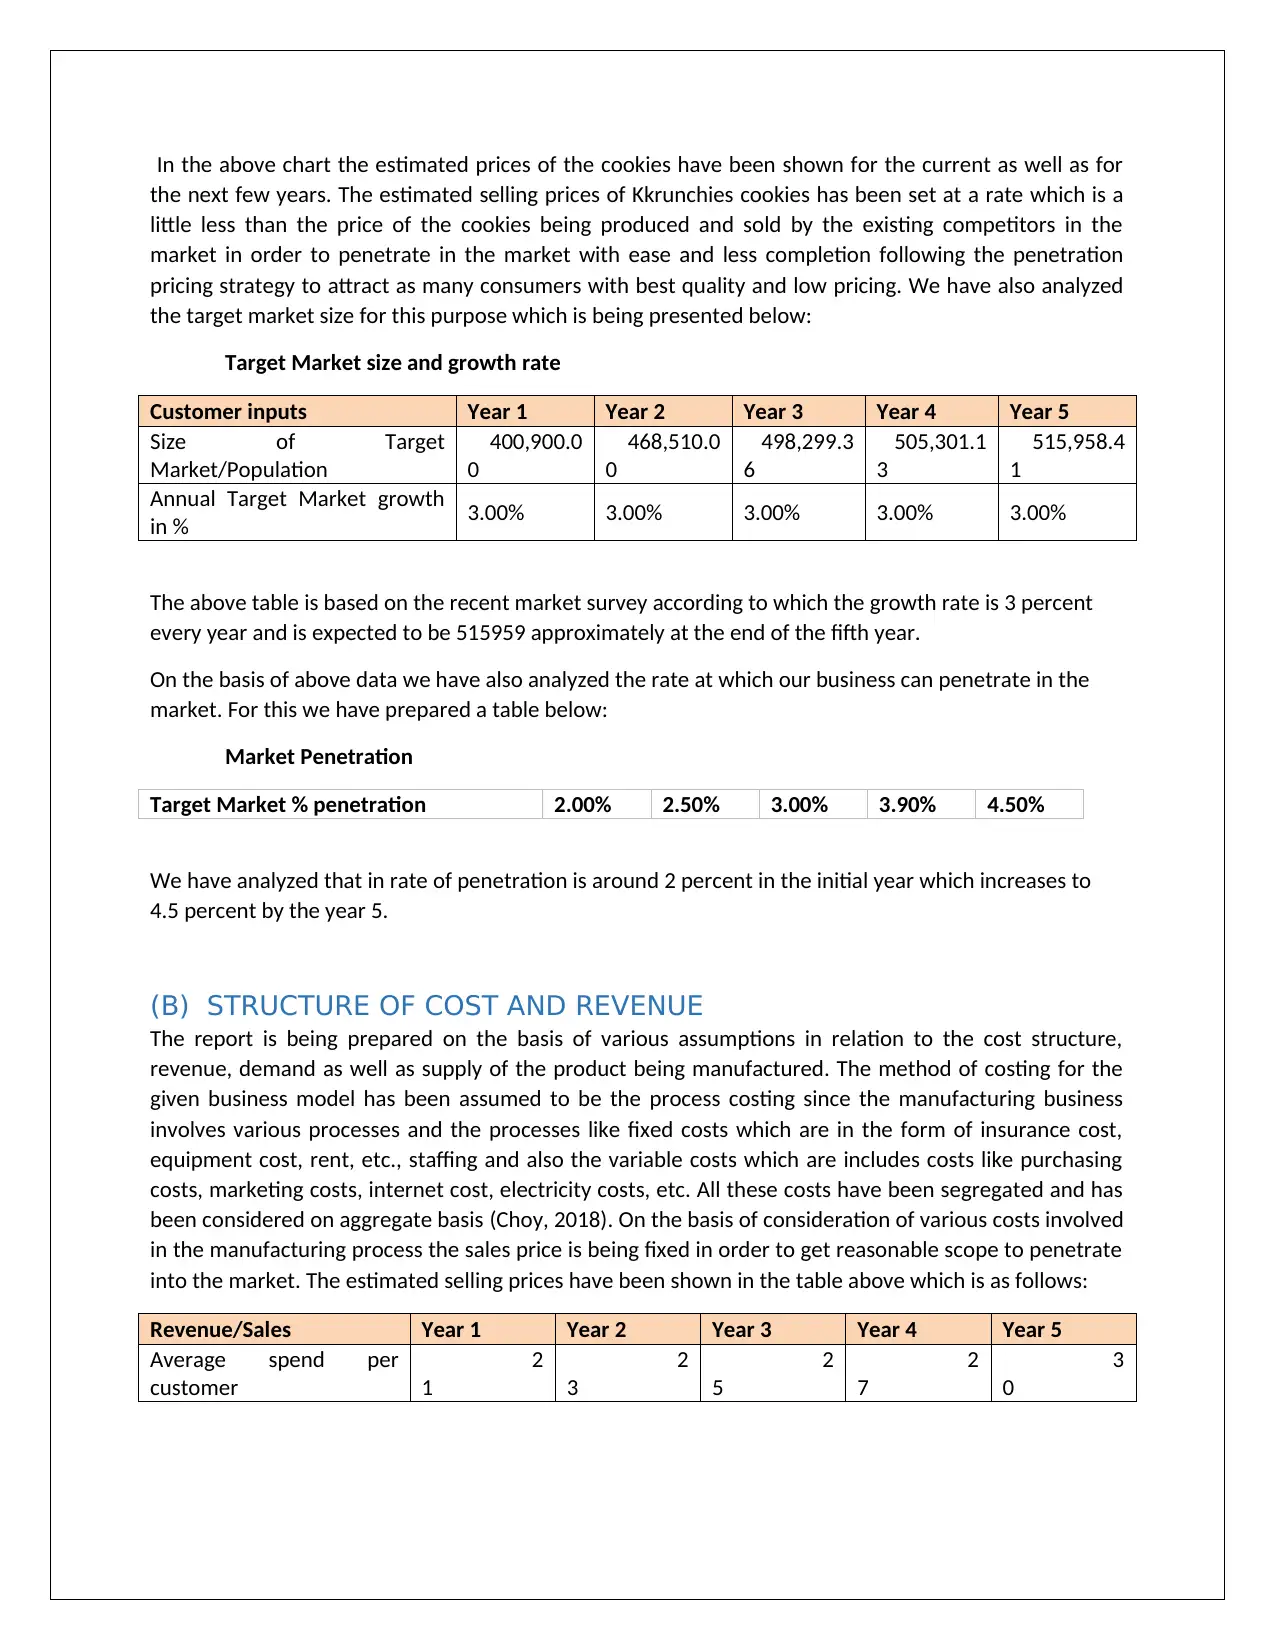
In the above chart the estimated prices of the cookies have been shown for the current as well as for
the next few years. The estimated selling prices of Kkrunchies cookies has been set at a rate which is a
little less than the price of the cookies being produced and sold by the existing competitors in the
market in order to penetrate in the market with ease and less completion following the penetration
pricing strategy to attract as many consumers with best quality and low pricing. We have also analyzed
the target market size for this purpose which is being presented below:
Target Market size and growth rate
Customer inputs Year 1 Year 2 Year 3 Year 4 Year 5
Size of Target
Market/Population
400,900.0
0
468,510.0
0
498,299.3
6
505,301.1
3
515,958.4
1
Annual Target Market growth
in % 3.00% 3.00% 3.00% 3.00% 3.00%
The above table is based on the recent market survey according to which the growth rate is 3 percent
every year and is expected to be 515959 approximately at the end of the fifth year.
On the basis of above data we have also analyzed the rate at which our business can penetrate in the
market. For this we have prepared a table below:
Market Penetration
Target Market % penetration 2.00% 2.50% 3.00% 3.90% 4.50%
We have analyzed that in rate of penetration is around 2 percent in the initial year which increases to
4.5 percent by the year 5.
(B) STRUCTURE OF COST AND REVENUE
The report is being prepared on the basis of various assumptions in relation to the cost structure,
revenue, demand as well as supply of the product being manufactured. The method of costing for the
given business model has been assumed to be the process costing since the manufacturing business
involves various processes and the processes like fixed costs which are in the form of insurance cost,
equipment cost, rent, etc., staffing and also the variable costs which are includes costs like purchasing
costs, marketing costs, internet cost, electricity costs, etc. All these costs have been segregated and has
been considered on aggregate basis (Choy, 2018). On the basis of consideration of various costs involved
in the manufacturing process the sales price is being fixed in order to get reasonable scope to penetrate
into the market. The estimated selling prices have been shown in the table above which is as follows:
Revenue/Sales Year 1 Year 2 Year 3 Year 4 Year 5
Average spend per
customer
2
1
2
3
2
5
2
7
3
0
Paraphrase This Document
Need a fresh take? Get an instant paraphrase of this document with our AI Paraphraser
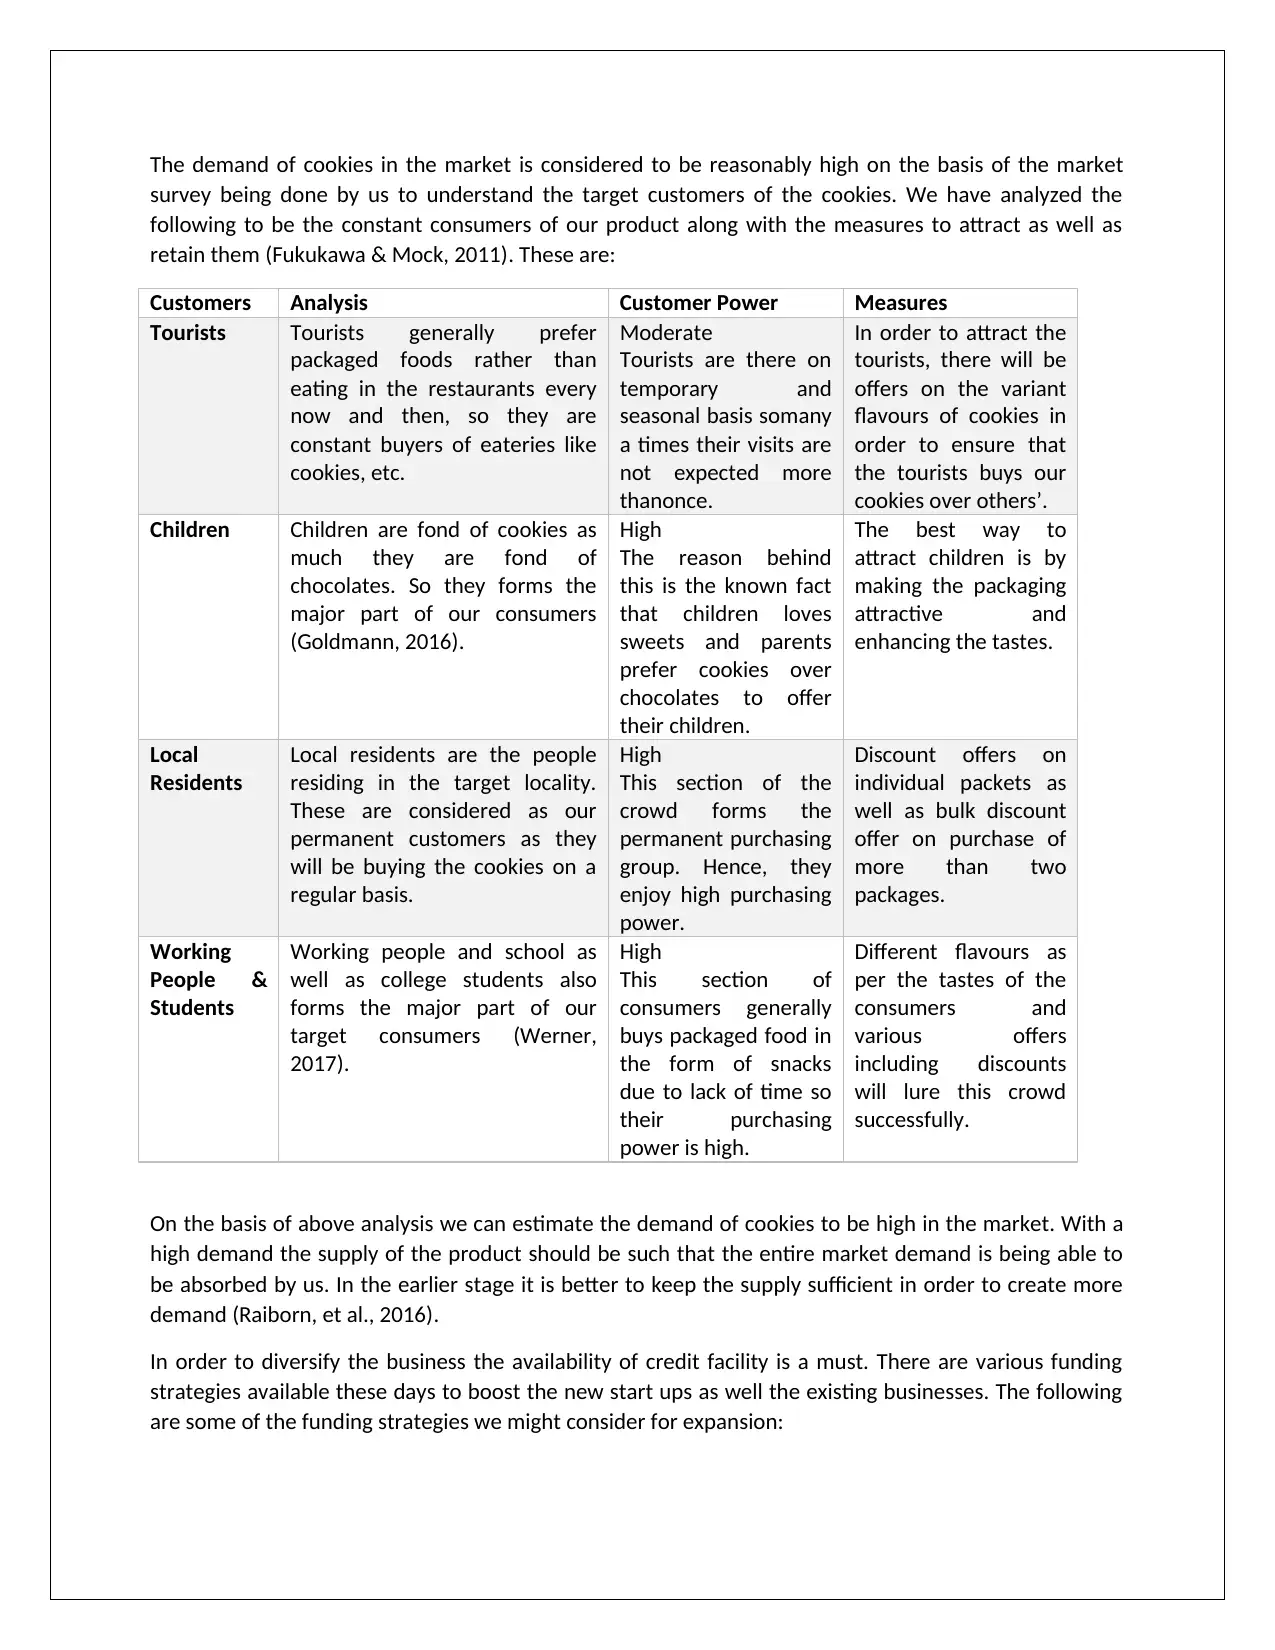
The demand of cookies in the market is considered to be reasonably high on the basis of the market
survey being done by us to understand the target customers of the cookies. We have analyzed the
following to be the constant consumers of our product along with the measures to attract as well as
retain them (Fukukawa & Mock, 2011). These are:
Customers Analysis Customer Power Measures
Tourists Tourists generally prefer
packaged foods rather than
eating in the restaurants every
now and then, so they are
constant buyers of eateries like
cookies, etc.
Moderate
Tourists are there on
temporary and
seasonal basis somany
a times their visits are
not expected more
thanonce.
In order to attract the
tourists, there will be
offers on the variant
flavours of cookies in
order to ensure that
the tourists buys our
cookies over others’.
Children Children are fond of cookies as
much they are fond of
chocolates. So they forms the
major part of our consumers
(Goldmann, 2016).
High
The reason behind
this is the known fact
that children loves
sweets and parents
prefer cookies over
chocolates to offer
their children.
The best way to
attract children is by
making the packaging
attractive and
enhancing the tastes.
Local
Residents
Local residents are the people
residing in the target locality.
These are considered as our
permanent customers as they
will be buying the cookies on a
regular basis.
High
This section of the
crowd forms the
permanent purchasing
group. Hence, they
enjoy high purchasing
power.
Discount offers on
individual packets as
well as bulk discount
offer on purchase of
more than two
packages.
Working
People &
Students
Working people and school as
well as college students also
forms the major part of our
target consumers (Werner,
2017).
High
This section of
consumers generally
buys packaged food in
the form of snacks
due to lack of time so
their purchasing
power is high.
Different flavours as
per the tastes of the
consumers and
various offers
including discounts
will lure this crowd
successfully.
On the basis of above analysis we can estimate the demand of cookies to be high in the market. With a
high demand the supply of the product should be such that the entire market demand is being able to
be absorbed by us. In the earlier stage it is better to keep the supply sufficient in order to create more
demand (Raiborn, et al., 2016).
In order to diversify the business the availability of credit facility is a must. There are various funding
strategies available these days to boost the new start ups as well the existing businesses. The following
are some of the funding strategies we might consider for expansion:
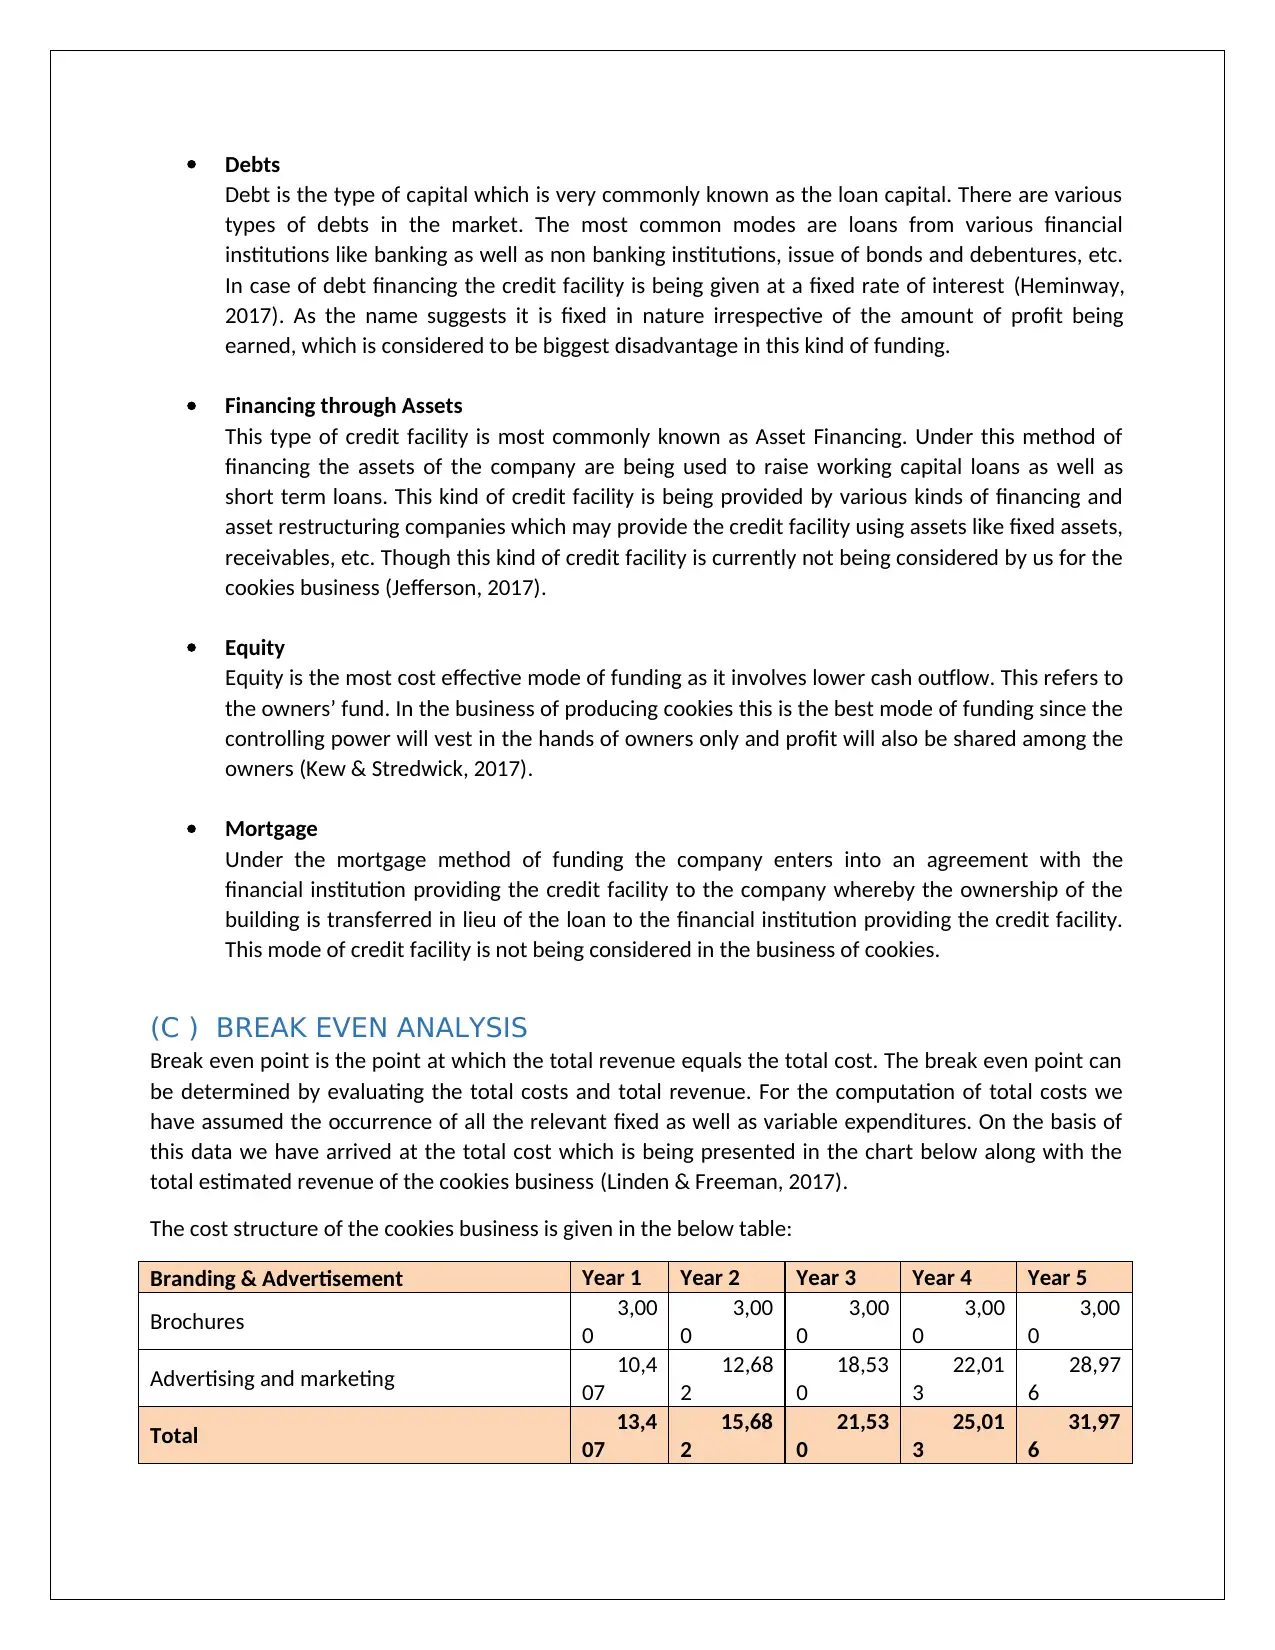
Debts
Debt is the type of capital which is very commonly known as the loan capital. There are various
types of debts in the market. The most common modes are loans from various financial
institutions like banking as well as non banking institutions, issue of bonds and debentures, etc.
In case of debt financing the credit facility is being given at a fixed rate of interest (Heminway,
2017). As the name suggests it is fixed in nature irrespective of the amount of profit being
earned, which is considered to be biggest disadvantage in this kind of funding.
Financing through Assets
This type of credit facility is most commonly known as Asset Financing. Under this method of
financing the assets of the company are being used to raise working capital loans as well as
short term loans. This kind of credit facility is being provided by various kinds of financing and
asset restructuring companies which may provide the credit facility using assets like fixed assets,
receivables, etc. Though this kind of credit facility is currently not being considered by us for the
cookies business (Jefferson, 2017).
Equity
Equity is the most cost effective mode of funding as it involves lower cash outflow. This refers to
the owners’ fund. In the business of producing cookies this is the best mode of funding since the
controlling power will vest in the hands of owners only and profit will also be shared among the
owners (Kew & Stredwick, 2017).
Mortgage
Under the mortgage method of funding the company enters into an agreement with the
financial institution providing the credit facility to the company whereby the ownership of the
building is transferred in lieu of the loan to the financial institution providing the credit facility.
This mode of credit facility is not being considered in the business of cookies.
(C ) BREAK EVEN ANALYSIS
Break even point is the point at which the total revenue equals the total cost. The break even point can
be determined by evaluating the total costs and total revenue. For the computation of total costs we
have assumed the occurrence of all the relevant fixed as well as variable expenditures. On the basis of
this data we have arrived at the total cost which is being presented in the chart below along with the
total estimated revenue of the cookies business (Linden & Freeman, 2017).
The cost structure of the cookies business is given in the below table:
Branding & Advertisement Year 1 Year 2 Year 3 Year 4 Year 5
Brochures 3,00
0
3,00
0
3,00
0
3,00
0
3,00
0
Advertising and marketing 10,4
07
12,68
2
18,53
0
22,01
3
28,97
6
Total 13,4
07
15,68
2
21,53
0
25,01
3
31,97
6
⊘ This is a preview!⊘
Do you want full access?
Subscribe today to unlock all pages.
Trusted by 1+ million students worldwide
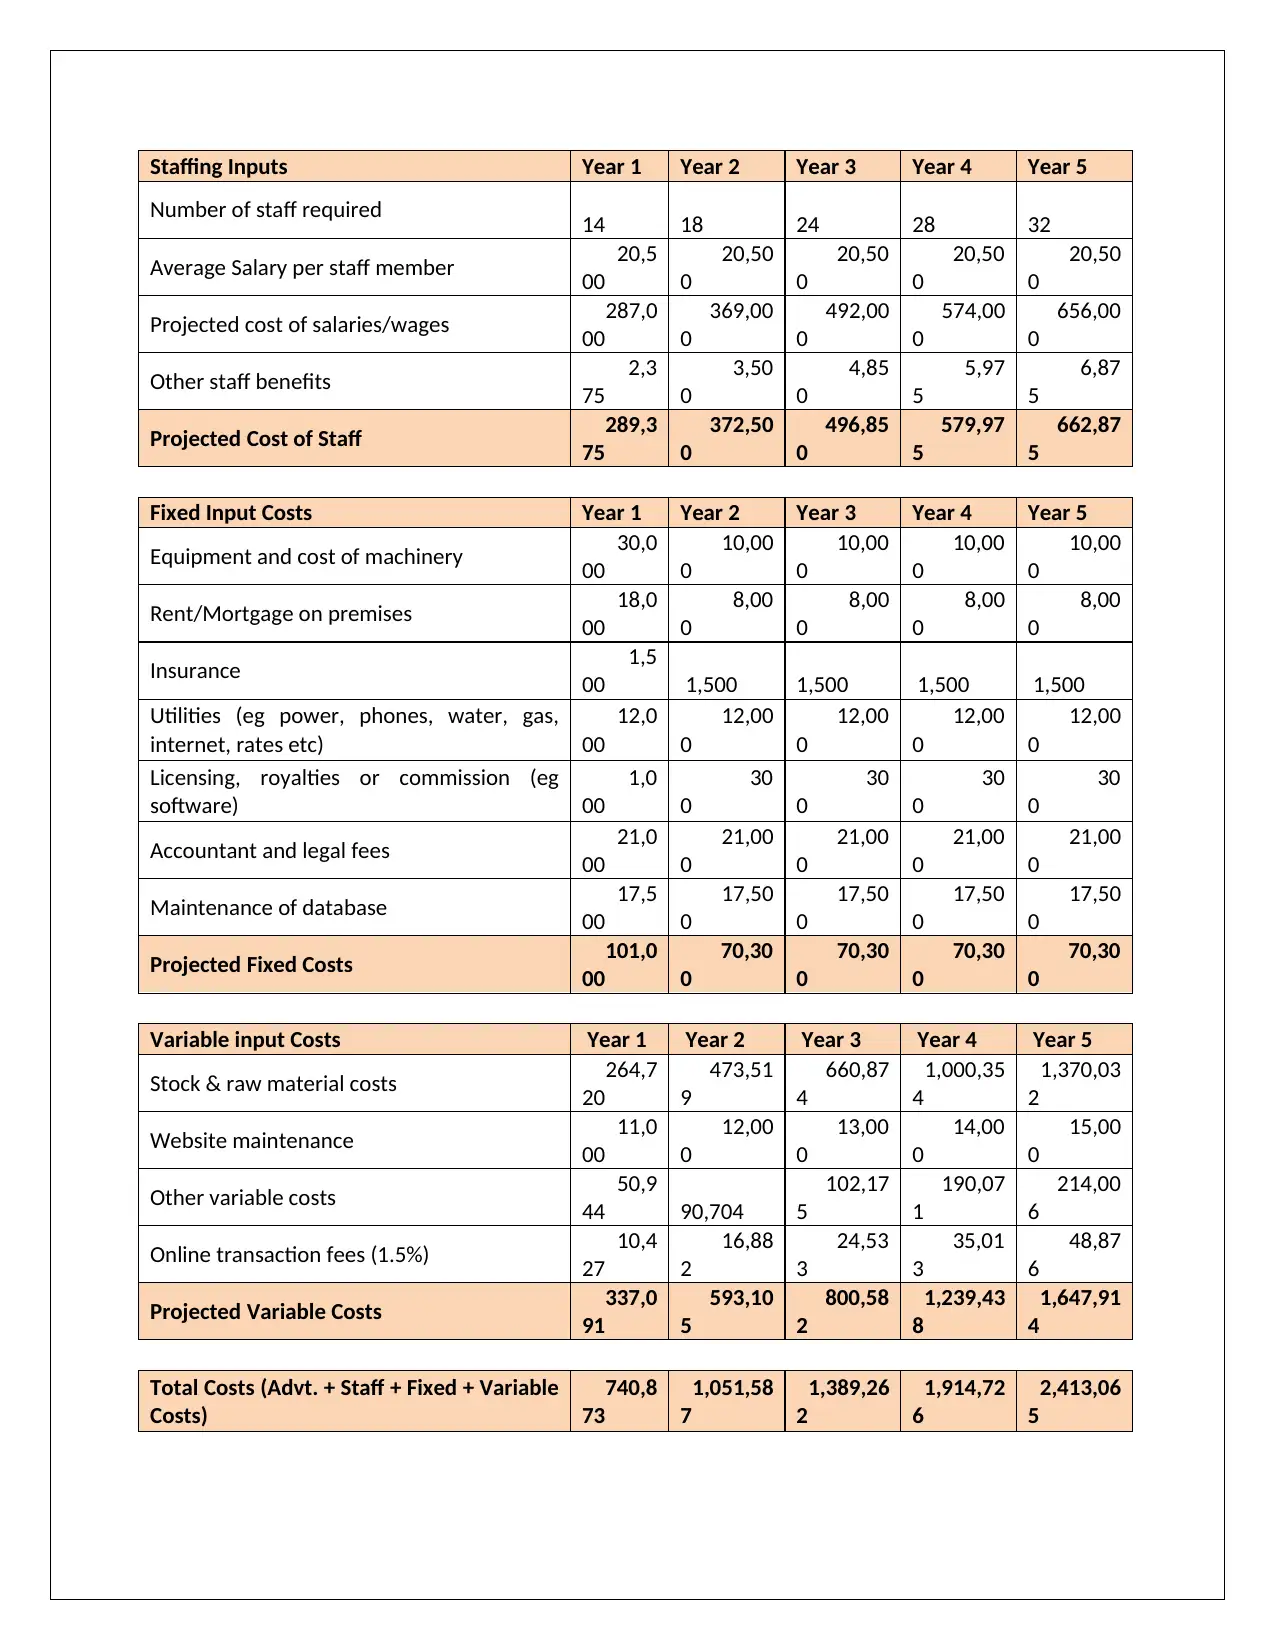
Staffing Inputs Year 1 Year 2 Year 3 Year 4 Year 5
Number of staff required 14 18 24 28 32
Average Salary per staff member 20,5
00
20,50
0
20,50
0
20,50
0
20,50
0
Projected cost of salaries/wages 287,0
00
369,00
0
492,00
0
574,00
0
656,00
0
Other staff benefits 2,3
75
3,50
0
4,85
0
5,97
5
6,87
5
Projected Cost of Staff 289,3
75
372,50
0
496,85
0
579,97
5
662,87
5
Fixed Input Costs Year 1 Year 2 Year 3 Year 4 Year 5
Equipment and cost of machinery 30,0
00
10,00
0
10,00
0
10,00
0
10,00
0
Rent/Mortgage on premises 18,0
00
8,00
0
8,00
0
8,00
0
8,00
0
Insurance 1,5
00 1,500 1,500 1,500 1,500
Utilities (eg power, phones, water, gas,
internet, rates etc)
12,0
00
12,00
0
12,00
0
12,00
0
12,00
0
Licensing, royalties or commission (eg
software)
1,0
00
30
0
30
0
30
0
30
0
Accountant and legal fees 21,0
00
21,00
0
21,00
0
21,00
0
21,00
0
Maintenance of database 17,5
00
17,50
0
17,50
0
17,50
0
17,50
0
Projected Fixed Costs 101,0
00
70,30
0
70,30
0
70,30
0
70,30
0
Variable input Costs Year 1 Year 2 Year 3 Year 4 Year 5
Stock & raw material costs 264,7
20
473,51
9
660,87
4
1,000,35
4
1,370,03
2
Website maintenance 11,0
00
12,00
0
13,00
0
14,00
0
15,00
0
Other variable costs 50,9
44 90,704
102,17
5
190,07
1
214,00
6
Online transaction fees (1.5%) 10,4
27
16,88
2
24,53
3
35,01
3
48,87
6
Projected Variable Costs 337,0
91
593,10
5
800,58
2
1,239,43
8
1,647,91
4
Total Costs (Advt. + Staff + Fixed + Variable
Costs)
740,8
73
1,051,58
7
1,389,26
2
1,914,72
6
2,413,06
5
Paraphrase This Document
Need a fresh take? Get an instant paraphrase of this document with our AI Paraphraser
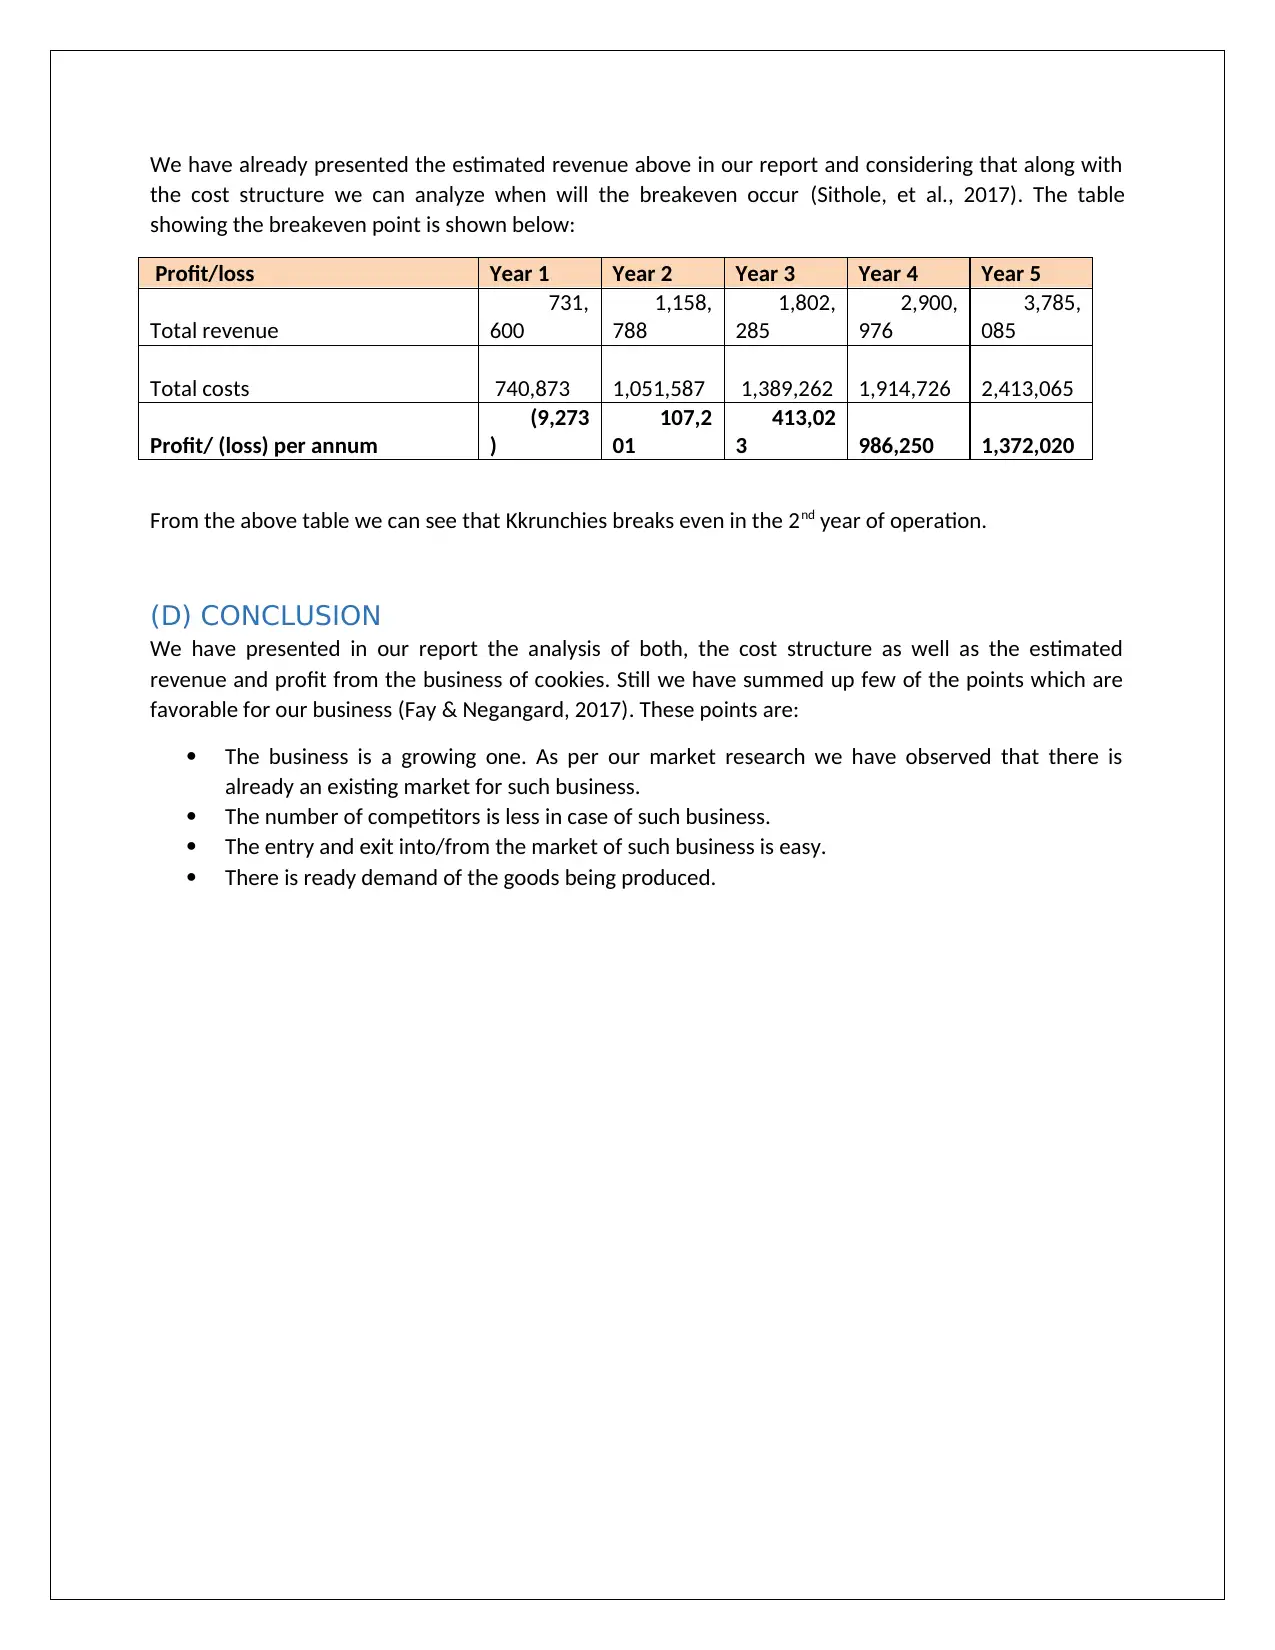
We have already presented the estimated revenue above in our report and considering that along with
the cost structure we can analyze when will the breakeven occur (Sithole, et al., 2017). The table
showing the breakeven point is shown below:
Profit/loss Year 1 Year 2 Year 3 Year 4 Year 5
Total revenue
731,
600
1,158,
788
1,802,
285
2,900,
976
3,785,
085
Total costs 740,873 1,051,587 1,389,262 1,914,726 2,413,065
Profit/ (loss) per annum
(9,273
)
107,2
01
413,02
3 986,250 1,372,020
From the above table we can see that Kkrunchies breaks even in the 2nd year of operation.
(D) CONCLUSION
We have presented in our report the analysis of both, the cost structure as well as the estimated
revenue and profit from the business of cookies. Still we have summed up few of the points which are
favorable for our business (Fay & Negangard, 2017). These points are:
The business is a growing one. As per our market research we have observed that there is
already an existing market for such business.
The number of competitors is less in case of such business.
The entry and exit into/from the market of such business is easy.
There is ready demand of the goods being produced.
SECTION B
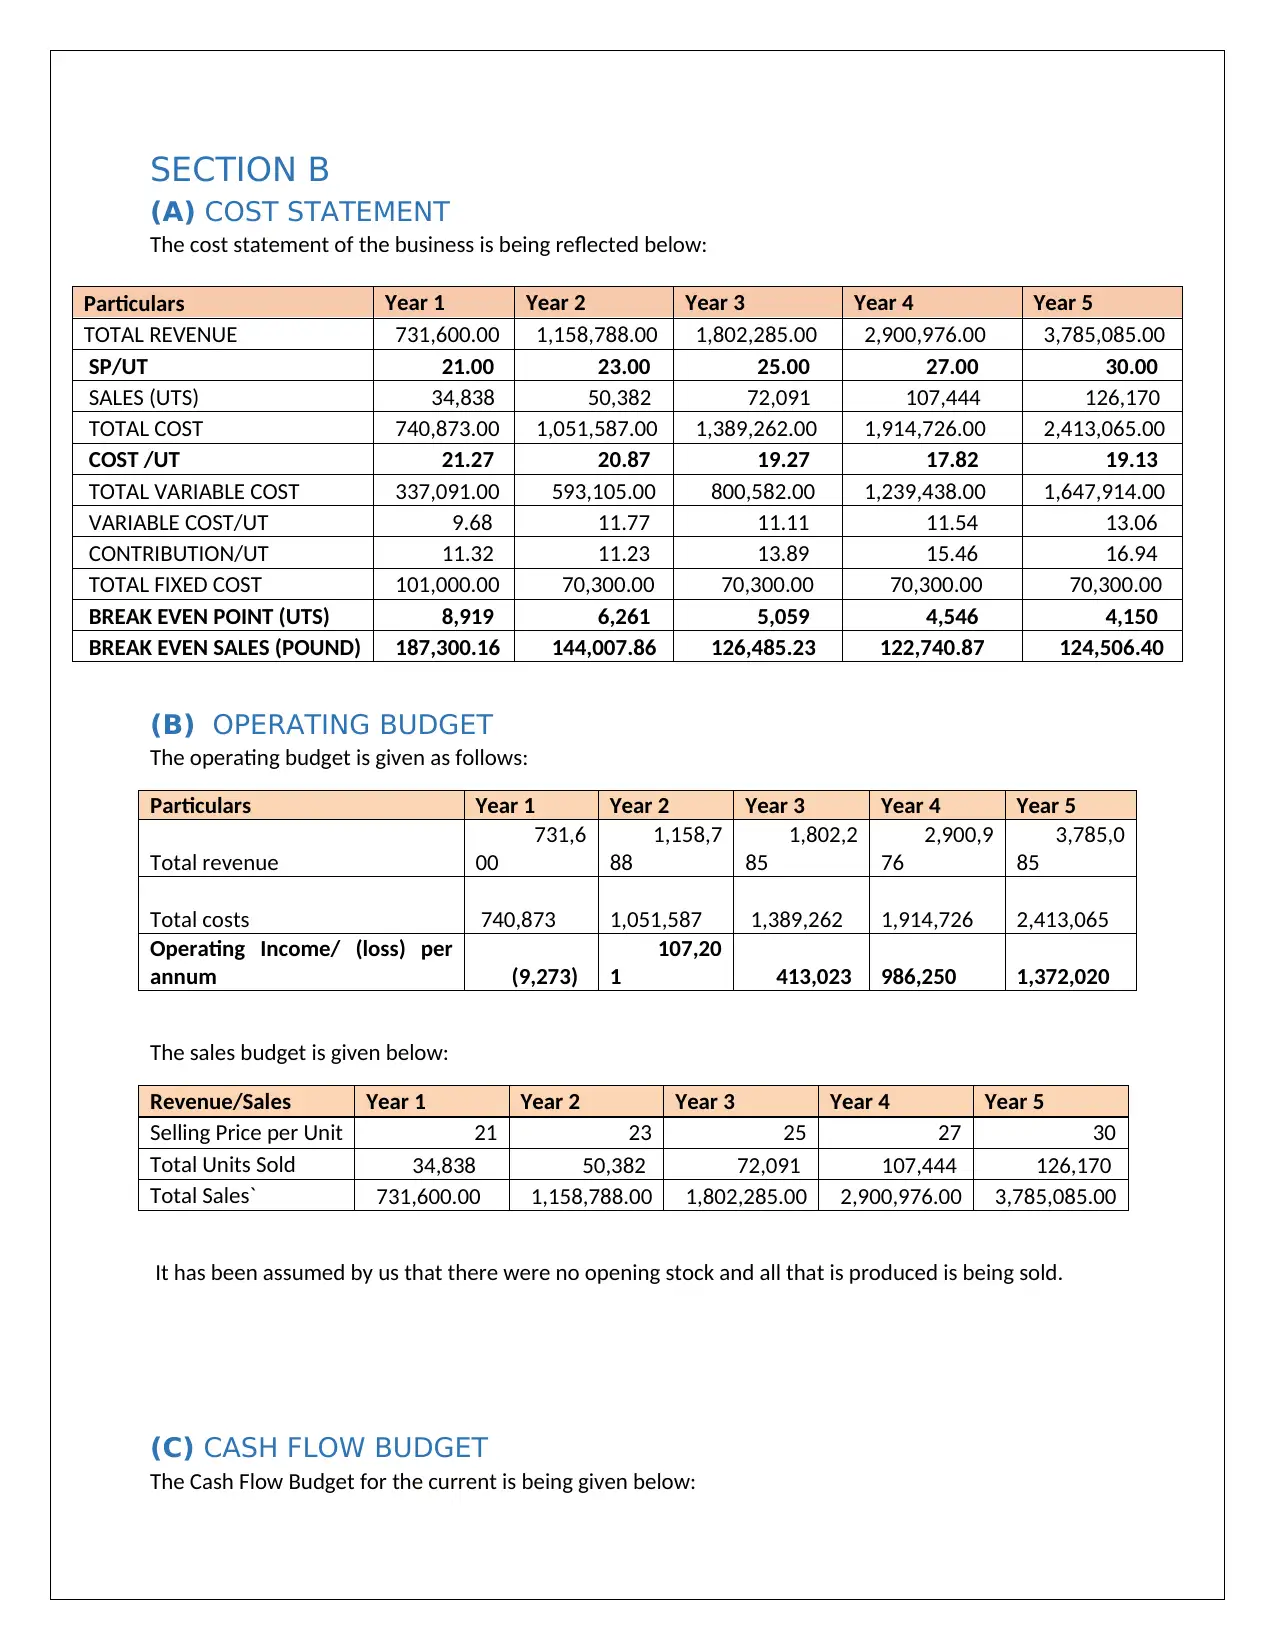
(A) COST STATEMENT
The cost statement of the business is being reflected below:
Particulars Year 1 Year 2 Year 3 Year 4 Year 5
TOTAL REVENUE 731,600.00 1,158,788.00 1,802,285.00 2,900,976.00 3,785,085.00
SP/UT 21.00 23.00 25.00 27.00 30.00
SALES (UTS) 34,838 50,382 72,091 107,444 126,170
TOTAL COST 740,873.00 1,051,587.00 1,389,262.00 1,914,726.00 2,413,065.00
COST /UT 21.27 20.87 19.27 17.82 19.13
TOTAL VARIABLE COST 337,091.00 593,105.00 800,582.00 1,239,438.00 1,647,914.00
VARIABLE COST/UT 9.68 11.77 11.11 11.54 13.06
CONTRIBUTION/UT 11.32 11.23 13.89 15.46 16.94
TOTAL FIXED COST 101,000.00 70,300.00 70,300.00 70,300.00 70,300.00
BREAK EVEN POINT (UTS) 8,919 6,261 5,059 4,546 4,150
BREAK EVEN SALES (POUND) 187,300.16 144,007.86 126,485.23 122,740.87 124,506.40
(B) OPERATING BUDGET
The operating budget is given as follows:
Particulars Year 1 Year 2 Year 3 Year 4 Year 5
Total revenue
731,6
00
1,158,7
88
1,802,2
85
2,900,9
76
3,785,0
85
Total costs 740,873 1,051,587 1,389,262 1,914,726 2,413,065
Operating Income/ (loss) per
annum (9,273)
107,20
1 413,023 986,250 1,372,020
The sales budget is given below:
Revenue/Sales Year 1 Year 2 Year 3 Year 4 Year 5
Selling Price per Unit 21 23 25 27 30
Total Units Sold 34,838 50,382 72,091 107,444 126,170
Total Sales` 731,600.00 1,158,788.00 1,802,285.00 2,900,976.00 3,785,085.00
It has been assumed by us that there were no opening stock and all that is produced is being sold.
(C) CASH FLOW BUDGET
The Cash Flow Budget for the current is being given below:
⊘ This is a preview!⊘
Do you want full access?
Subscribe today to unlock all pages.
Trusted by 1+ million students worldwide
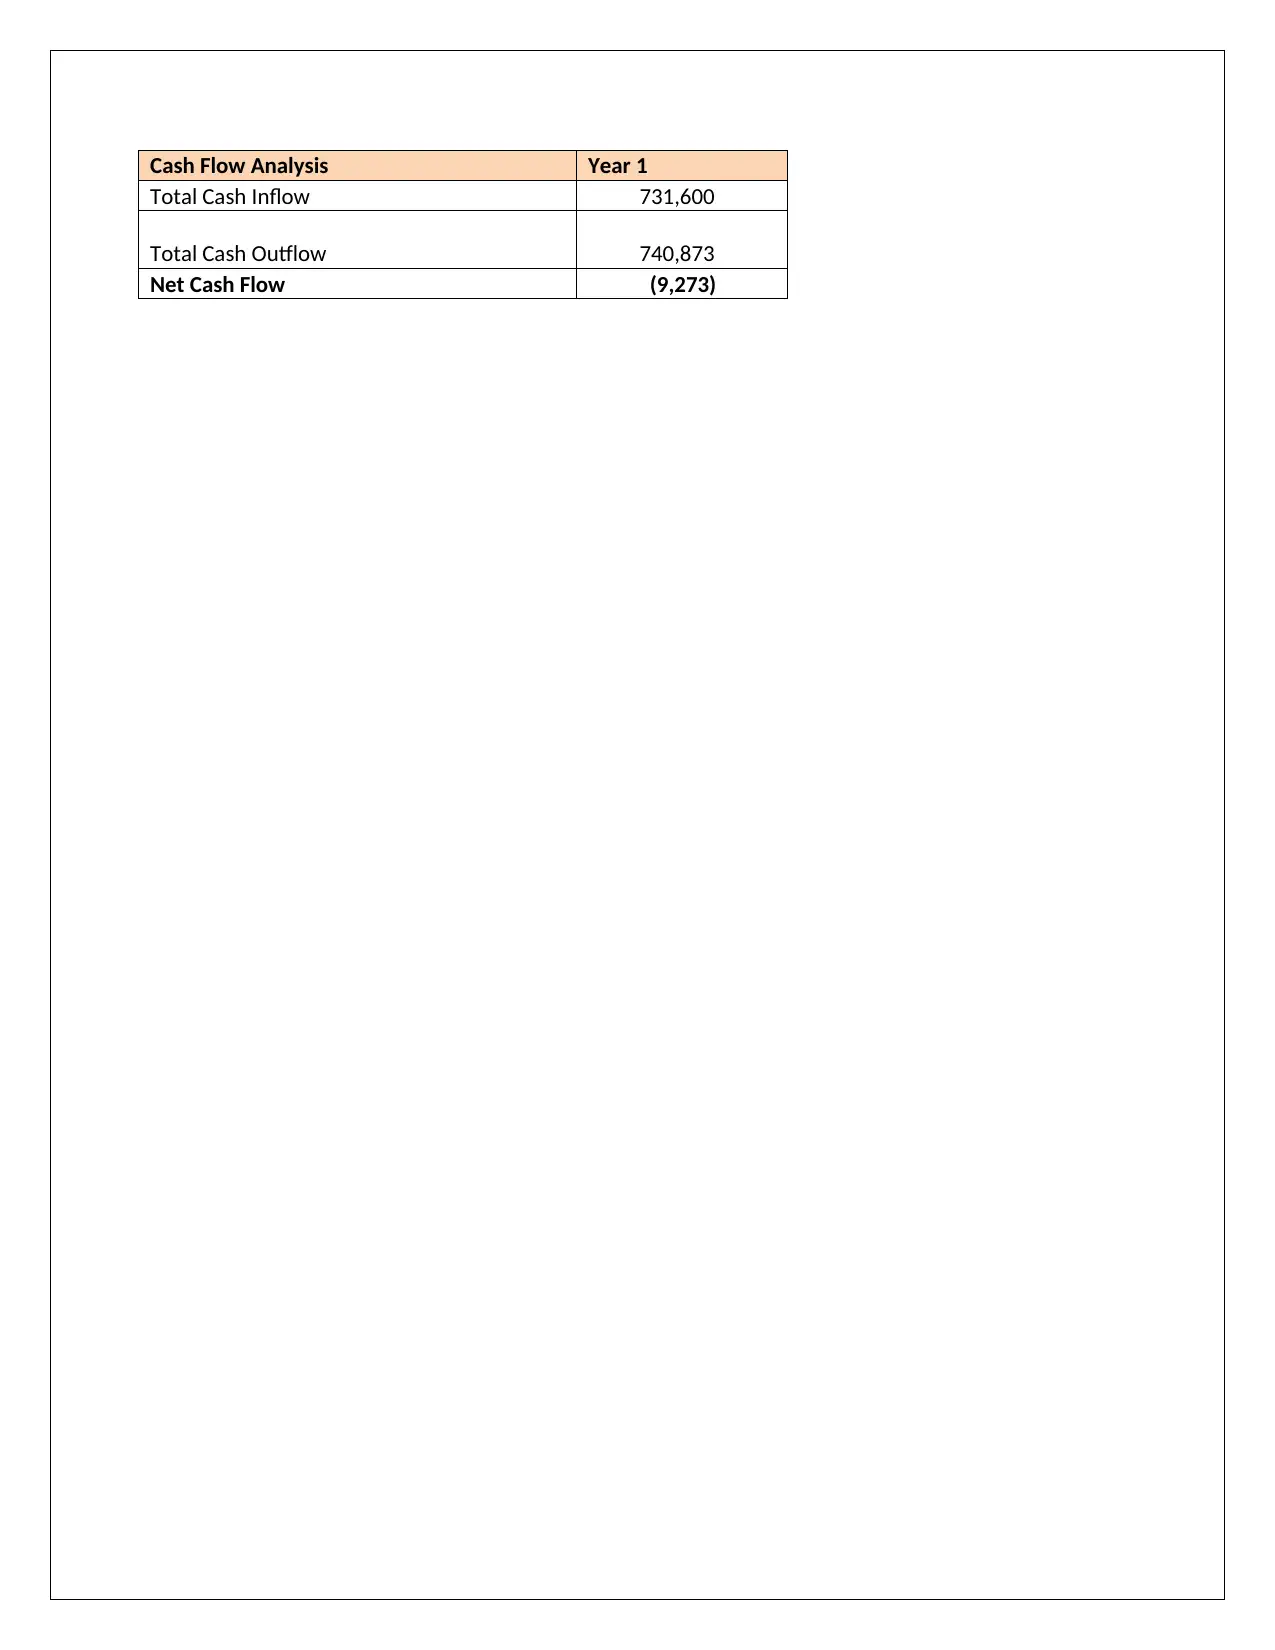
Cash Flow Analysis Year 1
Total Cash Inflow 731,600
Total Cash Outflow 740,873
Net Cash Flow (9,273)
Total Cash Inflow 731,600
Total Cash Outflow 740,873
Net Cash Flow (9,273)
Paraphrase This Document
Need a fresh take? Get an instant paraphrase of this document with our AI Paraphraser
References
Alexander, F., 2016. The Changing Face of Accountability. The Journal of Higher Education, 71(4), pp.
411-431.
Arnott, D., Lizama, F. & Song, Y., 2017. Patterns of business intelligence systems use in organizations.
Decision Support Systems, Volume 97, pp. 58-68.
Choy, Y. K., 2018. Cost-benefit Analysis, Values, Wellbeing and Ethics: An Indigenous Worldview Analysis.
Ecological Economics, 3(1), p. 145.
Fay, R. & Negangard, E., 2017. Manual journal entry testing : Data analytics and the risk of fraud. Journal
of Accounting Education, Volume 38, pp. 37-49.
Fukukawa, H. & Mock, T., 2011. Audit risk assessments using belief versus probability. Auditing: A
Journal of Practice & Theory, 30(1), pp. 75-99.
Goldmann, K., 2016. Financial Liquidity and Profitability Management in Practice of Polish Business.
Financial Environment and Business Development, 4(3), pp. 103-112.
Heminway, J., 2017. Shareholder Wealth Maximization as a Function of Statutes, Decisional Law, and
Organic Documents. SSRN, pp. 1-35.
Jefferson, M., 2017. Energy, Complexity and Wealth Maximization, R. Ayres. Springer, Switzerland.
Technological Forecasting and Social Change, pp. 353-354.
Kew, J. & Stredwick, J., 2017. Business Environment: Managing in a Strategic Context. second ed.
London: Chartered Institute of Personnel and Development.
Linden, B. & Freeman, R., 2017. Profit and Other Values: Thick Evaluation in Decision Making. Business
Ethics Quarterly, 27(3), pp. 353-379.
Raiborn, C., Butler, J. & Martin, K., 2016. The internal audit function: A prerequisite for Good
Governance. Journal of Corporate Accounting and Finance, 28(2), pp. 10-21.
Sithole, S., Chandler, P., Abeysekera, I. & Paas, F., 2017. Benefits of guided self-management of attention
on learning accounting. Journal of Educational Psychology, 109(2), p. 220.
Visinescu, L., Jones, M. & Sidorova, A., 2017. Improving Decision Quality: The Role of Business
Intelligence. Journal of Computer Information Systems, 57(1), pp. 58-66.
Werner, M., 2017. Financial process mining - Accounting data structure dependent control flow
inference. International Journal of Accounting Information Systems, 25(1), pp. 57-80.
1 out of 11
Related Documents


Your All-in-One AI-Powered Toolkit for Academic Success.
+13062052269
info@desklib.com
Available 24*7 on WhatsApp / Email
![[object Object]](/_next/static/media/star-bottom.7253800d.svg)
Unlock your academic potential
Copyright © 2020–2026 A2Z Services. All Rights Reserved. Developed and managed by ZUCOL.