Economics Homework: Marginal Utility, Market Demand, and Elasticity

Verified

Added on  2021/07/05

|25
|940
|172
Homework Assignment
AI Summary
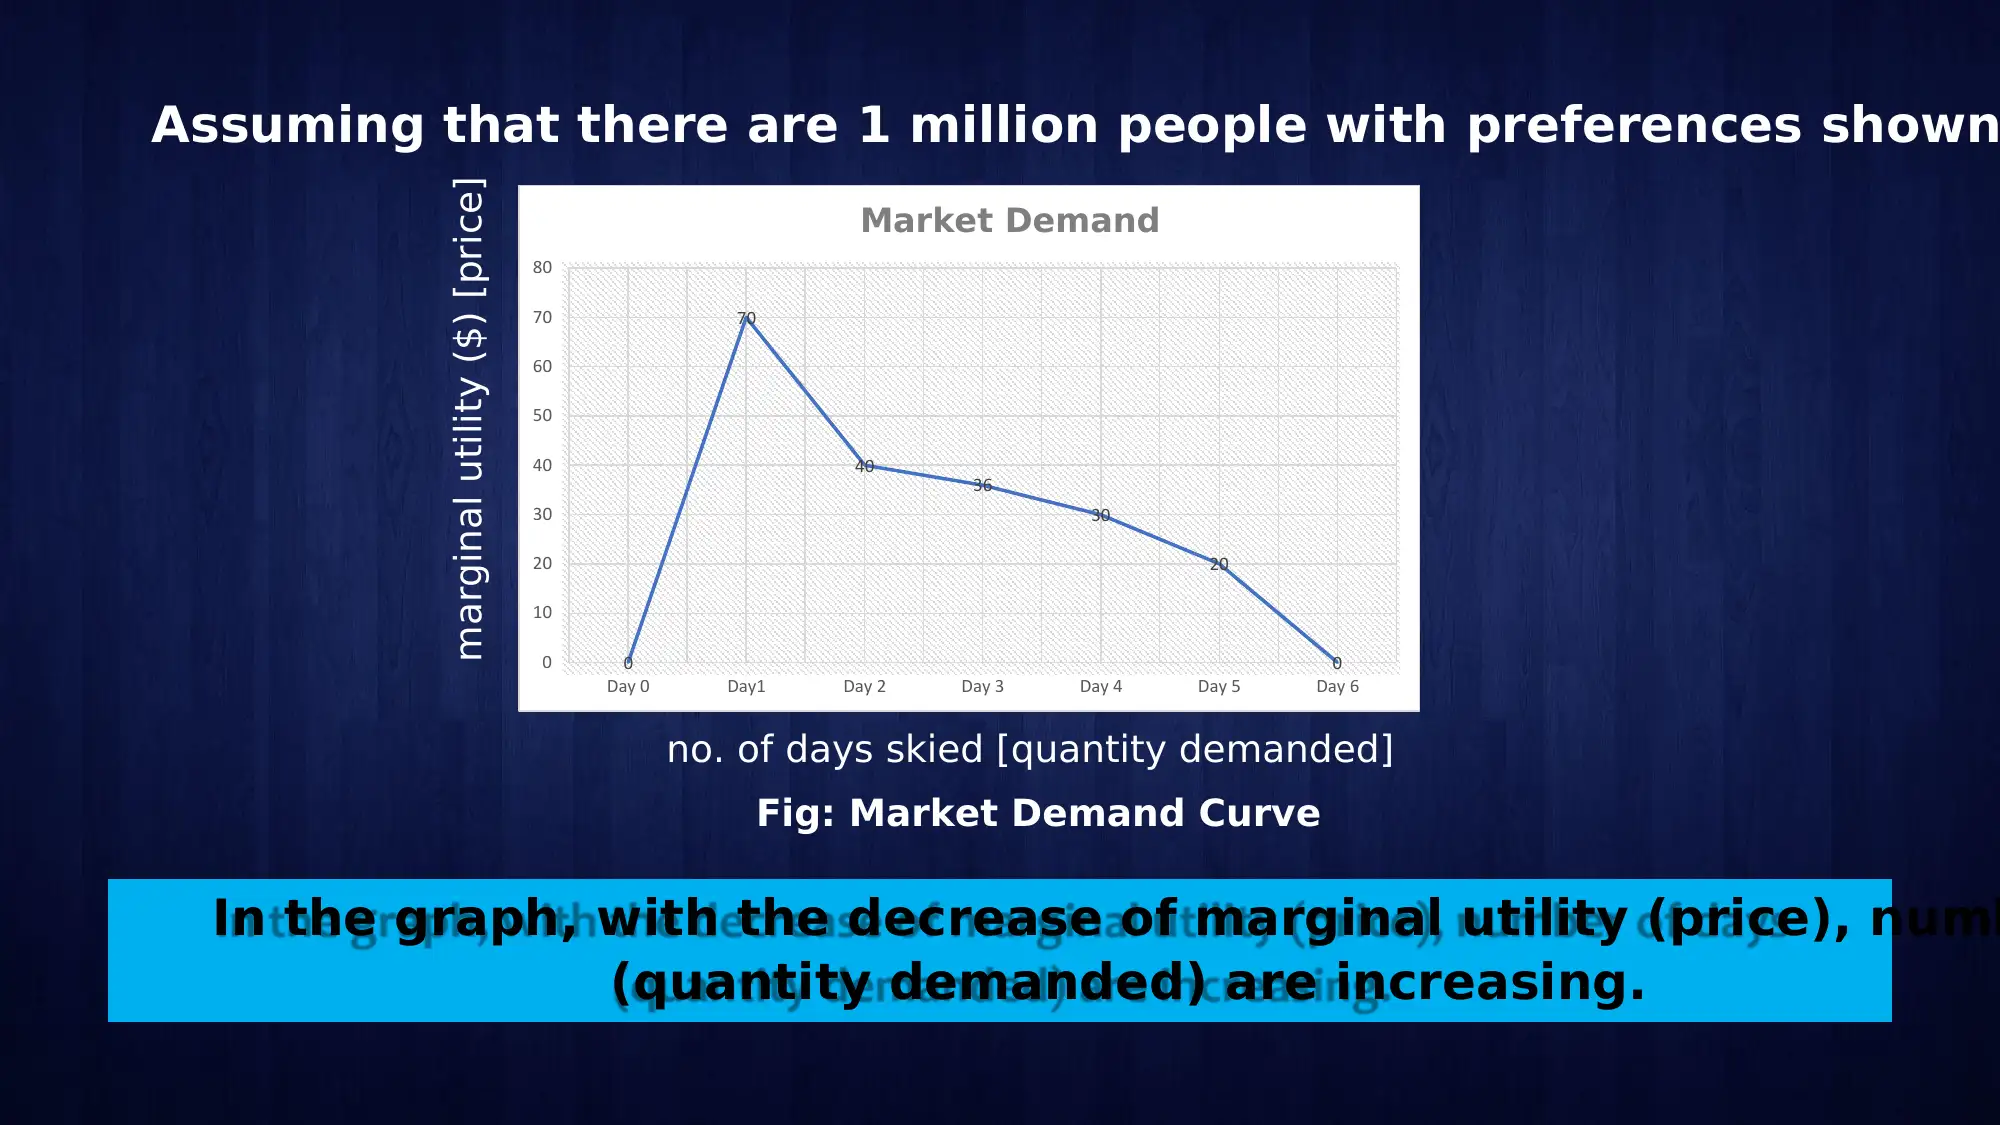
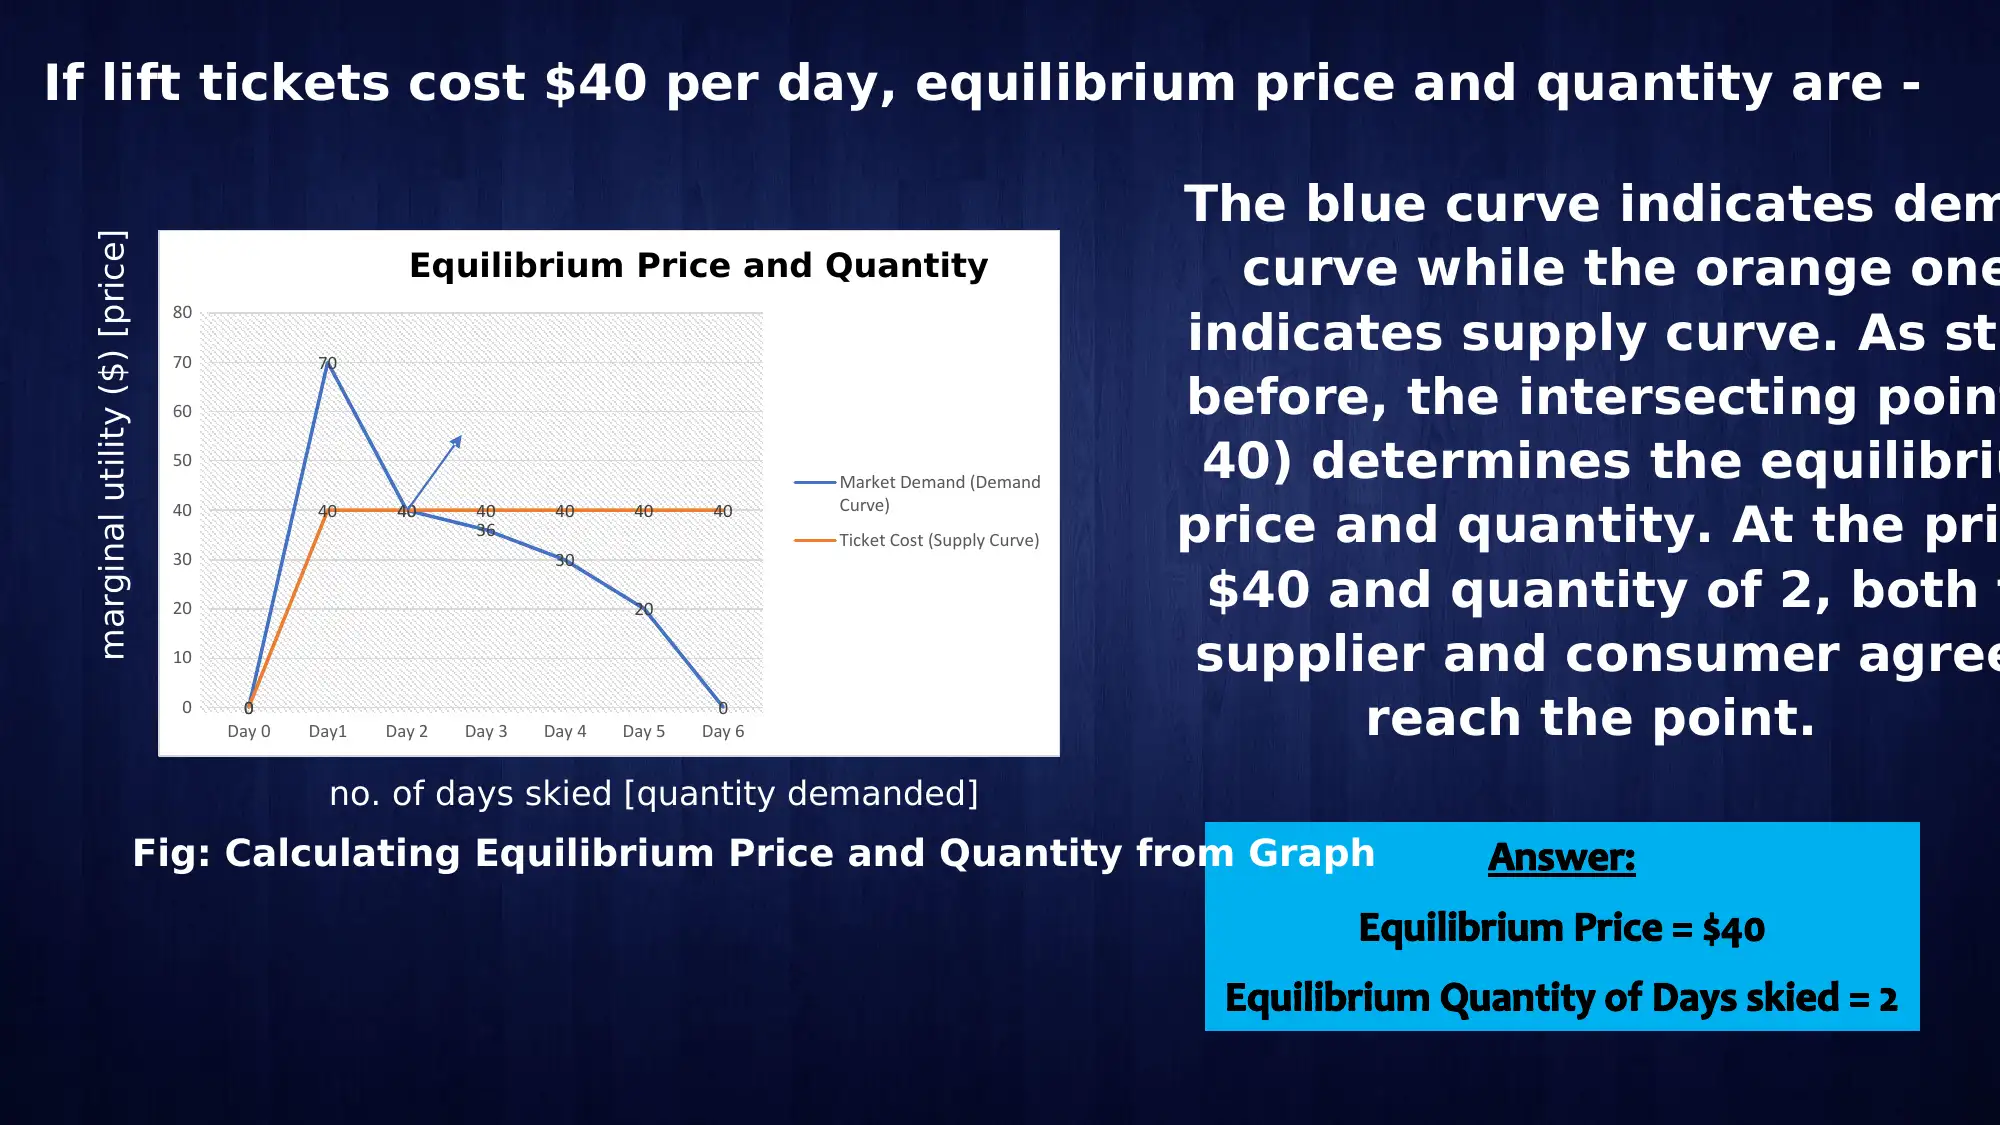
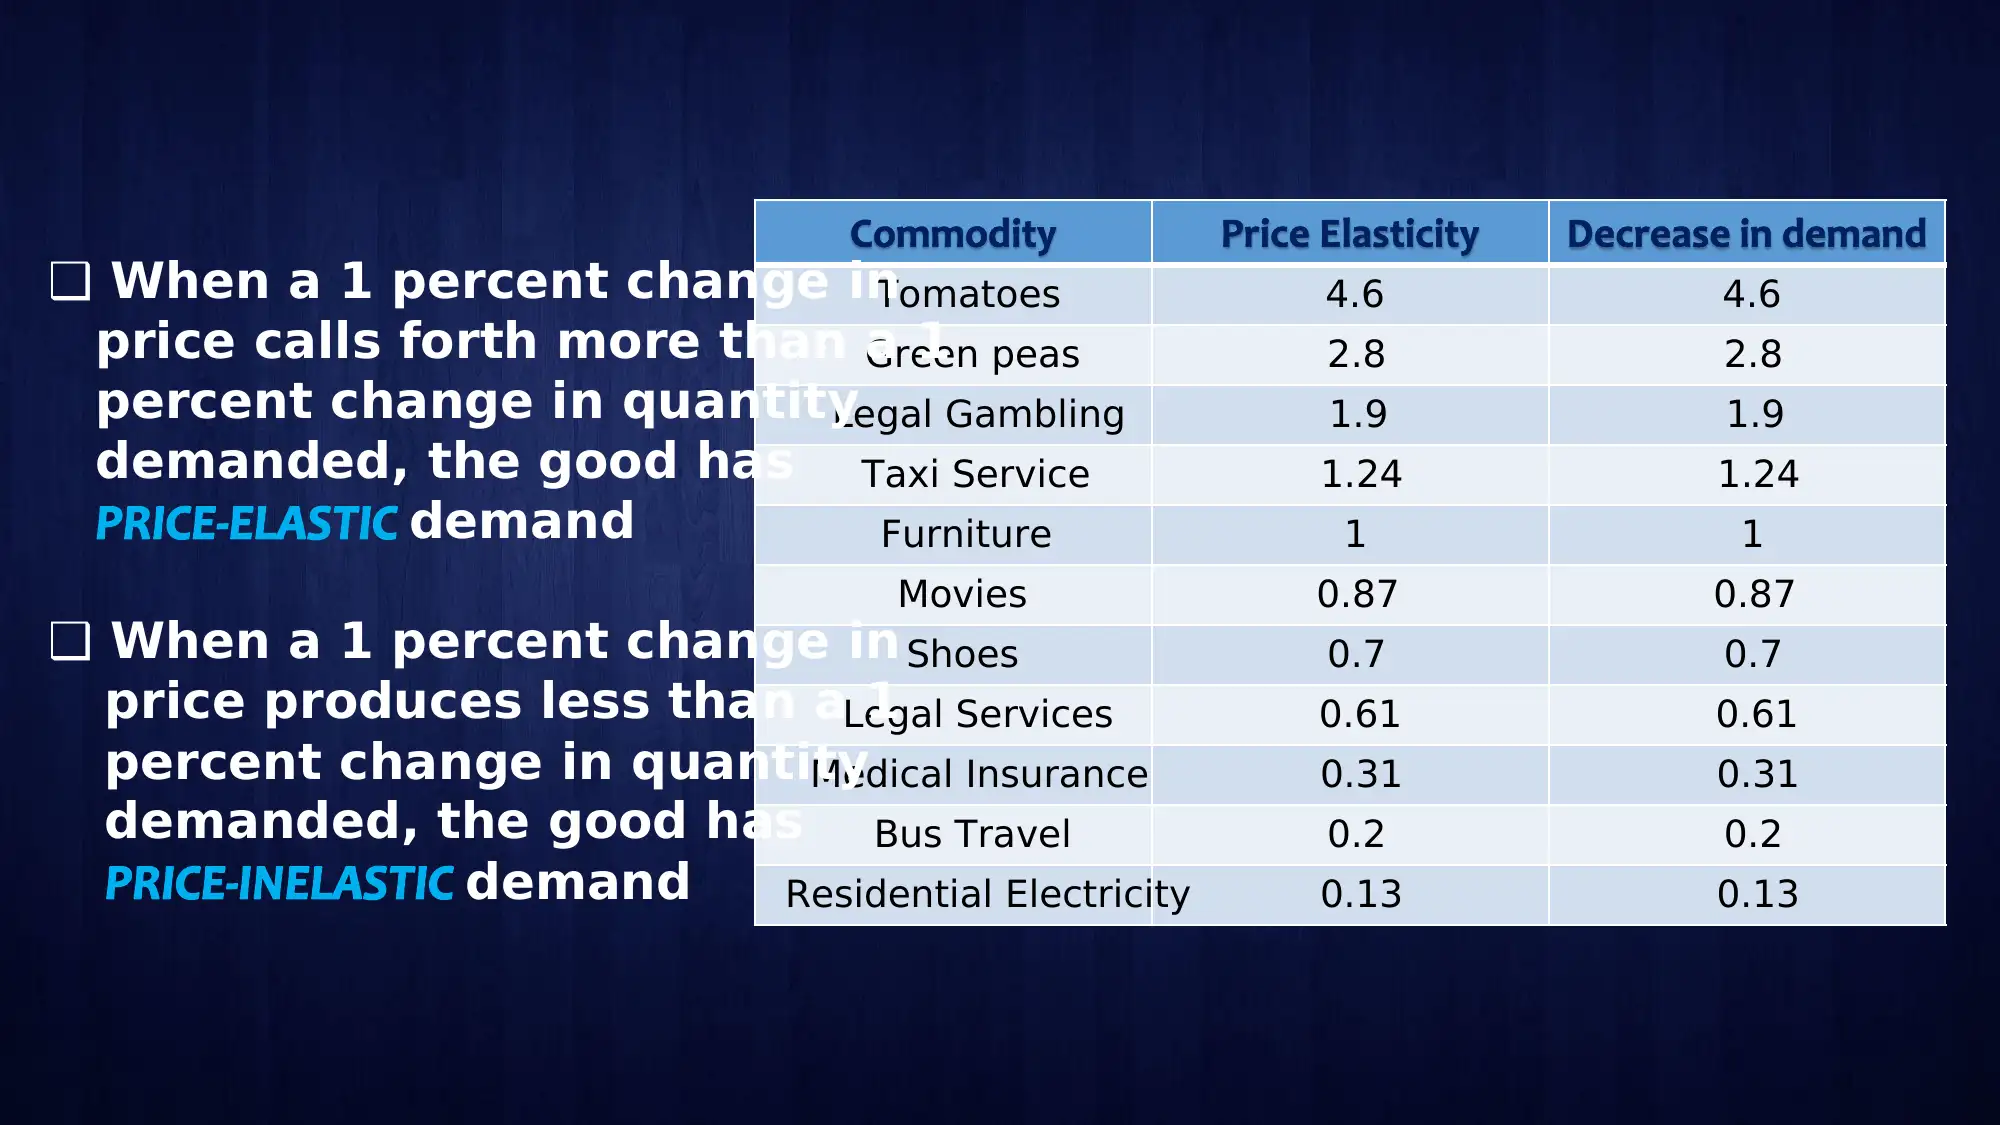
This economics assignment explores the concepts of marginal utility, market demand, and elasticity. The solution begins with a table demonstrating the utility of skiing, calculates marginal utility, and constructs a market demand curve. It determines the equilibrium price and quantity when lift tickets cost $40. The assignment further examines the impact of price changes on quantity demanded and income changes on consumer behavior. The solution also delves into the elasticity of demand for various goods, and analyzes the effects of supply restriction and taxation on addictive substances, comparing the two approaches and their implications on suppliers' income and market equilibrium. It includes graphical representations to illustrate demand and supply curves.
tabler-icon-diamond-filled.svg

Contribute Materials

Your contribution can guide someone’s learning journey. Share your documents today.
Document Page
Members
Amrina Rahman
Mushfiq Ahmed Prantik
Kanij Fatema Chaity
Noshin Rahman
Ramisa Tasfiah
tabler-icon-diamond-filled.svg

Secure Best Marks with AI Grader

Need help grading? Try our AI Grader for instant feedback on your assignments.
Document Page
-George Bernard Shaw
Topics:
Marginal Utility
Market Demand Curve
Calculating Equilibrium Price and Quantity
Document Page
Consider the following table showing the utility of diffe
numbers of days skied each year:
Number of days skied Total utility ($)
0 0
1 70
2 110
3 146
4 176
5 196
6 196
Construct a table showing the marginal utility for eachdayof skiing. Assuming that there are 1
people with preferences shown in the table, draw the market demand curve for sk
cost $40 per day, what are equilibrium price and quantity of days skied?
Document Page
What is ??
is the satisfaction received from consuming a good or service
is the additional utility from the consumption of
additional unit of a commodity
Marginal Utility = Change in Total Utility/ Change in Units
Total utility of a commodity increases adding the MU but at a dec
tabler-icon-diamond-filled.svg

Secure Best Marks with AI Grader

Need help grading? Try our AI Grader for instant feedback on your assignments.
Document Page
Analyzing the given table
0 0 0
1 70 70-0=70
2 110 110-70=40
3 146 146-110=36
4 176 176-146=30
5 196 196-176=20
6 196 196-196=0
Fig: MU for each day of skiing
For example,
Total Utility (Day 1) = 70
Total Utility (Day 2) = 110
So, 2ndday’s MU= 110-70=40
Total utility is theof the marginal utility up to that point
Ordinal measures are needed instead of cardinal numbe
Document Page
Market Demand Curve
Demand of all consumers of a good or service at a given price
Market demand curve is the at each price
Document Page
Assuming that there are 1 million people with preferences shown
0
70
40
36
30
20
00
10
20
30
40
50
60
70
80
Day 0 Day1 Day 2 Day 3 Day 4 Day 5 Day 6
Market Demand
Fig: Market Demand Curve
In the graph, with the decrease of marginal utility (price), numb
(quantity demanded) are increasing.
marginal utility ($) [price]
no. of days skied [quantity demanded]
tabler-icon-diamond-filled.svg

Paraphrase This Document

Need a fresh take? Get an instant paraphrase of this document with our AI Paraphraser
Document Page
Equilibrium Price and Quantity
Market equilibrium comes at the of supply and demand curves
No shortages or surpluses are occurred at this point
Increase in demand (holding other things constant) will cause the equilibrium p
increase, opposite situation lowers the price
Surpluses ( than equilibrium)
Shortages ( than equilibrium)
Equilibrium
Document Page
If lift tickets cost $40 per day, equilibrium price and quantity are -
0
70
40
36
30
20
00
40 40 40 40 40 40
0
10
20
30
40
50
60
70
80
Day 0 Day1 Day 2 Day 3 Day 4 Day 5 Day 6
Equilibrium Price and Quantity
Market Demand (Demand
Curve)
Ticket Cost (Supply Curve)
no. of days skied [quantity demanded]
The blue curve indicates dem
curve while the orange one
indicates supply curve. As sta
before, the intersecting point
40) determines the equilibriu
price and quantity. At the pri
$40 and quantity of 2, both t
supplier and consumer agree
reach the point.
marginal utility ($) [price]
Fig: Calculating Equilibrium Price and Quantity from Graph
Document Page
For each of the commodities in Table 5-2, calculate the impact of
price on quantity demanded. Similarly, for the goods in Table 5-3,
the impact of a 50 percent increase in consumer incomes?
tabler-icon-diamond-filled.svg

Secure Best Marks with AI Grader

Need help grading? Try our AI Grader for instant feedback on your assignments.
Document Page
What Is Of Demand?
Document Page
Tomatoes 4.6 4.6
Green peas 2.8 2.8
Legal Gambling 1.9 1.9
Taxi Service 1.24 1.24
Furniture 1 1
Movies 0.87 0.87
Shoes 0.7 0.7
Legal Services 0.61 0.61
Medical Insurance 0.31 0.31
Bus Travel 0.2 0.2
Residential Electricity 0.13 0.13
When a 1 percent change in
price calls forth more than a 1
percent change in quantity
demanded, the good has
demand
When a 1 percent change in
price produces less than a 1
percent change in quantity
demanded, the good has
demand
Document Page
What Is Of Demand?
Elasticity
tabler-icon-diamond-filled.svg

Paraphrase This Document

Need a fresh take? Get an instant paraphrase of this document with our AI Paraphraser
Document Page
Automobiles 2.46 1.23
Owner-Occupied housing 1.49 0.745
Furniture 1.48 0.74
Books 1.44 0.72
Restaurant meals 1.4 0.7
Clothing 1.02 0.51
Physicians services 0.75 0.375
Tobacco 0.64 0.32
Eggs 0.37 0.185
Margarine -0.2 -0.1
Pig products -0.2 -0.1
Flour -0.36 -0.18
Document Page
Document Page
(5,30)
(15,10)
(10,20)
P
0 Q
tabler-icon-diamond-filled.svg

Secure Best Marks with AI Grader

Need help grading? Try our AI Grader for instant feedback on your assignments.
Document Page
(5,30)
(15,10)
(10,20)
P
0 Q
Document Page
An interesting application of supply and demand to addictive
substances compares alternative techniques for supply
restriction. For this problem, assume that the demand for
addictive substances is inelastic.
a. One approach (used today for heroin and cocaine and for
alcohol during Prohibition) is to reduce supply at the nation’s
borders. Show how this raises price and increases the total
income of the
suppliers in the drug industry.
b. An alternative approach (followed today for tobacco and
alcohol) is to tax the goods heavily. Using the tax apparatus
developed in Chapter 4, show how this reduces the total income
of the suppliers in the drug industry.
c. Comment on the difference between the two approaches.
Document Page
tabler-icon-diamond-filled.svg

Paraphrase This Document

Need a fresh take? Get an instant paraphrase of this document with our AI Paraphraser
Document Page
Document Page
and on the difference between t
two approaches
Document Page
tabler-icon-diamond-filled.svg

Secure Best Marks with AI Grader

Need help grading? Try our AI Grader for instant feedback on your assignments.
Document Page
D
Price of drugs
Quantity of addictive drugs
A C
E
M
L
BF Y
X
O
Document Page
Document Page
chevron_up_icon
1 out of 25
circle_padding
hide_on_mobile
zoom_out_icon
logo.png

Your All-in-One AI-Powered Toolkit for Academic Success.

Available 24*7 on WhatsApp / Email

[object Object]