Mario's Pizza Business Report
VerifiedAdded on 2020/02/05
|14
|1891
|519
Report
AI Summary
This report provides a comprehensive financial analysis of Mario's Pizza. It includes a detailed income statement and balance sheet, followed by a thorough ratio analysis evaluating profitability, liquidity, and solvency. The analysis uses various financial ratios such as gross profit ratio, net profit ratio, current ratio, quick ratio, debt-to-equity ratio, total assets turnover ratio, and inventory turnover ratio to assess the business's performance. Limitations of ratio analysis are also discussed. Finally, the report concludes with recommendations for Mario, suggesting the purchase of a new vehicle and emphasizing the need for better control over indirect expenses to improve profitability. The report highlights the importance of accounting records for effective business management and decision-making.
MARIO PIZZA
Paraphrase This Document
Need a fresh take? Get an instant paraphrase of this document with our AI Paraphraser
TABLE OF CONTENTS
Income statement of Mario's Pizza.....................................................................................................................................................3
Balance sheet of Mario's Pizza...........................................................................................................................................................8
Evaluation of business performance through ratio analysis.............................................................................................................11
Limitations of ratio analysis.............................................................................................................................................................11
Recommend to Mario.......................................................................................................................................................................12
REFERENCES..........................................................................................................................................................................................13
INTRODUCTION
Accounting is the one of the field to which due importance is given in the current time period by the business firms. This is
because in same accounts are prepared which revealed different business transactions and performance of the business firm. In the
current report, income statement and balance sheet is prepared by following specific approach. Ratio analysis tools are used to analyze
the data and making interpretation in respect to the business firm. In depth analysis is done in the report and conclusion is formed on
that basis. Moreover, recommendation is made at end of the report. In this way, entire research work is carried out in the present study.
Analysis
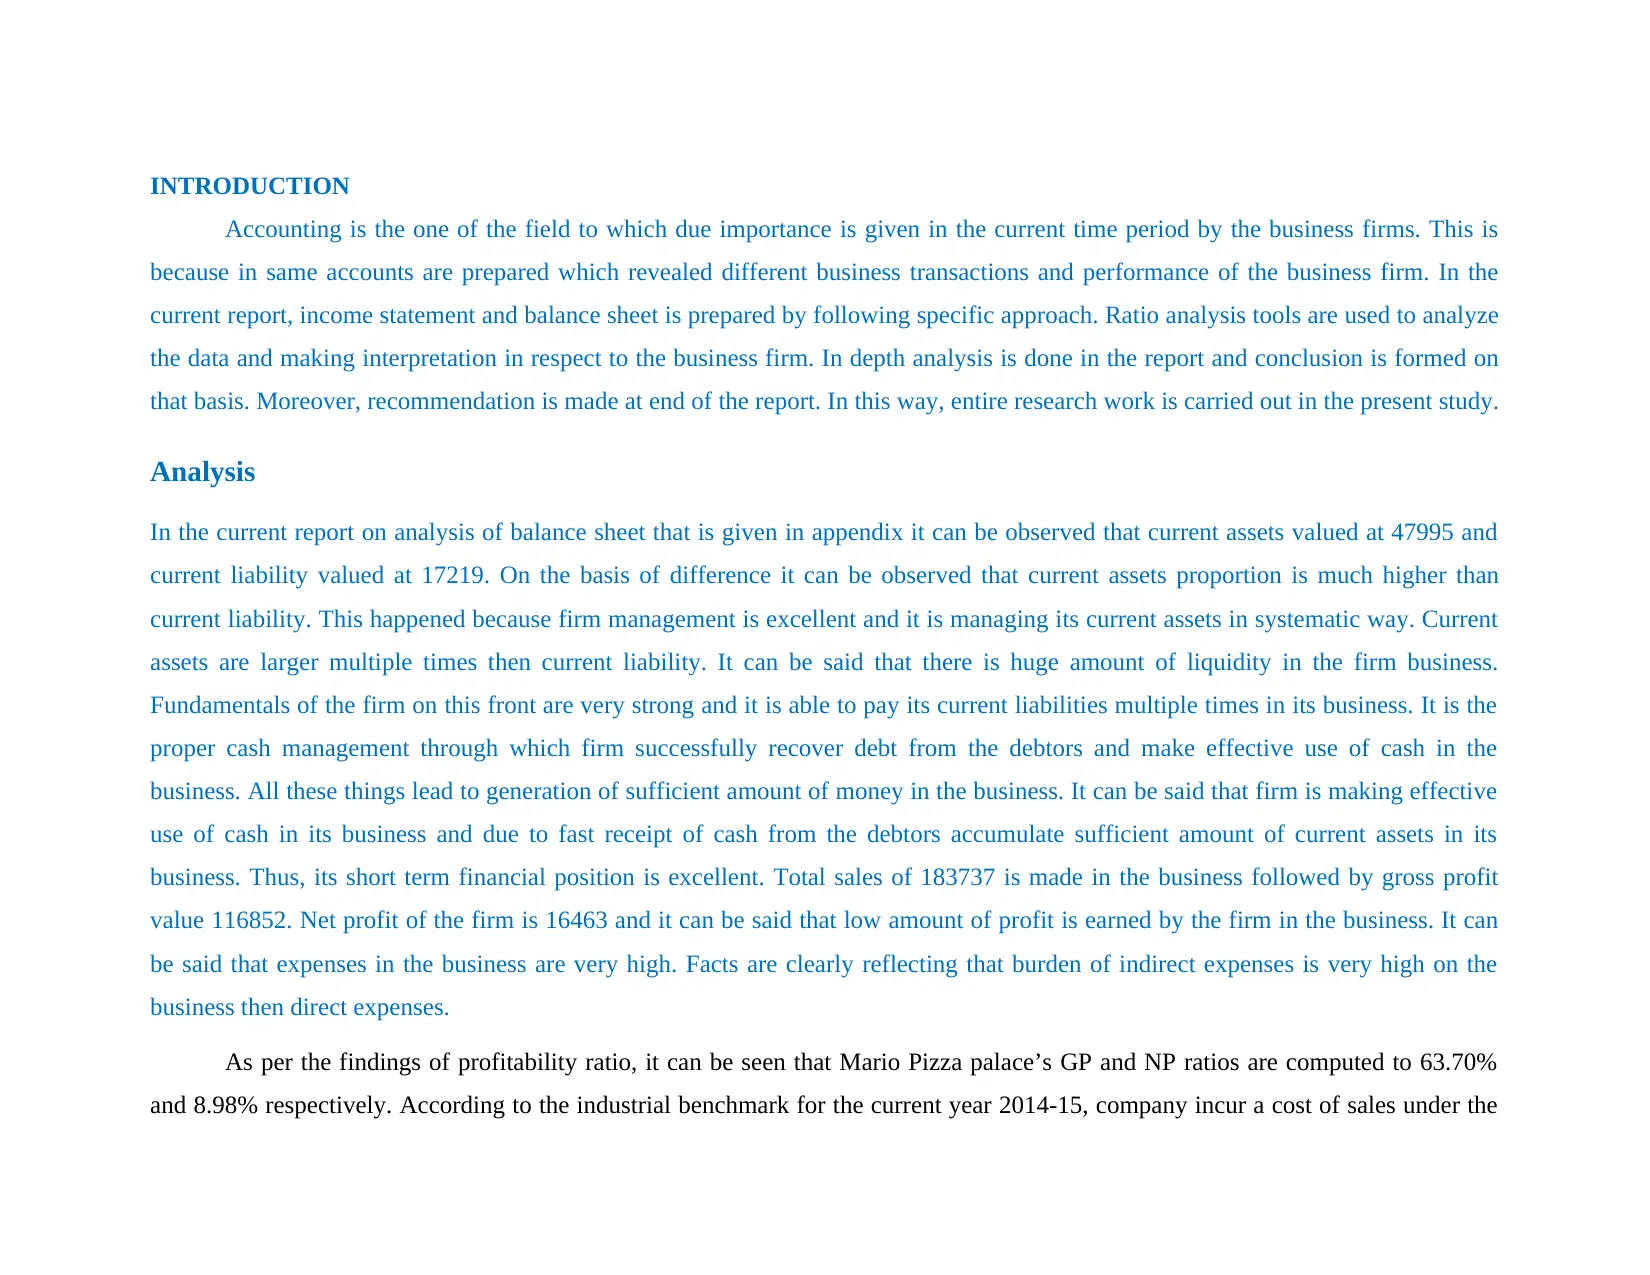
In the current report on analysis of balance sheet that is given in appendix it can be observed that current assets valued at 47995 and
current liability valued at 17219. On the basis of difference it can be observed that current assets proportion is much higher than
current liability. This happened because firm management is excellent and it is managing its current assets in systematic way. Current
assets are larger multiple times then current liability. It can be said that there is huge amount of liquidity in the firm business.
Fundamentals of the firm on this front are very strong and it is able to pay its current liabilities multiple times in its business. It is the
proper cash management through which firm successfully recover debt from the debtors and make effective use of cash in the
business. All these things lead to generation of sufficient amount of money in the business. It can be said that firm is making effective
use of cash in its business and due to fast receipt of cash from the debtors accumulate sufficient amount of current assets in its
business. Thus, its short term financial position is excellent. Total sales of 183737 is made in the business followed by gross profit
value 116852. Net profit of the firm is 16463 and it can be said that low amount of profit is earned by the firm in the business. It can
be said that expenses in the business are very high. Facts are clearly reflecting that burden of indirect expenses is very high on the
business then direct expenses.
As per the findings of profitability ratio, it can be seen that Mario Pizza palace’s GP and NP ratios are computed to 63.70%
and 8.98% respectively. According to the industrial benchmark for the current year 2014-15, company incur a cost of sales under the
Accounting is the one of the field to which due importance is given in the current time period by the business firms. This is
because in same accounts are prepared which revealed different business transactions and performance of the business firm. In the
current report, income statement and balance sheet is prepared by following specific approach. Ratio analysis tools are used to analyze
the data and making interpretation in respect to the business firm. In depth analysis is done in the report and conclusion is formed on
that basis. Moreover, recommendation is made at end of the report. In this way, entire research work is carried out in the present study.
Analysis
In the current report on analysis of balance sheet that is given in appendix it can be observed that current assets valued at 47995 and
current liability valued at 17219. On the basis of difference it can be observed that current assets proportion is much higher than
current liability. This happened because firm management is excellent and it is managing its current assets in systematic way. Current
assets are larger multiple times then current liability. It can be said that there is huge amount of liquidity in the firm business.
Fundamentals of the firm on this front are very strong and it is able to pay its current liabilities multiple times in its business. It is the
proper cash management through which firm successfully recover debt from the debtors and make effective use of cash in the
business. All these things lead to generation of sufficient amount of money in the business. It can be said that firm is making effective
use of cash in its business and due to fast receipt of cash from the debtors accumulate sufficient amount of current assets in its
business. Thus, its short term financial position is excellent. Total sales of 183737 is made in the business followed by gross profit
value 116852. Net profit of the firm is 16463 and it can be said that low amount of profit is earned by the firm in the business. It can
be said that expenses in the business are very high. Facts are clearly reflecting that burden of indirect expenses is very high on the
business then direct expenses.
As per the findings of profitability ratio, it can be seen that Mario Pizza palace’s GP and NP ratios are computed to 63.70%
and 8.98% respectively. According to the industrial benchmark for the current year 2014-15, company incur a cost of sales under the
⊘ This is a preview!⊘
Do you want full access?
Subscribe today to unlock all pages.
Trusted by 1+ million students worldwide
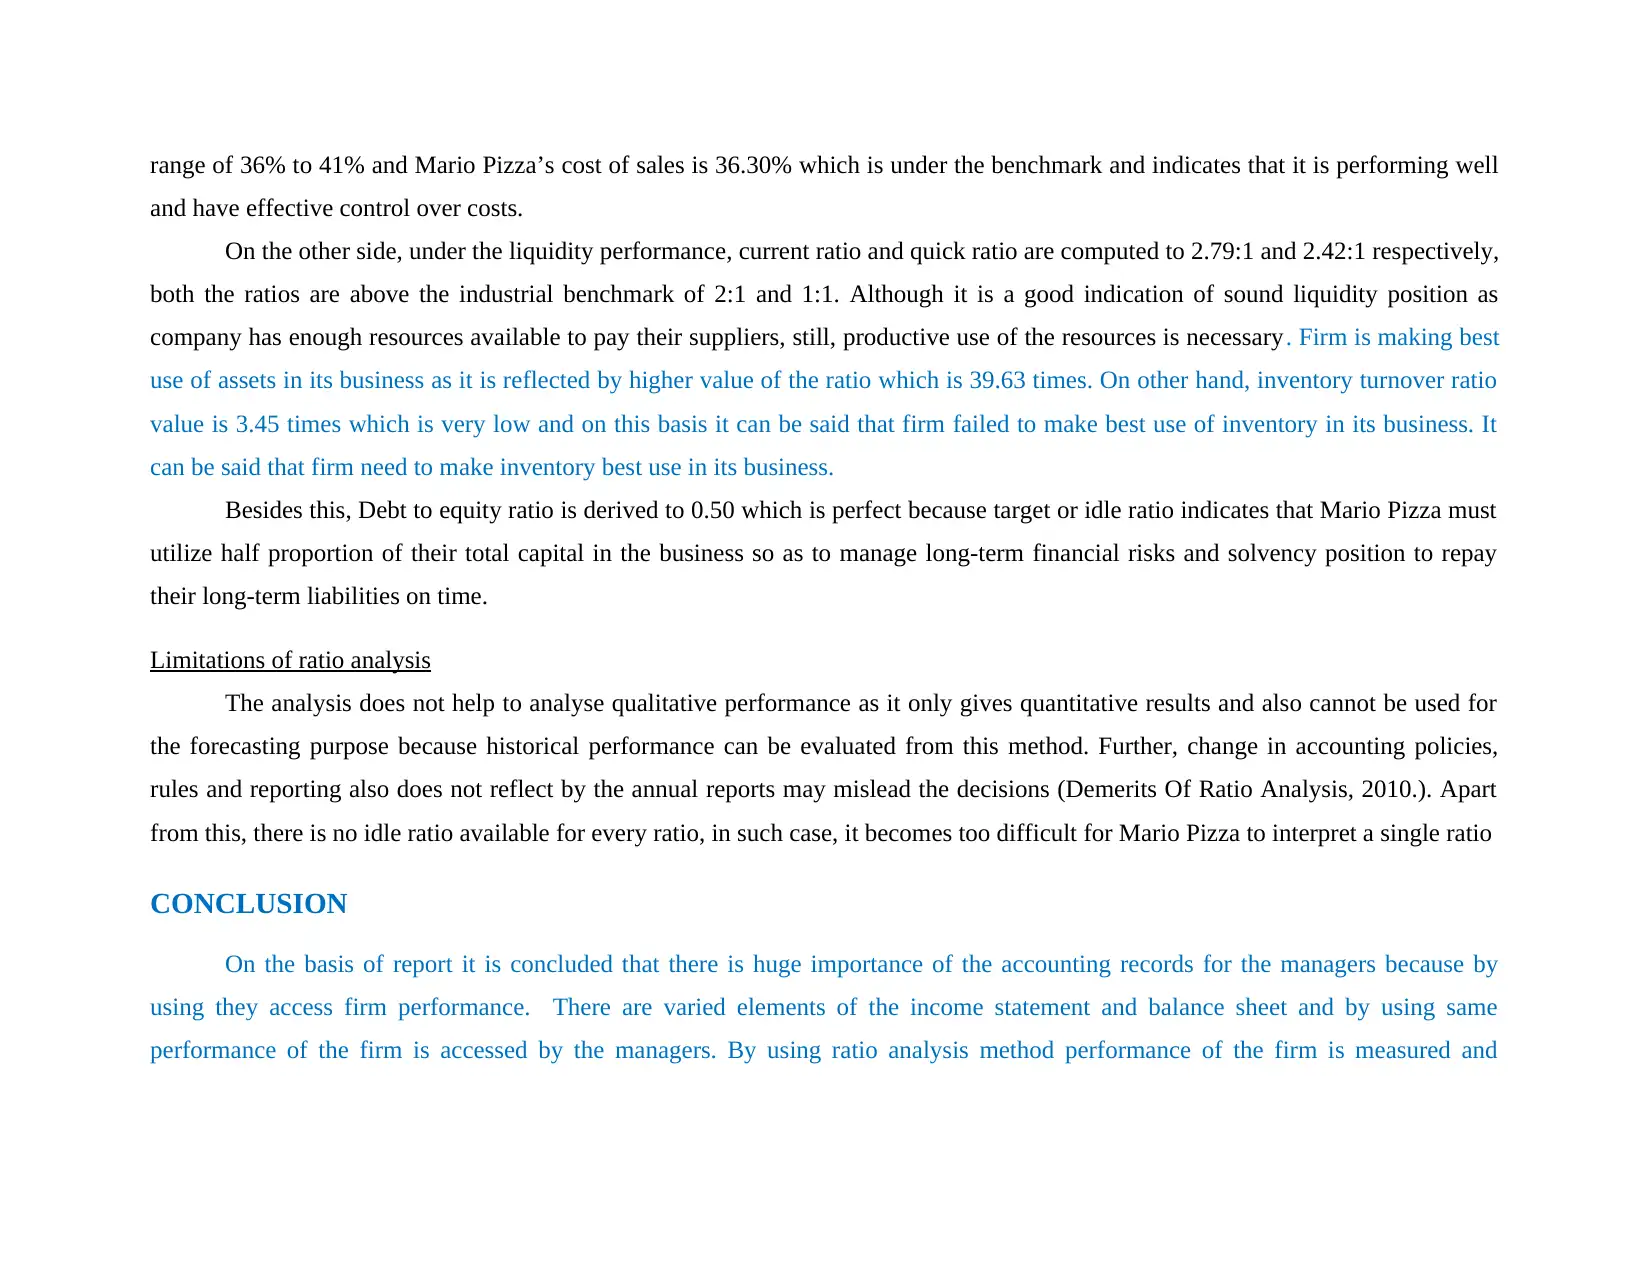
range of 36% to 41% and Mario Pizza’s cost of sales is 36.30% which is under the benchmark and indicates that it is performing well
and have effective control over costs.
On the other side, under the liquidity performance, current ratio and quick ratio are computed to 2.79:1 and 2.42:1 respectively,
both the ratios are above the industrial benchmark of 2:1 and 1:1. Although it is a good indication of sound liquidity position as
company has enough resources available to pay their suppliers, still, productive use of the resources is necessary. Firm is making best
use of assets in its business as it is reflected by higher value of the ratio which is 39.63 times. On other hand, inventory turnover ratio
value is 3.45 times which is very low and on this basis it can be said that firm failed to make best use of inventory in its business. It
can be said that firm need to make inventory best use in its business.
Besides this, Debt to equity ratio is derived to 0.50 which is perfect because target or idle ratio indicates that Mario Pizza must
utilize half proportion of their total capital in the business so as to manage long-term financial risks and solvency position to repay
their long-term liabilities on time.
Limitations of ratio analysis
The analysis does not help to analyse qualitative performance as it only gives quantitative results and also cannot be used for
the forecasting purpose because historical performance can be evaluated from this method. Further, change in accounting policies,
rules and reporting also does not reflect by the annual reports may mislead the decisions (Demerits Of Ratio Analysis, 2010.). Apart
from this, there is no idle ratio available for every ratio, in such case, it becomes too difficult for Mario Pizza to interpret a single ratio
CONCLUSION
On the basis of report it is concluded that there is huge importance of the accounting records for the managers because by
using they access firm performance. There are varied elements of the income statement and balance sheet and by using same
performance of the firm is accessed by the managers. By using ratio analysis method performance of the firm is measured and
Paraphrase This Document
Need a fresh take? Get an instant paraphrase of this document with our AI Paraphraser
managers identify areas where they need to do lots of work in order to improve performance. It can be said that there is huge
importance of ratio analysis method for the managers of the business by using same performance is accessed in systematic way.
Recommend to Mario
It can be recommended to the Mario that in needs to adopt option number three which is purchase of the new vehicle. If he will
purchase and buy the new vehicle then can use new features as well as it will have long life and beneficial for it. Apart from this, in
case if it buys second hand vehicle then there is no surety that vehicle will be better and along with this at here also cost needs to pay.
It is recommended that firm must not further issue equity in the upcoming time period because already there is high amount of equity
in the firm business. If firm will further issue fresh equity then in that case burden of cost of capital will increased on the firm. It is
also recommended that firm must maintain deep control on its indirect expense. This is because by doing profitability can be increased
in the business. In this regard cost control methods like process reengineering can be used by the business firm at the workplace. By
using method EOQ appropriate quantity can be purchased and storage cost can be reduced in the business.
REFERENCES
Agha, H., 2014. Impact of working capital management on profitability. European Scientific Journal, ESJ. 10(1).
Demerits Of Ratio Analysis, 2010. [Online]. Available through: <http://www.managementparadise.com/forums/financial-
management-fm/202052-demerits-ratio-analysis.html> [Accessed on 6th March 2017].
Lin, L. H. and et.al., 2014. The analysis of company liquidity a using cash conversion cycle application: evidence from Taiwan.
Global Journal of Business Research. 8(5). pp. 97.
⊘ This is a preview!⊘
Do you want full access?
Subscribe today to unlock all pages.
Trusted by 1+ million students worldwide
REFERENCES
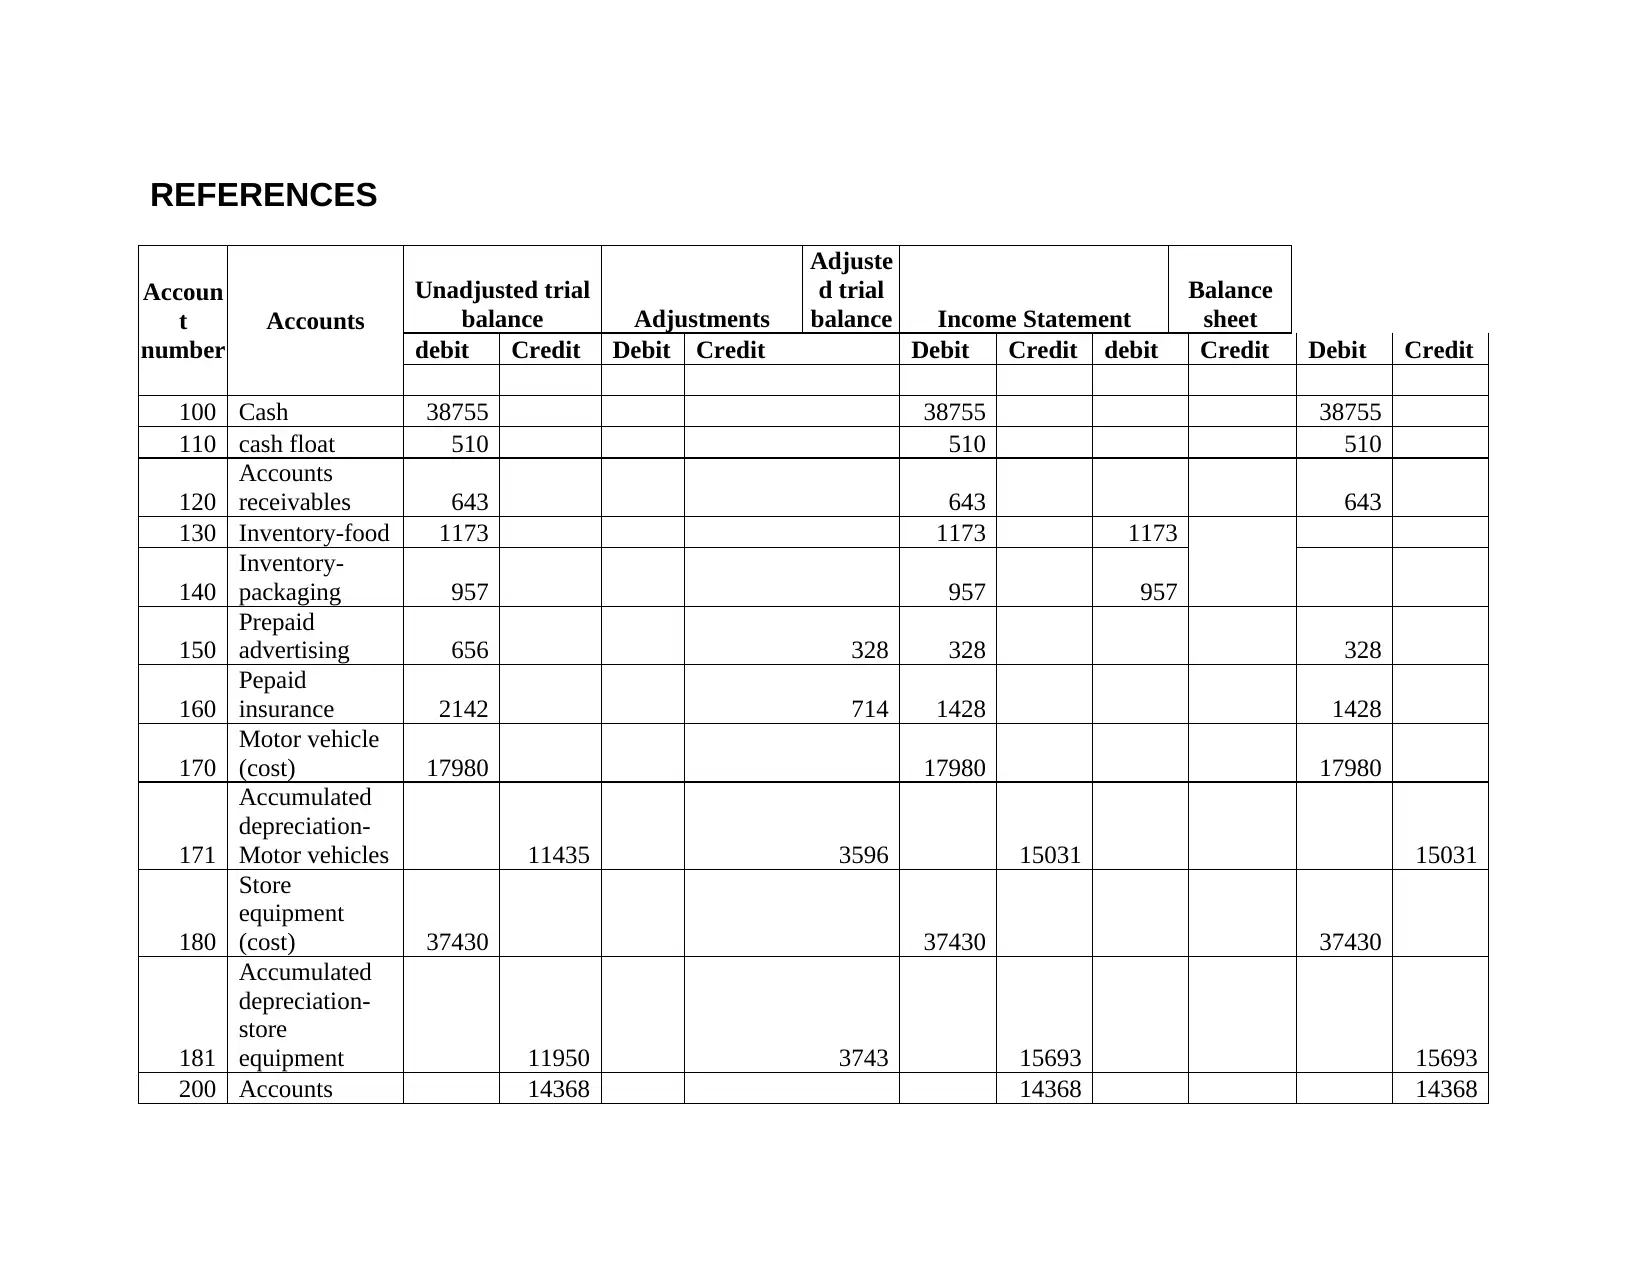
Accoun
t
number
Accounts
Unadjusted trial
balance Adjustments
Adjuste
d trial
balance Income Statement
Balance
sheet
debit Credit Debit Credit Debit Credit debit Credit Debit Credit
100 Cash 38755 38755 38755
110 cash float 510 510 510
120
Accounts
receivables 643 643 643
130 Inventory-food 1173 1173 1173
140
Inventory-
packaging 957 957 957
150
Prepaid
advertising 656 328 328 328
160
Pepaid
insurance 2142 714 1428 1428
170
Motor vehicle
(cost) 17980 17980 17980
171
Accumulated
depreciation-
Motor vehicles 11435 3596 15031 15031
180
Store
equipment
(cost) 37430 37430 37430
181
Accumulated
depreciation-
store
equipment 11950 3743 15693 15693
200 Accounts 14368 14368 14368
Paraphrase This Document
Need a fresh take? Get an instant paraphrase of this document with our AI Paraphraser
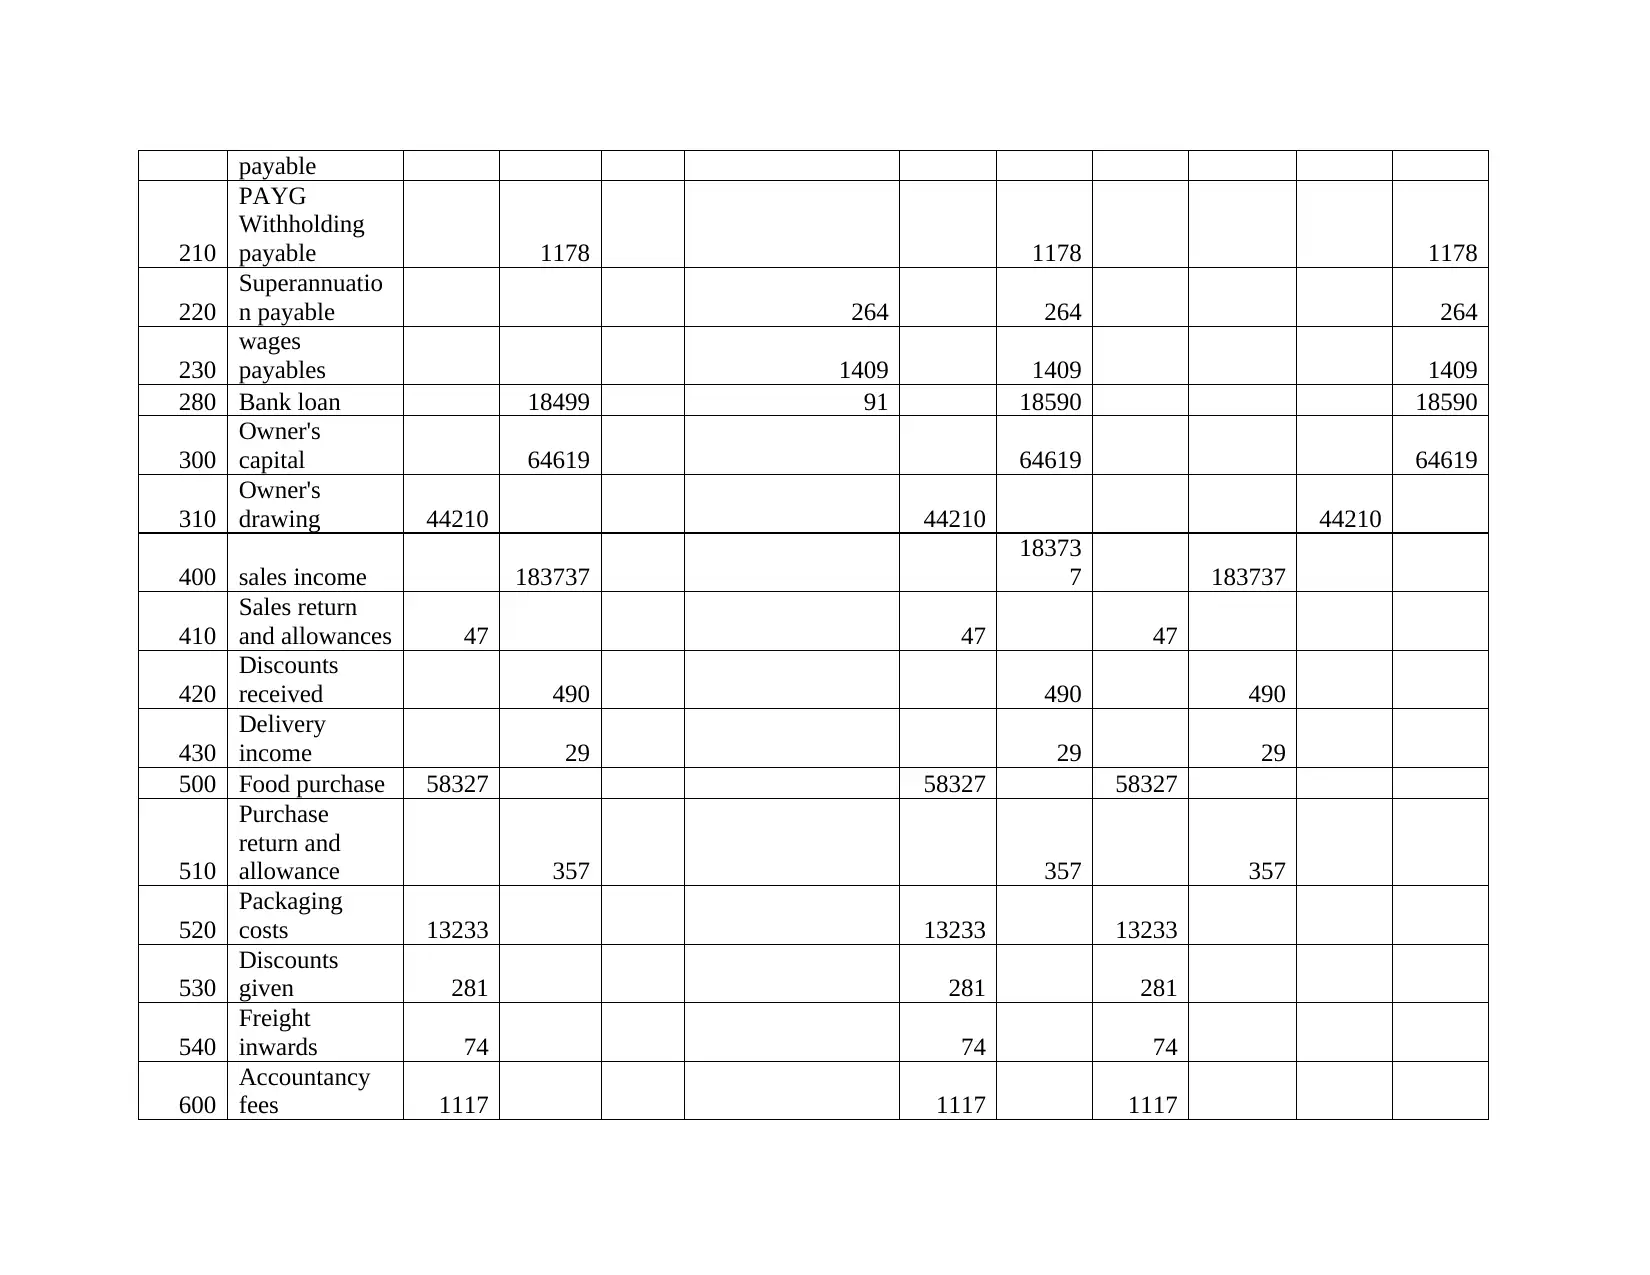
payable
210
PAYG
Withholding
payable 1178 1178 1178
220
Superannuatio
n payable 264 264 264
230
wages
payables 1409 1409 1409
280 Bank loan 18499 91 18590 18590
300
Owner's
capital 64619 64619 64619
310
Owner's
drawing 44210 44210 44210
400 sales income 183737
18373
7 183737
410
Sales return
and allowances 47 47 47
420
Discounts
received 490 490 490
430
Delivery
income 29 29 29
500 Food purchase 58327 58327 58327
510
Purchase
return and
allowance 357 357 357
520
Packaging
costs 13233 13233 13233
530
Discounts
given 281 281 281
540
Freight
inwards 74 74 74
600
Accountancy
fees 1117 1117 1117
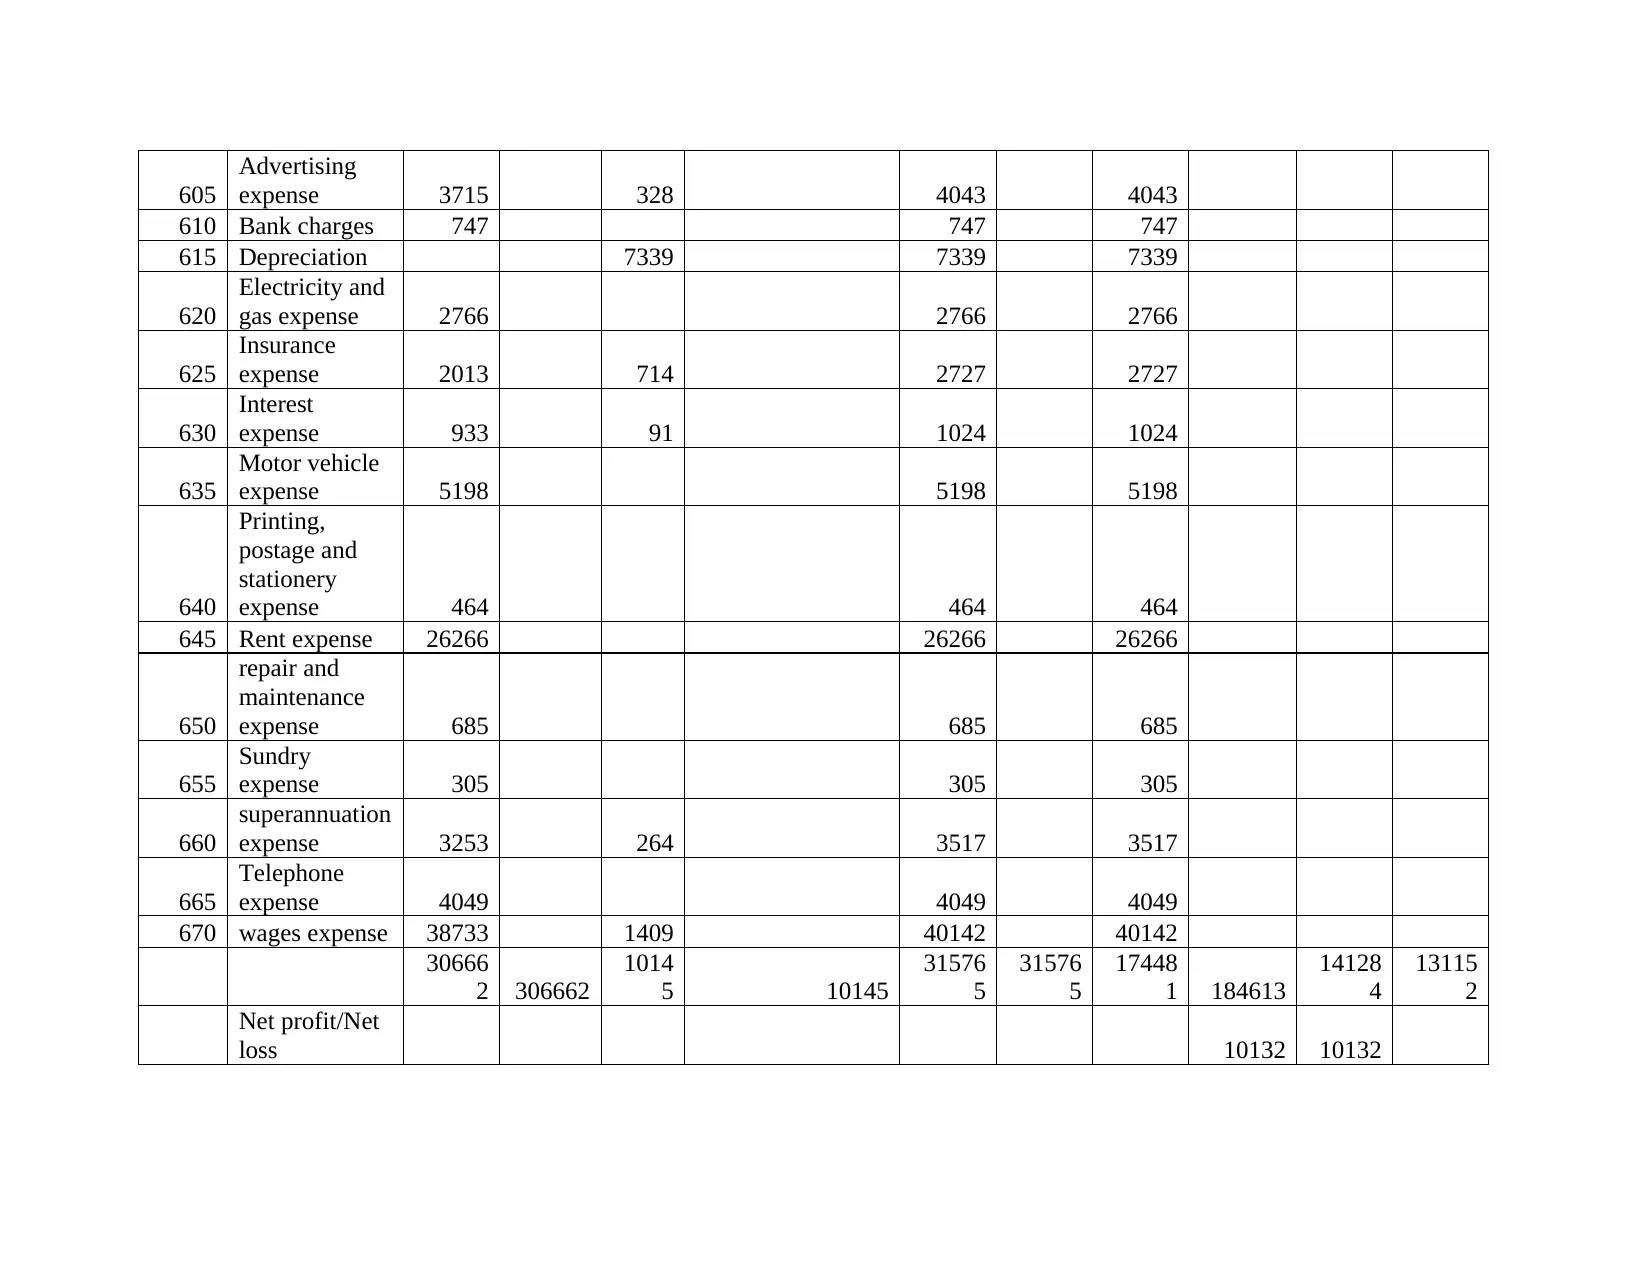
605
Advertising
expense 3715 328 4043 4043
610 Bank charges 747 747 747
615 Depreciation 7339 7339 7339
620
Electricity and
gas expense 2766 2766 2766
625
Insurance
expense 2013 714 2727 2727
630
Interest
expense 933 91 1024 1024
635
Motor vehicle
expense 5198 5198 5198
640
Printing,
postage and
stationery
expense 464 464 464
645 Rent expense 26266 26266 26266
650
repair and
maintenance
expense 685 685 685
655
Sundry
expense 305 305 305
660
superannuation
expense 3253 264 3517 3517
665
Telephone
expense 4049 4049 4049
670 wages expense 38733 1409 40142 40142
30666
2 306662
1014
5 10145
31576
5
31576
5
17448
1 184613
14128
4
13115
2
Net profit/Net
loss 10132 10132
⊘ This is a preview!⊘
Do you want full access?
Subscribe today to unlock all pages.
Trusted by 1+ million students worldwide
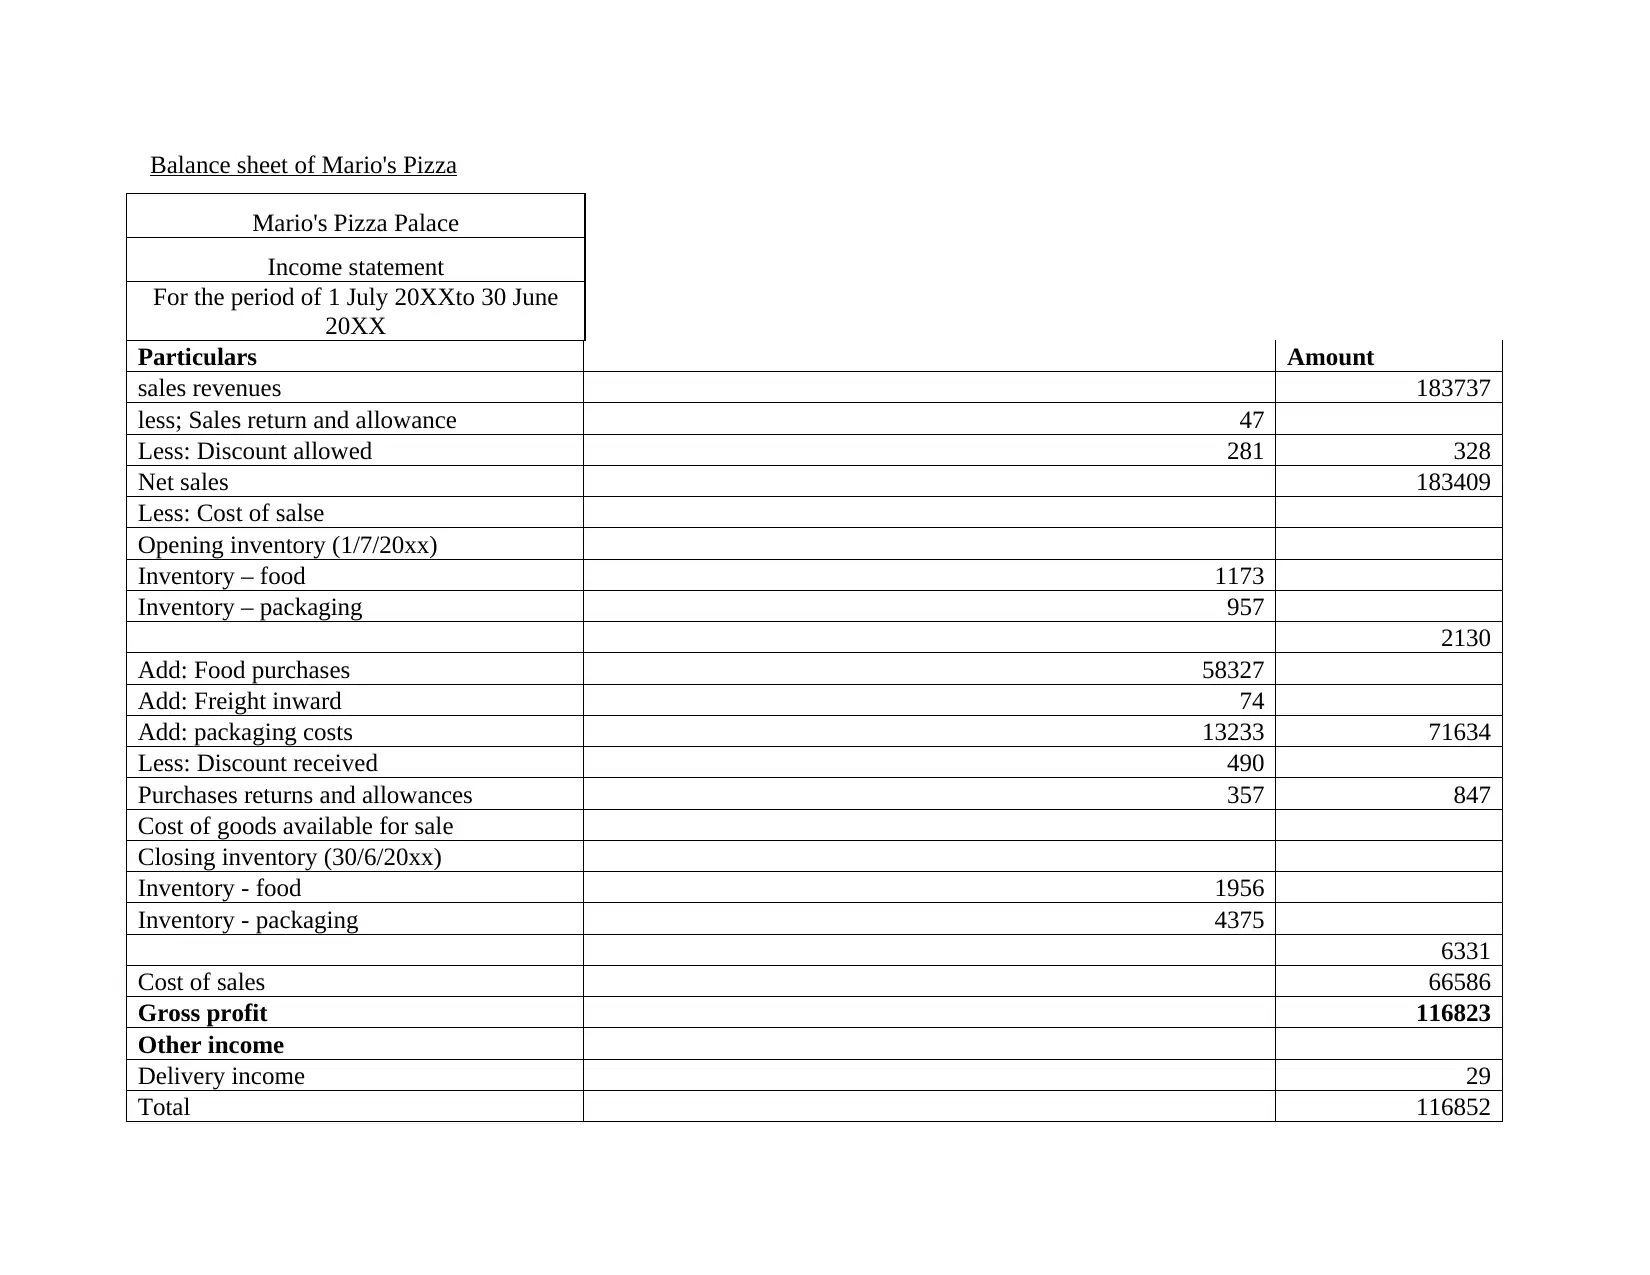
Balance sheet of Mario's Pizza
Mario's Pizza Palace
Income statement
For the period of 1 July 20XXto 30 June
20XX
Particulars Amount
sales revenues 183737
less; Sales return and allowance 47
Less: Discount allowed 281 328
Net sales 183409
Less: Cost of salse
Opening inventory (1/7/20xx)
Inventory – food 1173
Inventory – packaging 957
2130
Add: Food purchases 58327
Add: Freight inward 74
Add: packaging costs 13233 71634
Less: Discount received 490
Purchases returns and allowances 357 847
Cost of goods available for sale
Closing inventory (30/6/20xx)
Inventory - food 1956
Inventory - packaging 4375
6331
Cost of sales 66586
Gross profit 116823
Other income
Delivery income 29
Total 116852
Paraphrase This Document
Need a fresh take? Get an instant paraphrase of this document with our AI Paraphraser
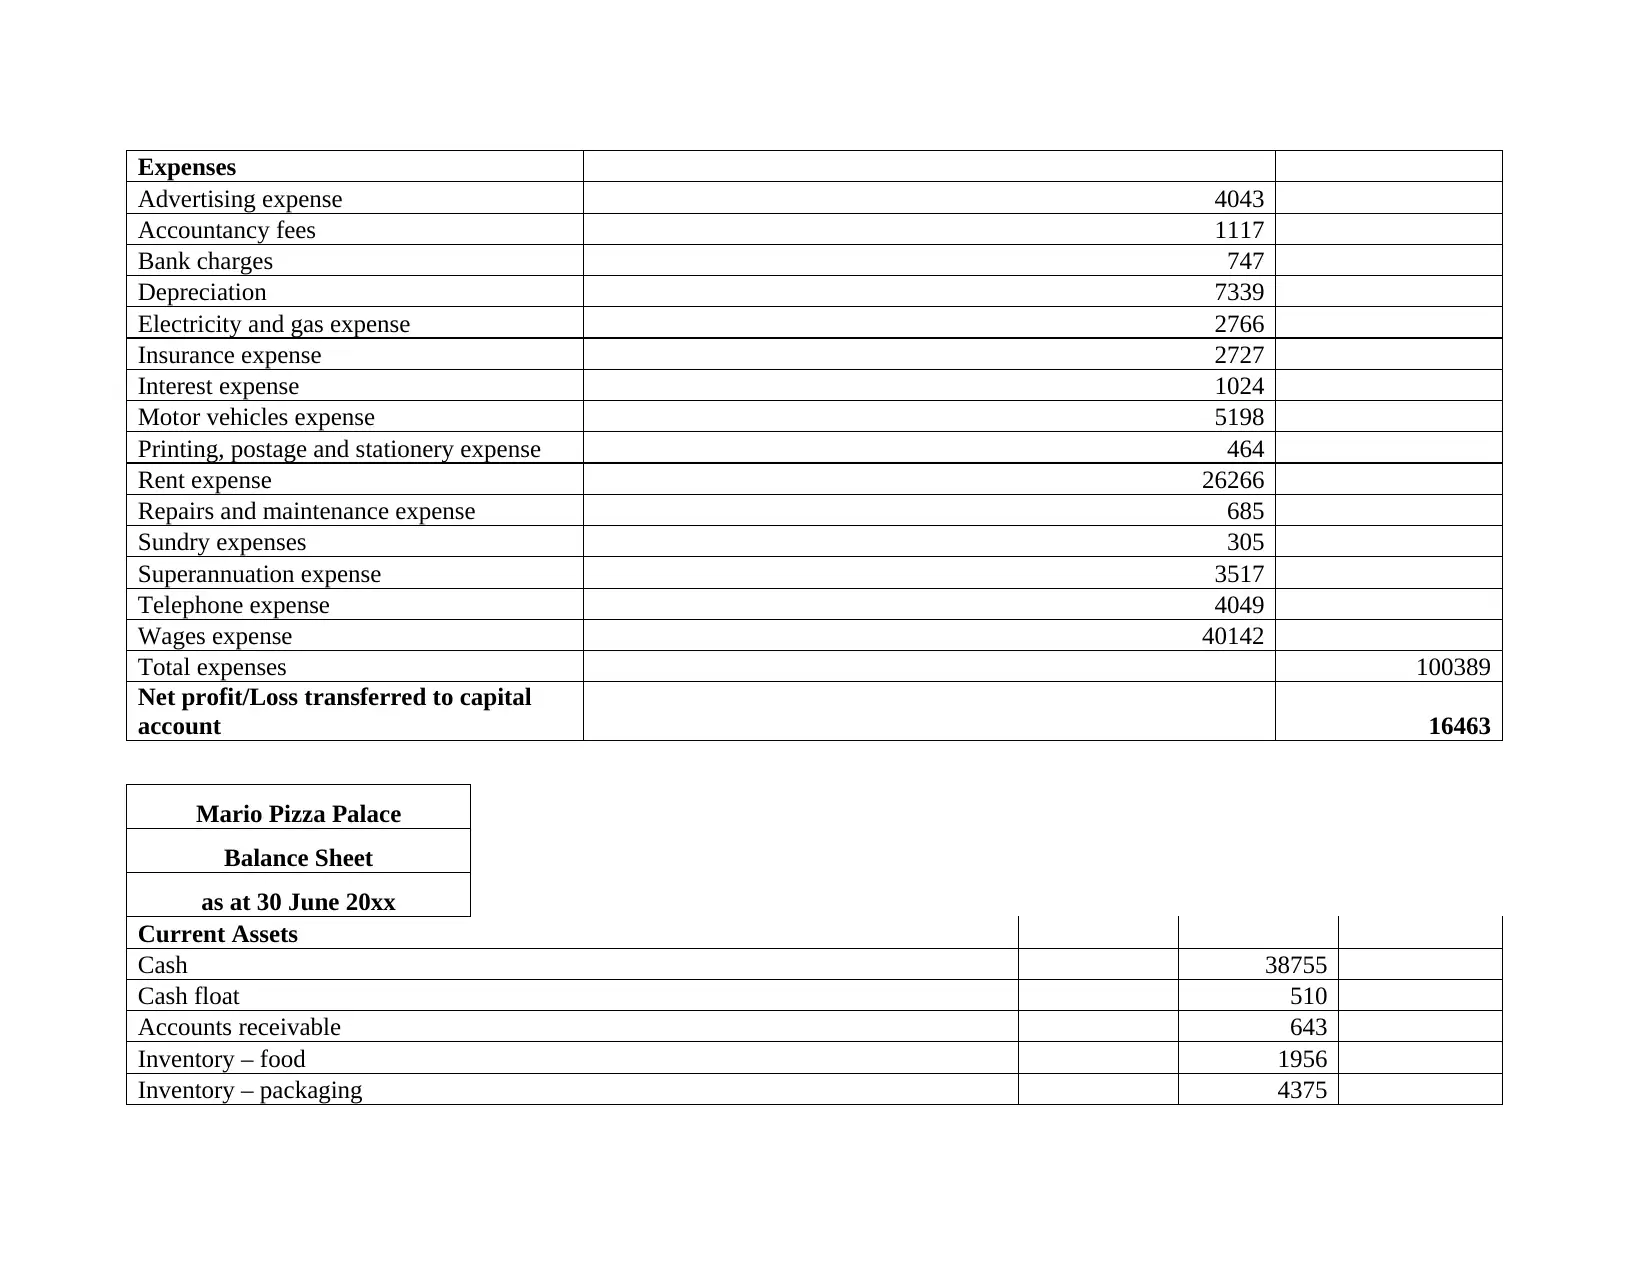
Expenses
Advertising expense 4043
Accountancy fees 1117
Bank charges 747
Depreciation 7339
Electricity and gas expense 2766
Insurance expense 2727
Interest expense 1024
Motor vehicles expense 5198
Printing, postage and stationery expense 464
Rent expense 26266
Repairs and maintenance expense 685
Sundry expenses 305
Superannuation expense 3517
Telephone expense 4049
Wages expense 40142
Total expenses 100389
Net profit/Loss transferred to capital
account 16463
Mario Pizza Palace
Balance Sheet
as at 30 June 20xx
Current Assets
Cash 38755
Cash float 510
Accounts receivable 643
Inventory – food 1956
Inventory – packaging 4375
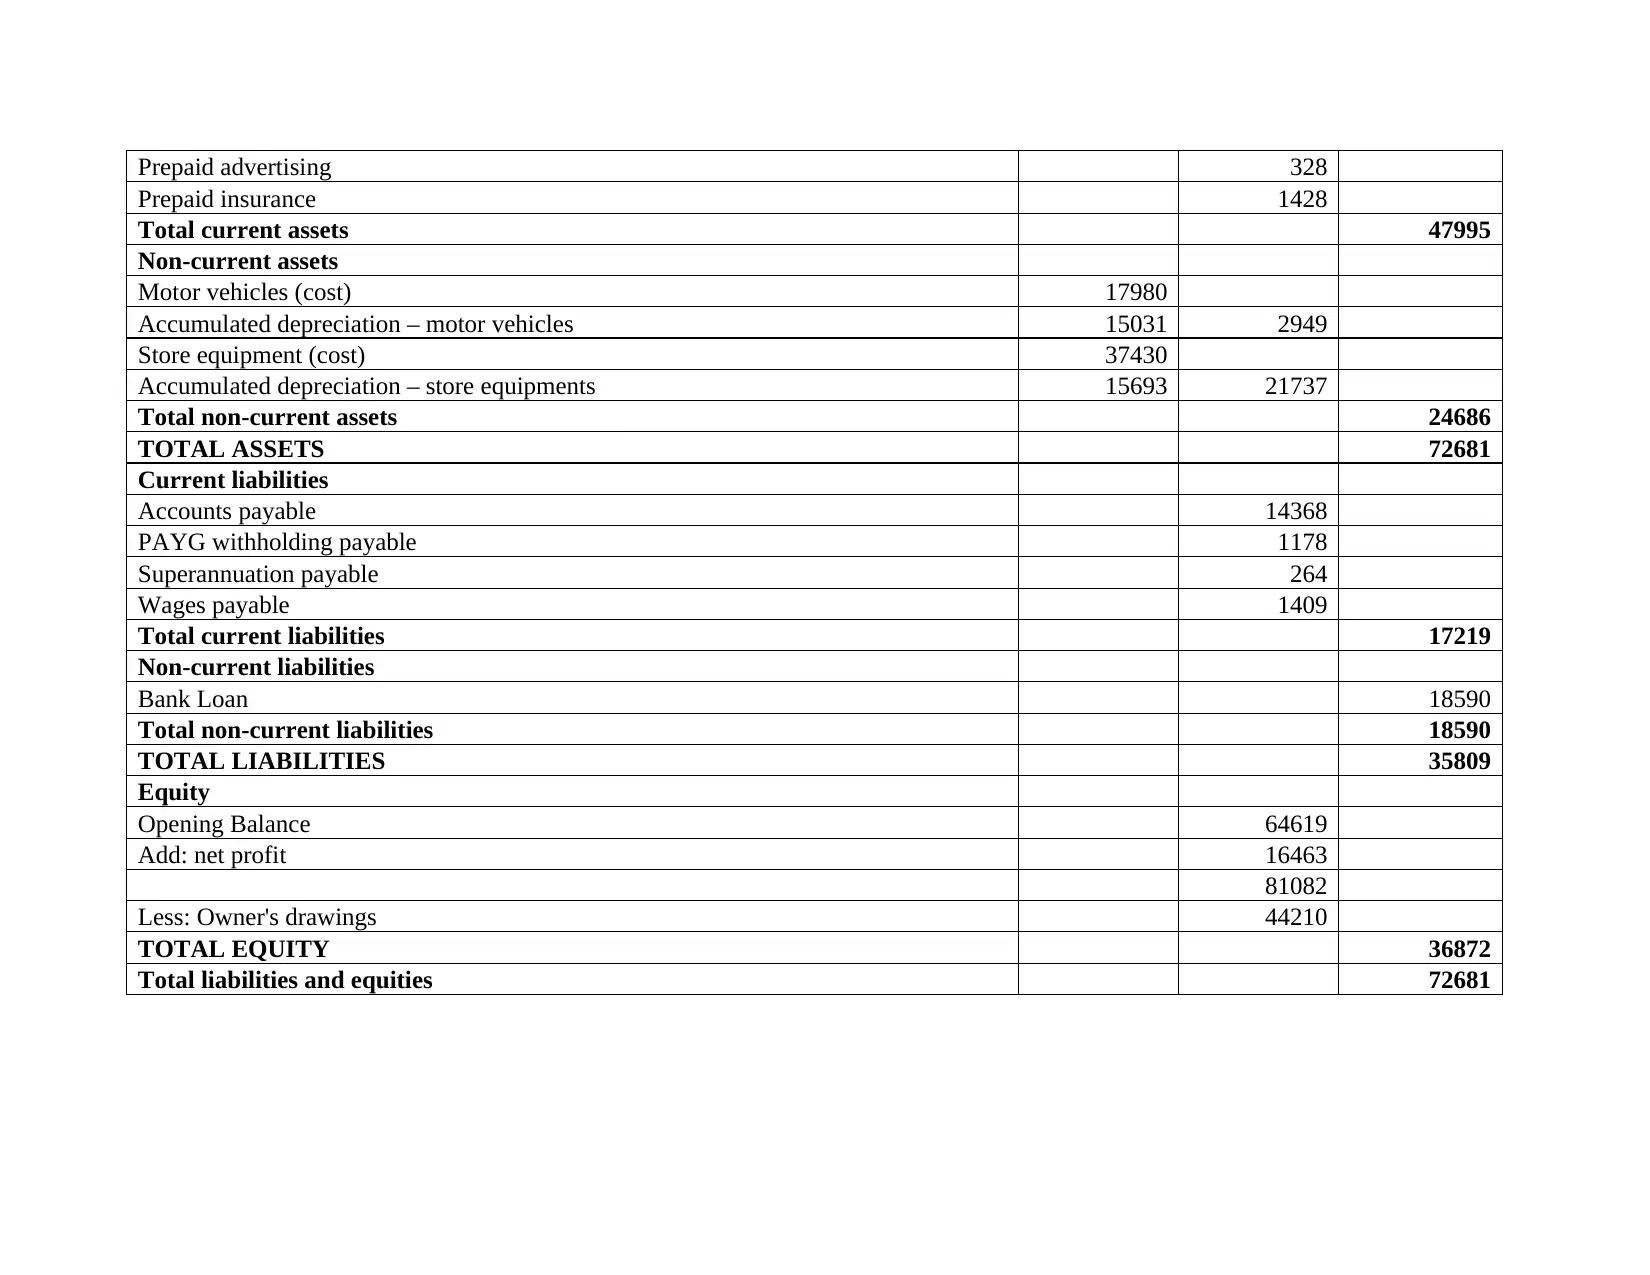
Prepaid advertising 328
Prepaid insurance 1428
Total current assets 47995
Non-current assets
Motor vehicles (cost) 17980
Accumulated depreciation – motor vehicles 15031 2949
Store equipment (cost) 37430
Accumulated depreciation – store equipments 15693 21737
Total non-current assets 24686
TOTAL ASSETS 72681
Current liabilities
Accounts payable 14368
PAYG withholding payable 1178
Superannuation payable 264
Wages payable 1409
Total current liabilities 17219
Non-current liabilities
Bank Loan 18590
Total non-current liabilities 18590
TOTAL LIABILITIES 35809
Equity
Opening Balance 64619
Add: net profit 16463
81082
Less: Owner's drawings 44210
TOTAL EQUITY 36872
Total liabilities and equities 72681
⊘ This is a preview!⊘
Do you want full access?
Subscribe today to unlock all pages.
Trusted by 1+ million students worldwide
1 out of 14
Related Documents


Your All-in-One AI-Powered Toolkit for Academic Success.
+13062052269
info@desklib.com
Available 24*7 on WhatsApp / Email
![[object Object]](/_next/static/media/star-bottom.7253800d.svg)
Unlock your academic potential
Copyright © 2020–2026 A2Z Services. All Rights Reserved. Developed and managed by ZUCOL.