Ratio Analysis Report: Market-Based and Working Capital Analysis

Verified

Added on  2021/06/18

|6
|1036
|413
Report
AI Summary
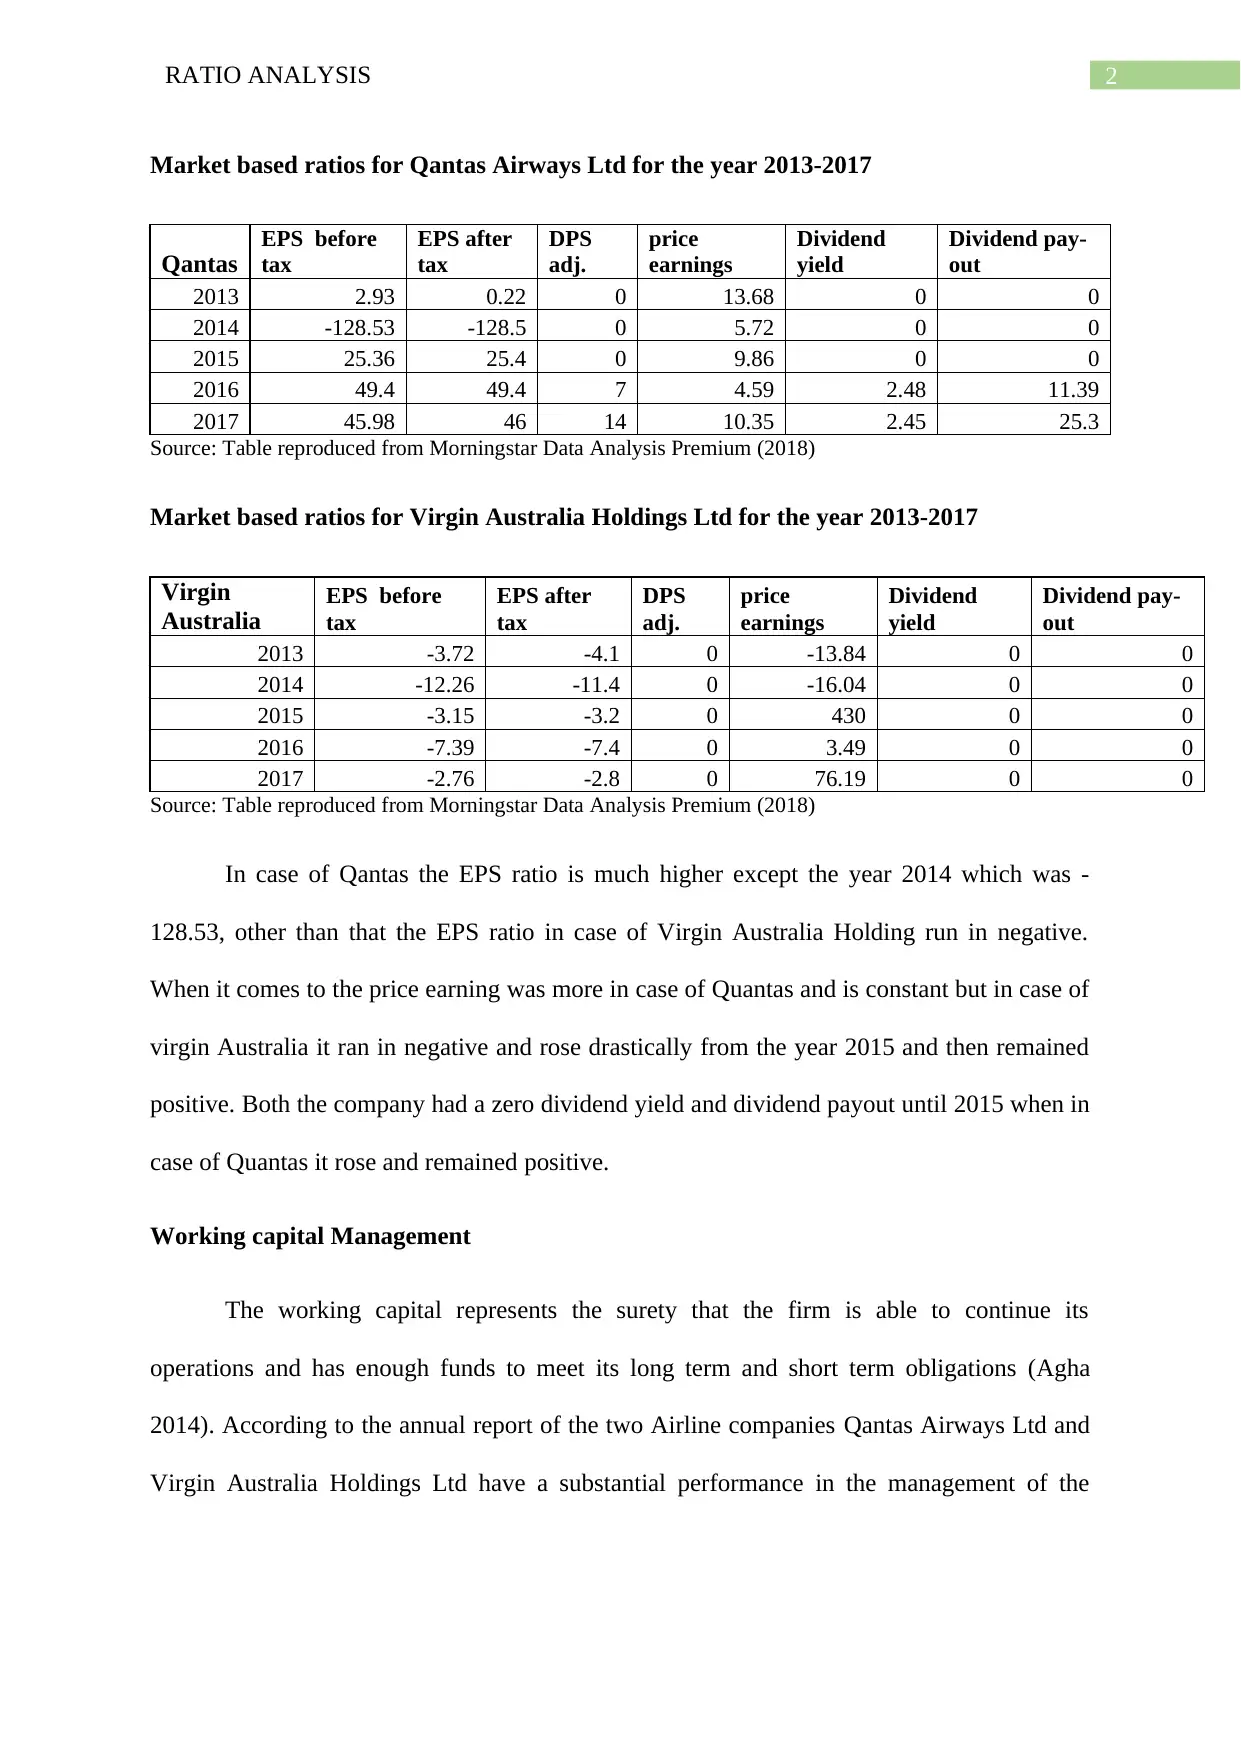
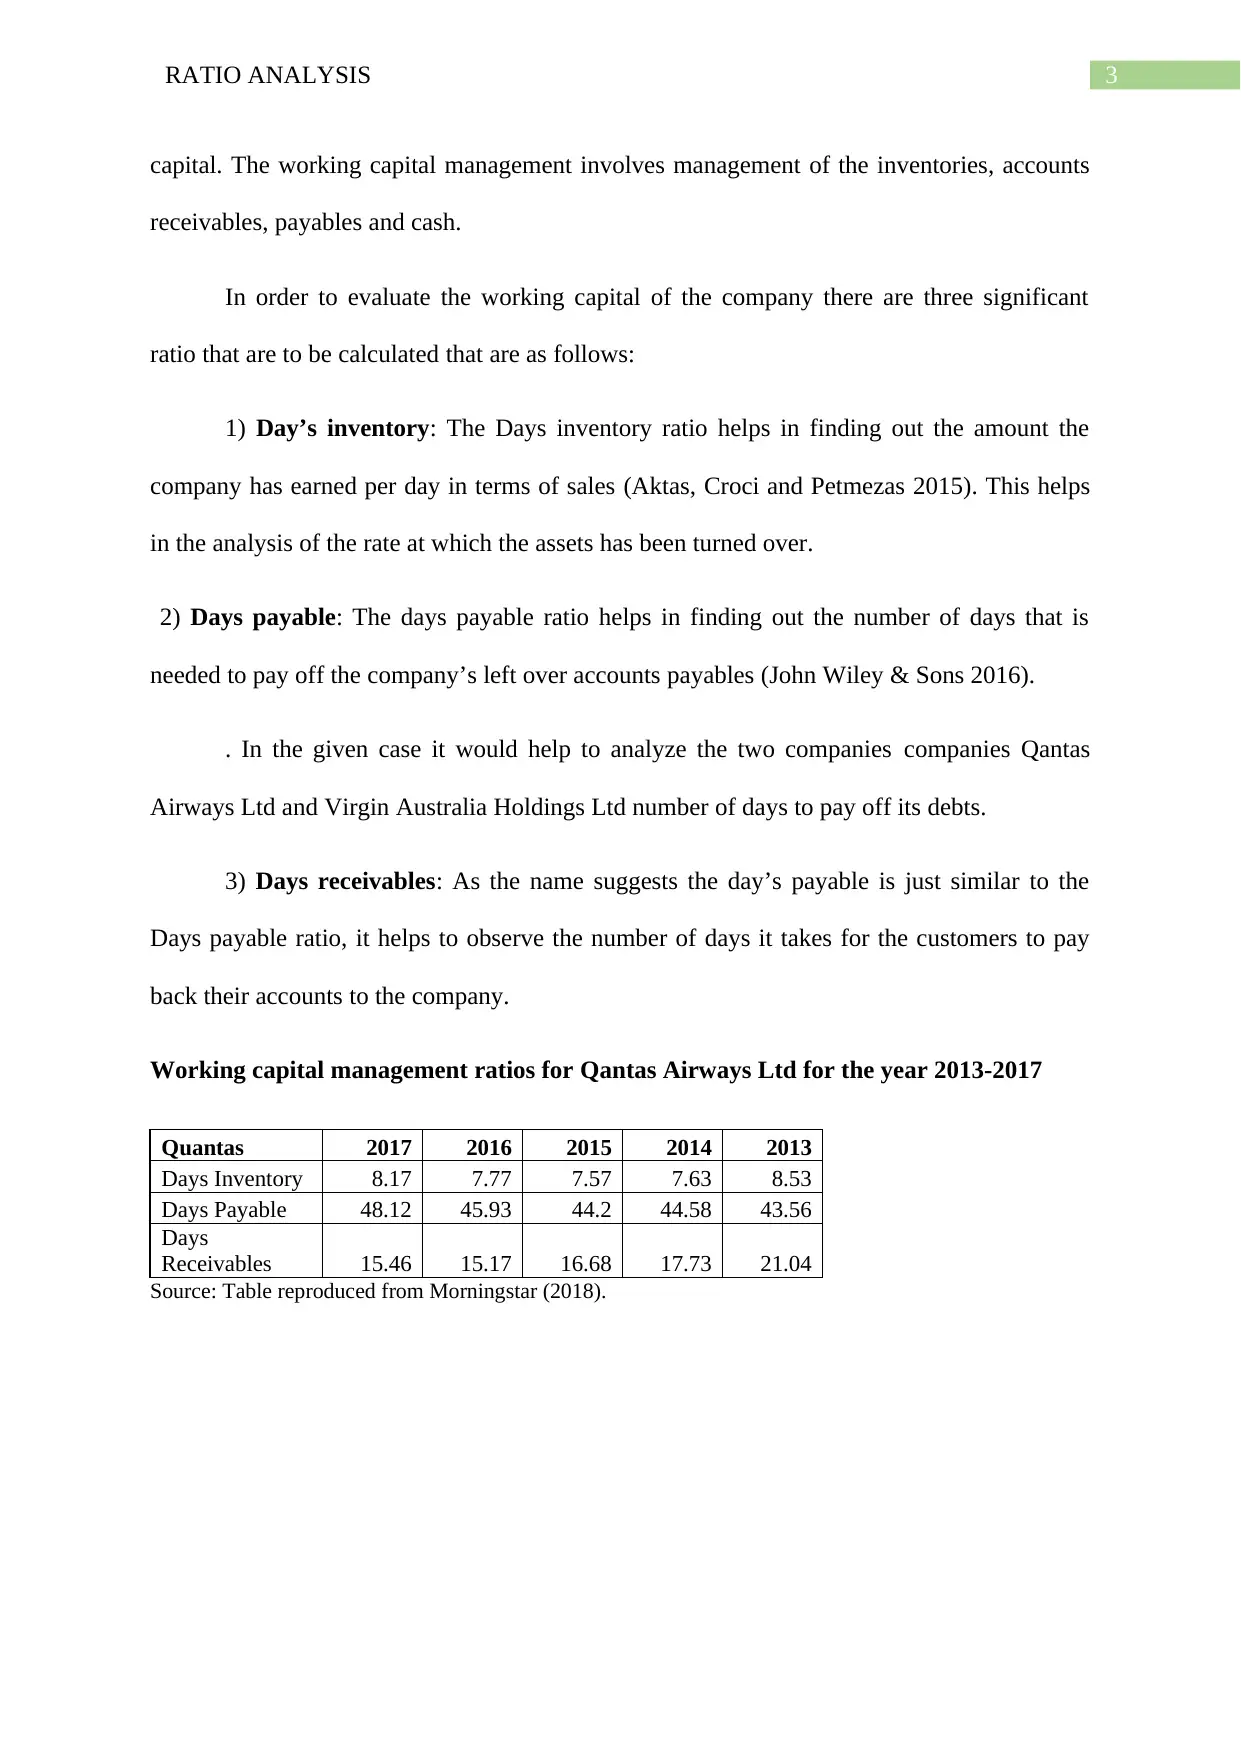
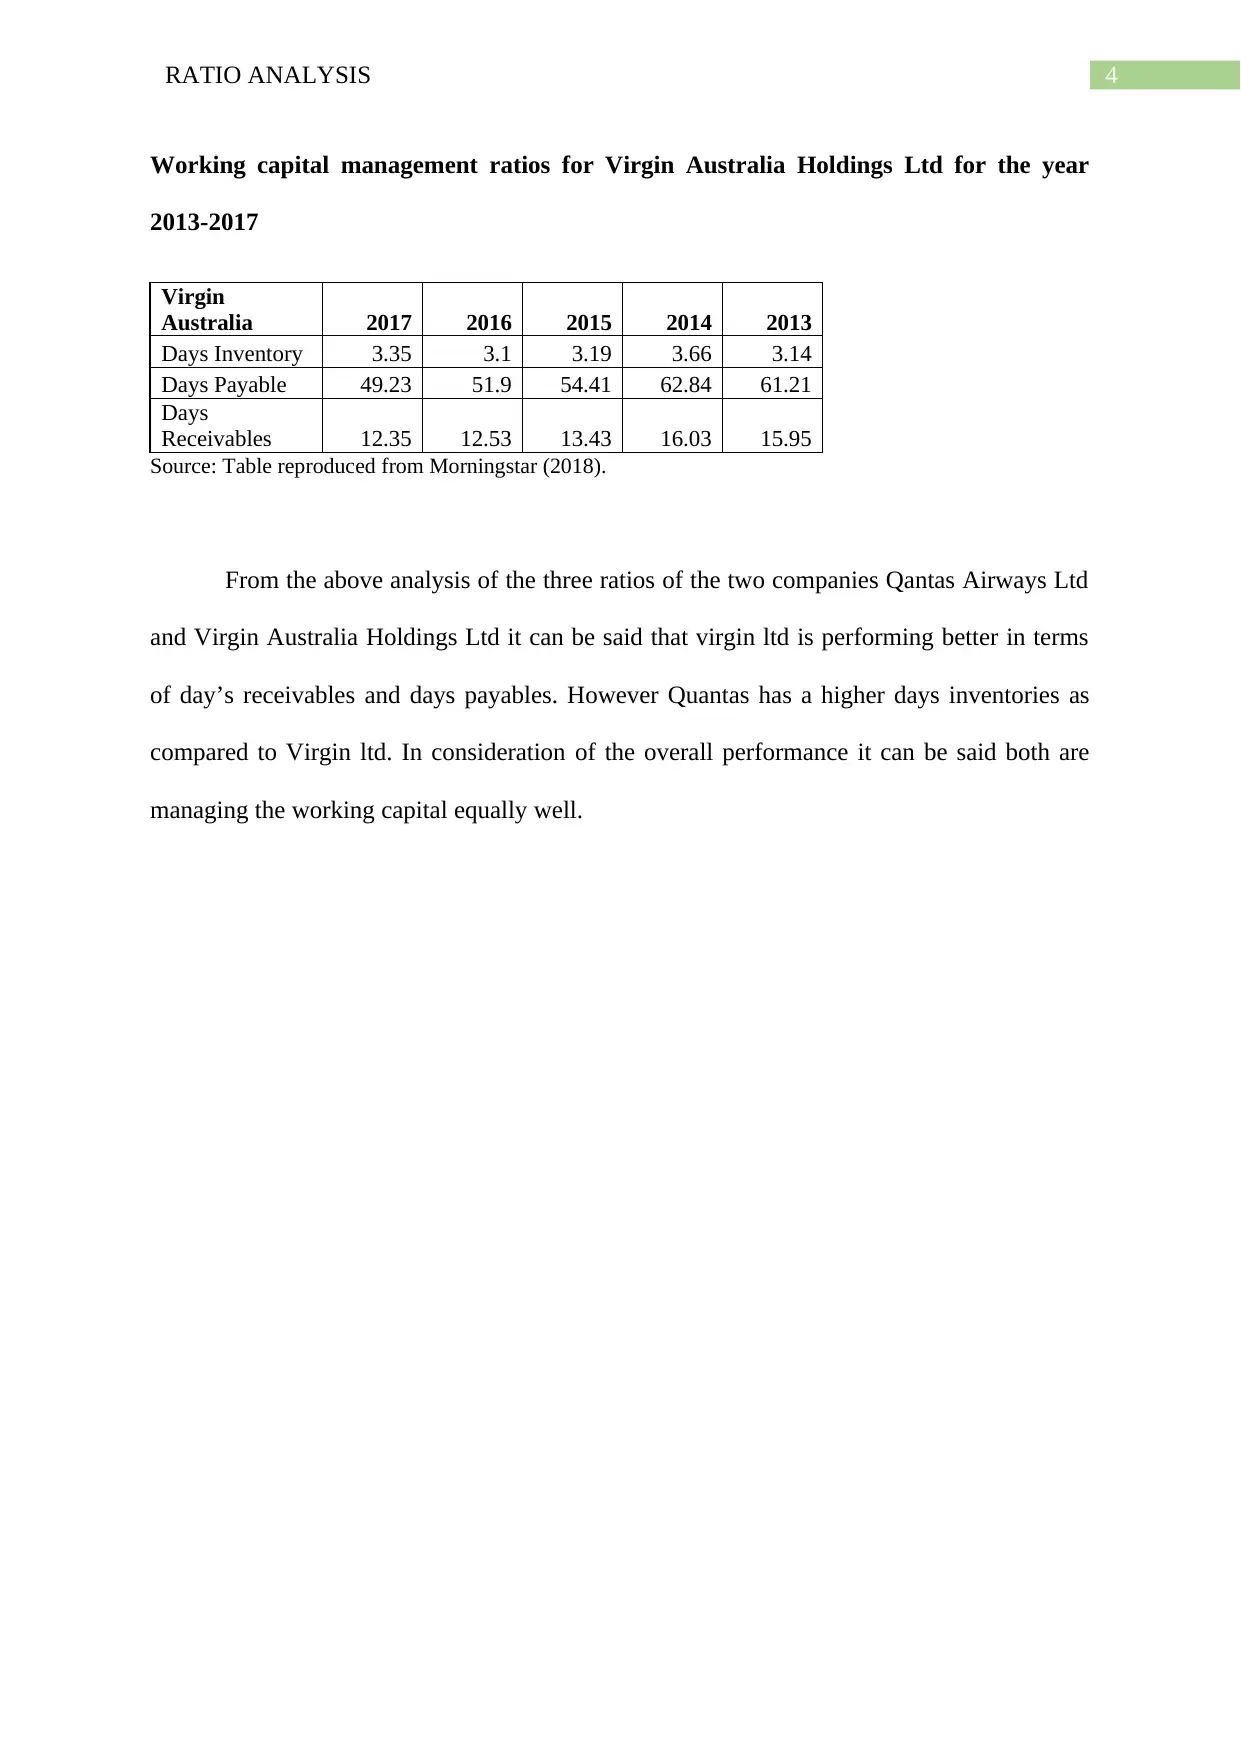
This report presents a comprehensive ratio analysis of two prominent airline companies, Qantas Airways Ltd and Virgin Australia Holdings Ltd, examining their financial performance from 2013 to 2017. The analysis encompasses both market-based ratios, including Earnings per Share (EPS), Price/Earnings (P/E) ratio, Dividend Yield, and Dividend Payout, and working capital management ratios such as Days Inventory, Days Payable, and Days Receivables. The market-based ratios are calculated to assess the valuation of the companies' shares, while the working capital ratios evaluate the efficiency of their operational liquidity. The report compares the performance of both companies across these key financial metrics, providing insights into their strengths and weaknesses in managing their financial resources and meeting their obligations. The analysis uses data from Morningstar Data Analysis Premium, offering a detailed overview of the companies' financial health and operational effectiveness. The report concludes by summarizing the comparative performance of the two companies based on the calculated ratios.
tabler-icon-diamond-filled.svg

Contribute Materials

Your contribution can guide someone’s learning journey. Share your documents today.
Document Page
Running head: RATIO ANALYSIS
Ratio Analysis
Name of the Student
Name of the University
Author Note
tabler-icon-diamond-filled.svg

Secure Best Marks with AI Grader

Need help grading? Try our AI Grader for instant feedback on your assignments.
Document Page
1RATIO ANALYSIS
Market based Ratio
The market based ratios are used for the assessment of the current price if the shares
of a public limited comoany.The ratio helps to find out whether the company shares are
overpriced or underpriced (ANTREAS 2017). The ratio analysis are generally done by the
investors for a better decision making. For the purpose of the analysis two airline companies
has been chosen namely Qantas Airways Ltd and Virgin Australia Holdings Ltd. Both the
companies are listed in the Australian Stock Exchange (ASX). The market ratio analysis will
be for the last five financial year that is from 2013 to 2017.
The market based Market based ratios are also included as the entities are listed
companies. They are calculated by,
Earnings per ordinary share or EPOS
Price / Earnings or P/E
Dividend Yield or DY
Dividend Payout or DP
The formula for calculation of the above ratios are as follows:
EPOS=Profit after income tax-preference dividends/weighted average number of
ordinary shares issued
P/E ratio=Market price per ordinary shares/earning per ordinary share
DY=Annual dividend per ordinary share/market price per ordinary share
DP=Total dividends per ordinary share/ earning per ordinary shares
Document Page
2RATIO ANALYSIS
Market based ratios for Qantas Airways Ltd for the year 2013-2017
Qantas
EPS before
tax
EPS after
tax
DPS
adj.
price
earnings
Dividend
yield
Dividend pay-
out
2013 2.93 0.22 0 13.68 0 0
2014 -128.53 -128.5 0 5.72 0 0
2015 25.36 25.4 0 9.86 0 0
2016 49.4 49.4 7 4.59 2.48 11.39
2017 45.98 46 14 10.35 2.45 25.3
Source: Table reproduced from Morningstar Data Analysis Premium (2018)
Market based ratios for Virgin Australia Holdings Ltd for the year 2013-2017
Virgin
Australia
EPS before
tax
EPS after
tax
DPS
adj.
price
earnings
Dividend
yield
Dividend pay-
out
2013 -3.72 -4.1 0 -13.84 0 0
2014 -12.26 -11.4 0 -16.04 0 0
2015 -3.15 -3.2 0 430 0 0
2016 -7.39 -7.4 0 3.49 0 0
2017 -2.76 -2.8 0 76.19 0 0
Source: Table reproduced from Morningstar Data Analysis Premium (2018)
In case of Qantas the EPS ratio is much higher except the year 2014 which was -
128.53, other than that the EPS ratio in case of Virgin Australia Holding run in negative.
When it comes to the price earning was more in case of Quantas and is constant but in case of
virgin Australia it ran in negative and rose drastically from the year 2015 and then remained
positive. Both the company had a zero dividend yield and dividend payout until 2015 when in
case of Quantas it rose and remained positive.
Working capital Management
The working capital represents the surety that the firm is able to continue its
operations and has enough funds to meet its long term and short term obligations (Agha
2014). According to the annual report of the two Airline companies Qantas Airways Ltd and
Virgin Australia Holdings Ltd have a substantial performance in the management of the
Document Page
3RATIO ANALYSIS
capital. The working capital management involves management of the inventories, accounts
receivables, payables and cash.
In order to evaluate the working capital of the company there are three significant
ratio that are to be calculated that are as follows:
1) Day’s inventory: The Days inventory ratio helps in finding out the amount the
company has earned per day in terms of sales (Aktas, Croci and Petmezas 2015). This helps
in the analysis of the rate at which the assets has been turned over.
2) Days payable: The days payable ratio helps in finding out the number of days that is
needed to pay off the company’s left over accounts payables (John Wiley & Sons 2016).
. In the given case it would help to analyze the two companies companies Qantas
Airways Ltd and Virgin Australia Holdings Ltd number of days to pay off its debts.
3) Days receivables: As the name suggests the day’s payable is just similar to the
Days payable ratio, it helps to observe the number of days it takes for the customers to pay
back their accounts to the company.
Working capital management ratios for Qantas Airways Ltd for the year 2013-2017
Quantas 2017 2016 2015 2014 2013
Days Inventory 8.17 7.77 7.57 7.63 8.53
Days Payable 48.12 45.93 44.2 44.58 43.56
Days
Receivables 15.46 15.17 16.68 17.73 21.04
Source: Table reproduced from Morningstar (2018).
tabler-icon-diamond-filled.svg

Secure Best Marks with AI Grader

Need help grading? Try our AI Grader for instant feedback on your assignments.
Document Page
4RATIO ANALYSIS
Working capital management ratios for Virgin Australia Holdings Ltd for the year
2013-2017
Virgin
Australia 2017 2016 2015 2014 2013
Days Inventory 3.35 3.1 3.19 3.66 3.14
Days Payable 49.23 51.9 54.41 62.84 61.21
Days
Receivables 12.35 12.53 13.43 16.03 15.95
Source: Table reproduced from Morningstar (2018).
From the above analysis of the three ratios of the two companies Qantas Airways Ltd
and Virgin Australia Holdings Ltd it can be said that virgin ltd is performing better in terms
of day’s receivables and days payables. However Quantas has a higher days inventories as
compared to Virgin ltd. In consideration of the overall performance it can be said both are
managing the working capital equally well.
Document Page
5RATIO ANALYSIS
References
Agha, Hina. "Impact of working capital management on profitability." European Scientific
Journal, ESJ 10, no. 1 (2014).
Aktas, Nihat, Ettore Croci, and Dimitris Petmezas. "Is working capital management value-
enhancing? Evidence from firm performance and investments." Journal of Corporate
Finance30 (2015): 98-113.
ANTREAS, D. "Ratio and Frontier Analysis for Assessing Corporate Performance: Evidence
from the Grocery Industry in the UK." Decision Science 44 (2017): 177.
Grant, Robert M. Contemporary strategy analysis: Text and cases edition. John Wiley &
Sons, 2016.
chevron_up_icon
1 out of 6
circle_padding
hide_on_mobile
zoom_out_icon
logo.png

Your All-in-One AI-Powered Toolkit for Academic Success.

Available 24*7 on WhatsApp / Email

[object Object]