Interpreting Market Trends and Developments for Marks & Spencer
VerifiedAdded on 2021/02/18
|21
|3883
|22
Report
AI Summary
This report provides an interpretation of market trends and developments, focusing on Marks & Spencer. It begins with an introduction to market trend analysis and its importance in understanding customer needs and competitor strategies. The main body of the report includes quantitative analysis of consumer expenditure and retail sales data, utilizing tables, correlation analysis, and trend analysis to interpret market dynamics. Furthermore, it explores the marketing strategies of Marks & Spencer, including segmentation, targeting, and positioning. The report also includes a SWOT and PEST analysis to provide an overview of the internal and external factors affecting the company. The report concludes with a comparative analysis of Marks & Spencer and Next plc, highlighting their sales and profitability trends. This report helps in final market analysis.
Interpret market trends and
developments
developments
Paraphrase This Document
Need a fresh take? Get an instant paraphrase of this document with our AI Paraphraser
Table of Contents
INTRODUCTION...........................................................................................................................3
MAIN BODY...................................................................................................................................3
CONCLUSION................................................................................................................................3
REFERENCES................................................................................................................................1
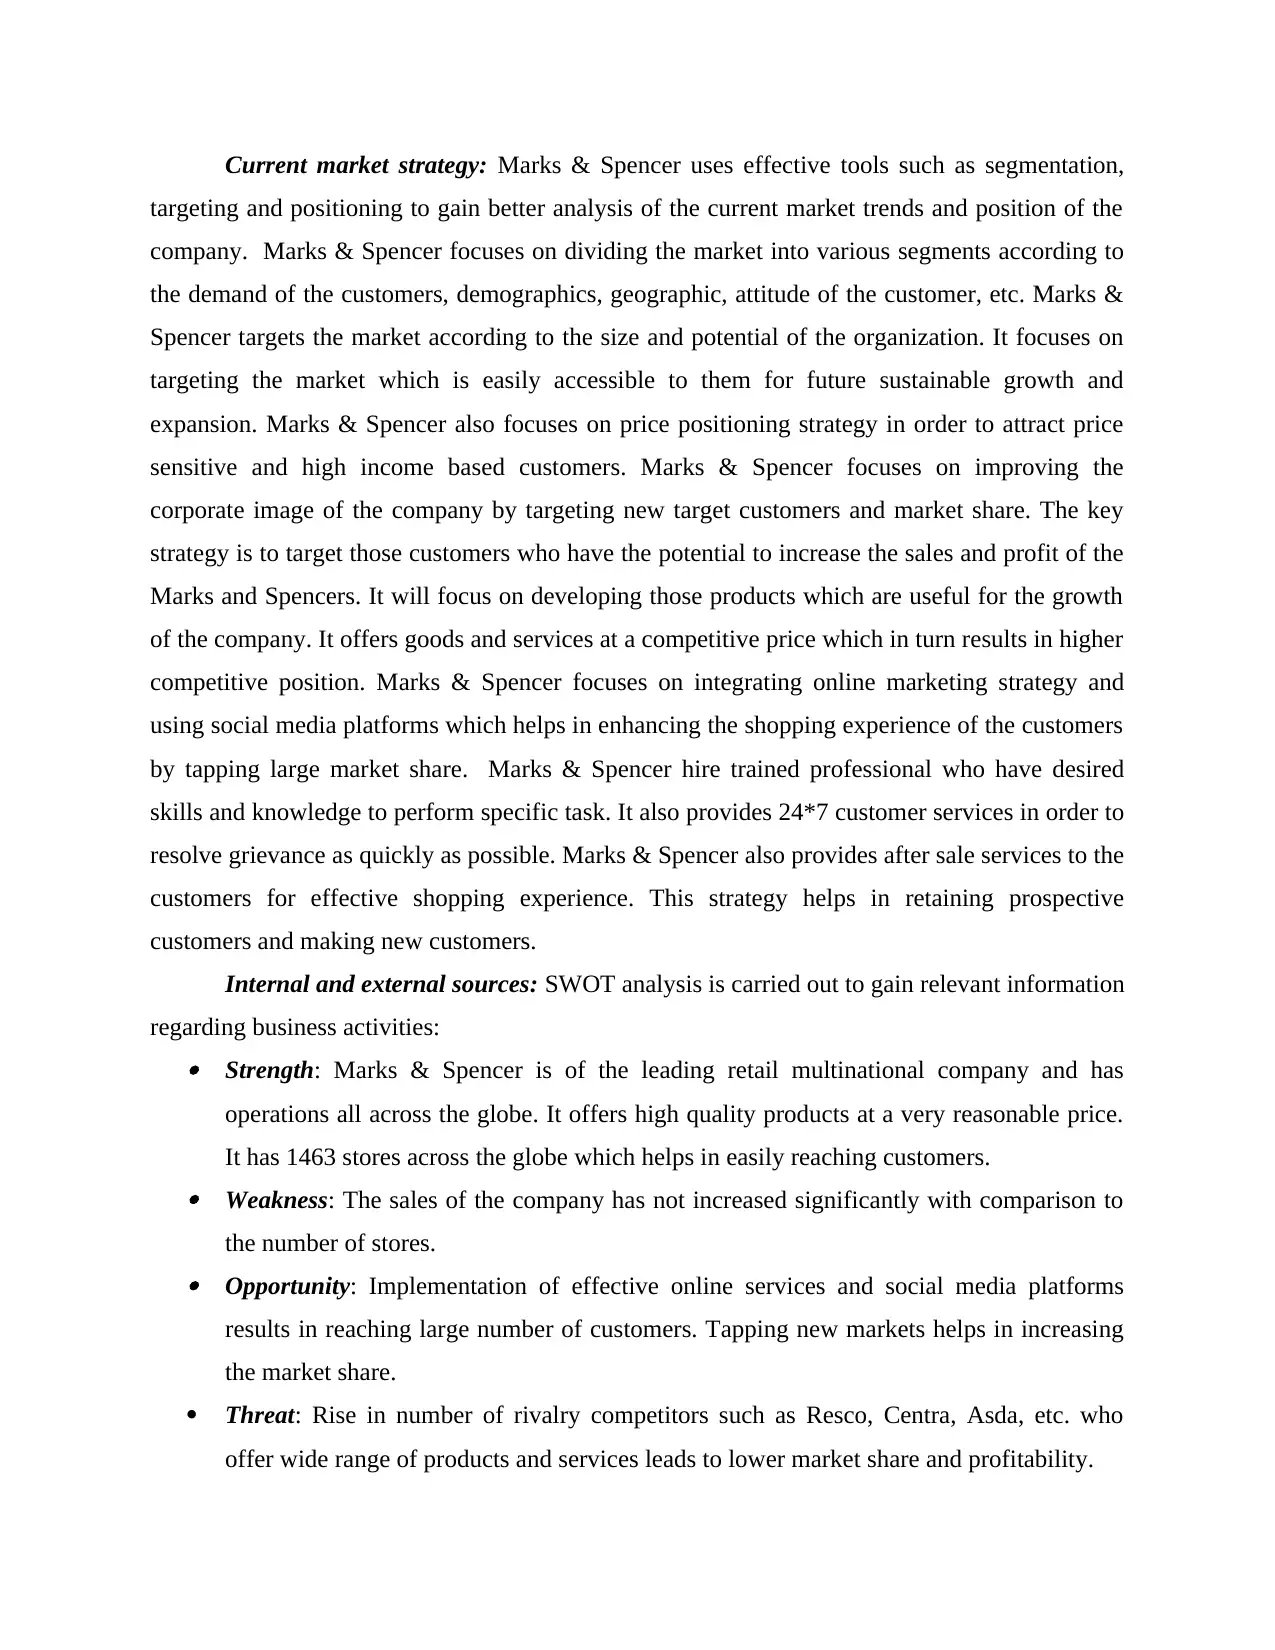
INTRODUCTION
Interpretation of market trend helps in effectively understanding the needs of the
customers. Analysing market trend is useful in determining the changing market trends of the
competitors for higher expansion and growth. Market development is an effective growth
strategy which helps in identifying and developing new market segments for the particular
products and services. This strategy helps in targeting those customers who are not buying
specific products and services which in turn results in long term sustainable growth.
Marks & Spencer is a multinational British retail company founded in the year 1884 by
Michael Marks and Thomas Spencer. Company is headquartered in Westminster, London. It
offers wide range of products and services across the globe.
This study will highlight and interpret market trends and development for a specific
business. Quantitative analysis will be carried out in order to interpret the comparative market
data. Furthermore, this study carries out qualitative analysis in order to demonstrate the success
of marketing activities. Lastly, this report helps in final market analysis.
MAIN BODY
Project 1
Marks & Spencer is a multinational British retail company founded in the year 1884 by
Michael Marks and Thomas Spencer. Company is headquartered in Westminster, London.
Marks & Spencer has approximately 959 stores in the UK and around 1463 stores in 57 countries
across the globe. It has revenue of £10,377 million in the year 2019.
Products and services: Marks and Spencer offers wide range of products and services
across the globe. It offers wide range of quality products and services for men, women and kids.
It deals in various products and services such as clothes, shoes, cosmetics, perfumes, toiletries,
kitchen equipments, food and drinks, luxury goods, furnishing, bedding, gifts, online services,
energy, banking services, technology, audio and visual equipment, etc.
Current market situation: Marks & Spencer is performing exceptionally well across the
globe by expanding and growing business in national and international markets. It offers crucial
marketing strategies by effectively maintaining sustainable and ethical business. Expansion of
business by tapping new customers and market helps in future growth of the company by
maintaining effective market position better than its competitors.
⊘ This is a preview!⊘
Do you want full access?
Subscribe today to unlock all pages.
Trusted by 1+ million students worldwide
Current market strategy: Marks & Spencer uses effective tools such as segmentation,
targeting and positioning to gain better analysis of the current market trends and position of the
company. Marks & Spencer focuses on dividing the market into various segments according to
the demand of the customers, demographics, geographic, attitude of the customer, etc. Marks &
Spencer targets the market according to the size and potential of the organization. It focuses on
targeting the market which is easily accessible to them for future sustainable growth and
expansion. Marks & Spencer also focuses on price positioning strategy in order to attract price
sensitive and high income based customers. Marks & Spencer focuses on improving the
corporate image of the company by targeting new target customers and market share. The key
strategy is to target those customers who have the potential to increase the sales and profit of the
Marks and Spencers. It will focus on developing those products which are useful for the growth
of the company. It offers goods and services at a competitive price which in turn results in higher
competitive position. Marks & Spencer focuses on integrating online marketing strategy and
using social media platforms which helps in enhancing the shopping experience of the customers
by tapping large market share. Marks & Spencer hire trained professional who have desired
skills and knowledge to perform specific task. It also provides 24*7 customer services in order to
resolve grievance as quickly as possible. Marks & Spencer also provides after sale services to the
customers for effective shopping experience. This strategy helps in retaining prospective
customers and making new customers.
Internal and external sources: SWOT analysis is carried out to gain relevant information
regarding business activities: Strength: Marks & Spencer is of the leading retail multinational company and has
operations all across the globe. It offers high quality products at a very reasonable price.
It has 1463 stores across the globe which helps in easily reaching customers. Weakness: The sales of the company has not increased significantly with comparison to
the number of stores. Opportunity: Implementation of effective online services and social media platforms
results in reaching large number of customers. Tapping new markets helps in increasing
the market share.
Threat: Rise in number of rivalry competitors such as Resco, Centra, Asda, etc. who
offer wide range of products and services leads to lower market share and profitability.
Paraphrase This Document
Need a fresh take? Get an instant paraphrase of this document with our AI Paraphraser
PEST analysis is carried out to gain relevant information regarding business activities: Political: Government legislations, free trade policies, political instability, tax policy,
import and export, etc. results in various trade restrictions. There was a negative impact
of Brexit on the sales of the company. Economic: Factors like economic crisis, high inflation rate results on lower sales and
profit for Marks & Spencer. Exchange rate, interest rate, disposable income,
unemployment rate, etc. influences the performance and business activities of the
company. Social: Consumer attitude and preference has been changing frequently. Marks &
Spencer needs to constantly reform the business activities in order to sustain in the
market. Technological: Technology has been changing at faster pace which results in higher cost
to the company. Integration of advanced technology helps in easy access to the products
24*7 in order to enhance shopping experience.
Legislations, code of practice and regulations: Marks & Spencer needs to company with
various laws such as employment saw, health and safety safety law, discrimination law, rules and
regulations of the company within which the company is operating, etc. for smooth functioning
of business.
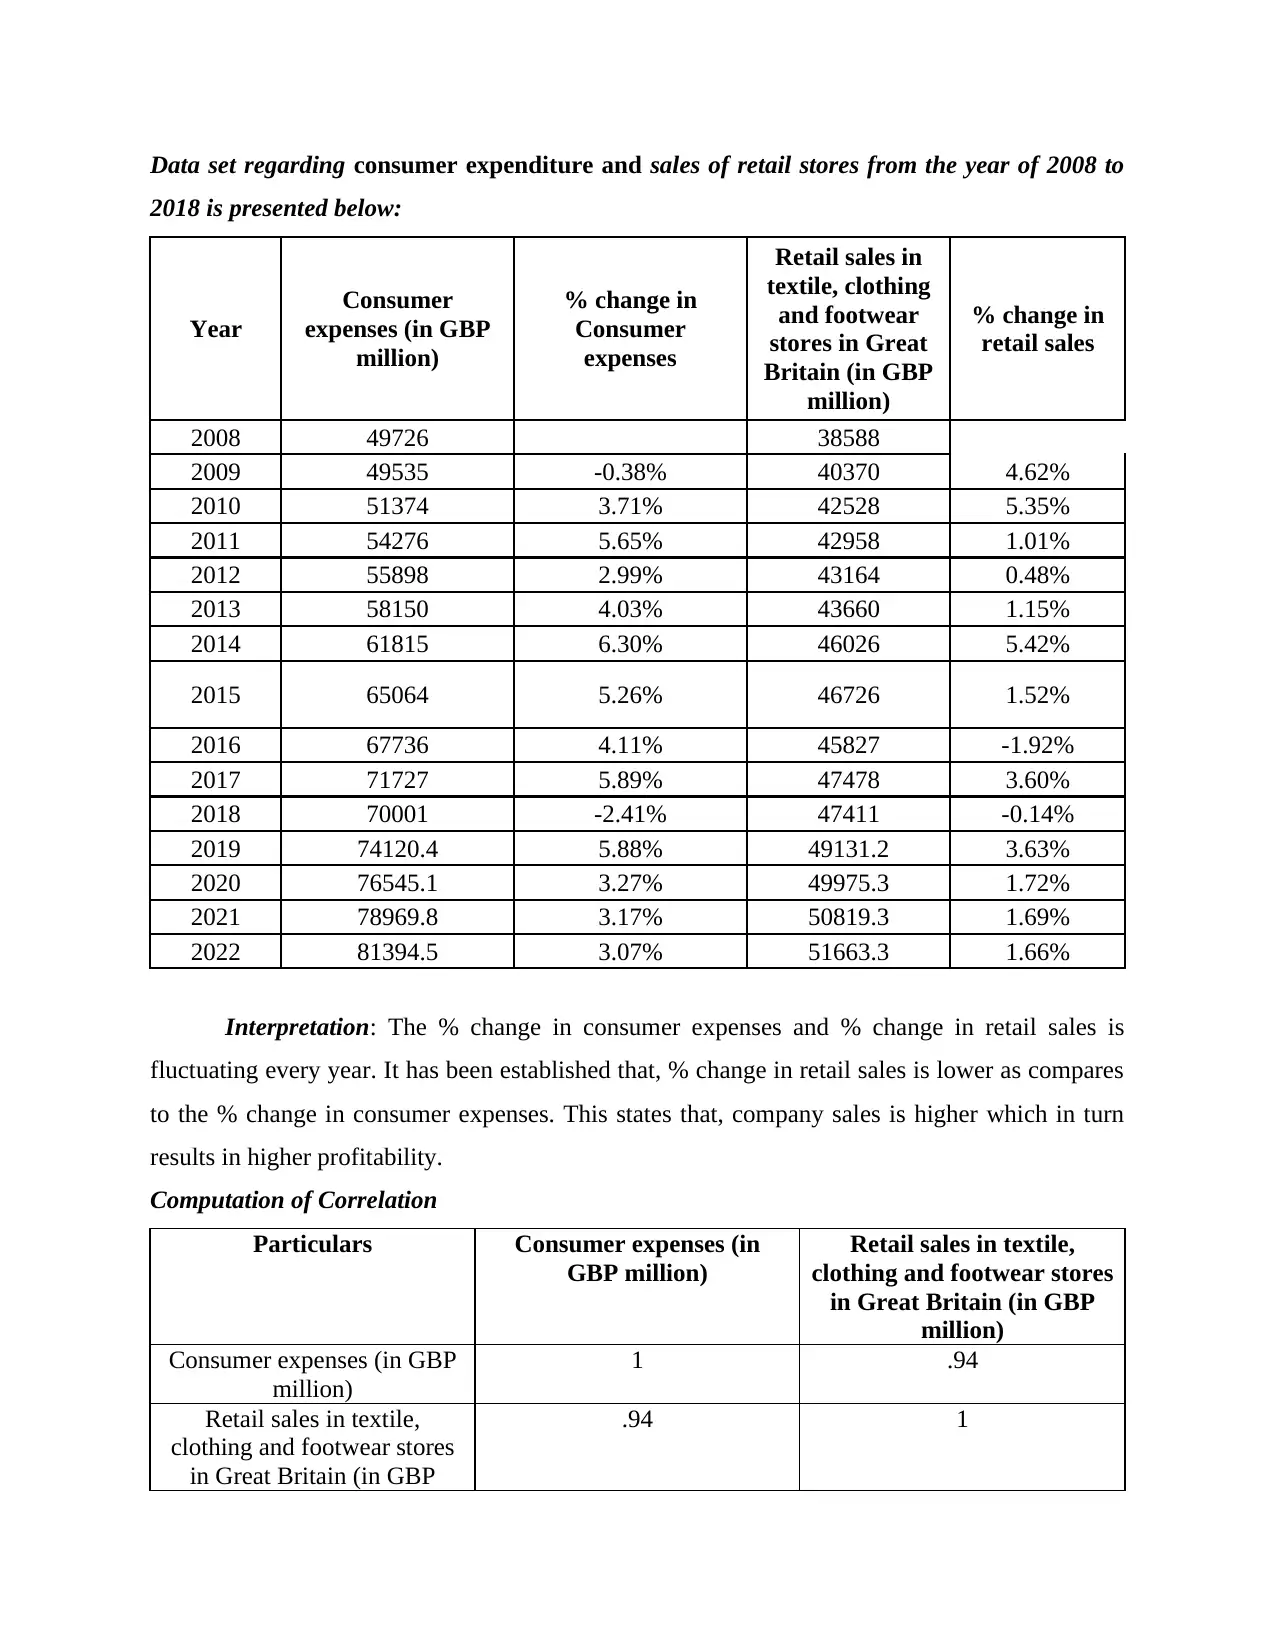
Data set regarding consumer expenditure and sales of retail stores from the year of 2008 to
2018 is presented below:
Year
Consumer
expenses (in GBP
million)
% change in
Consumer
expenses
Retail sales in
textile, clothing
and footwear
stores in Great
Britain (in GBP
million)
% change in
retail sales
2008 49726 38588
2009 49535 -0.38% 40370 4.62%
2010 51374 3.71% 42528 5.35%
2011 54276 5.65% 42958 1.01%
2012 55898 2.99% 43164 0.48%
2013 58150 4.03% 43660 1.15%
2014 61815 6.30% 46026 5.42%
2015 65064 5.26% 46726 1.52%
2016 67736 4.11% 45827 -1.92%
2017 71727 5.89% 47478 3.60%
2018 70001 -2.41% 47411 -0.14%
2019 74120.4 5.88% 49131.2 3.63%
2020 76545.1 3.27% 49975.3 1.72%
2021 78969.8 3.17% 50819.3 1.69%
2022 81394.5 3.07% 51663.3 1.66%
Interpretation: The % change in consumer expenses and % change in retail sales is
fluctuating every year. It has been established that, % change in retail sales is lower as compares
to the % change in consumer expenses. This states that, company sales is higher which in turn
results in higher profitability.
Computation of Correlation
Particulars Consumer expenses (in
GBP million)
Retail sales in textile,
clothing and footwear stores
in Great Britain (in GBP
million)
Consumer expenses (in GBP
million)
1 .94
Retail sales in textile,
clothing and footwear stores
in Great Britain (in GBP
.94 1
⊘ This is a preview!⊘
Do you want full access?
Subscribe today to unlock all pages.
Trusted by 1+ million students worldwide
million)
Interpretation: Correlation helps in showing mutual relationship between two or more
factors. A positive relationship states that two factors increases or decreases in a parallel way. On
the contrary, negative correlation states extend to which one variable falls with the increase in
another variable. Above facts states that, consumer expenses and retail sales are highly correlated
which means one variable increases the other also increases and vice versa.
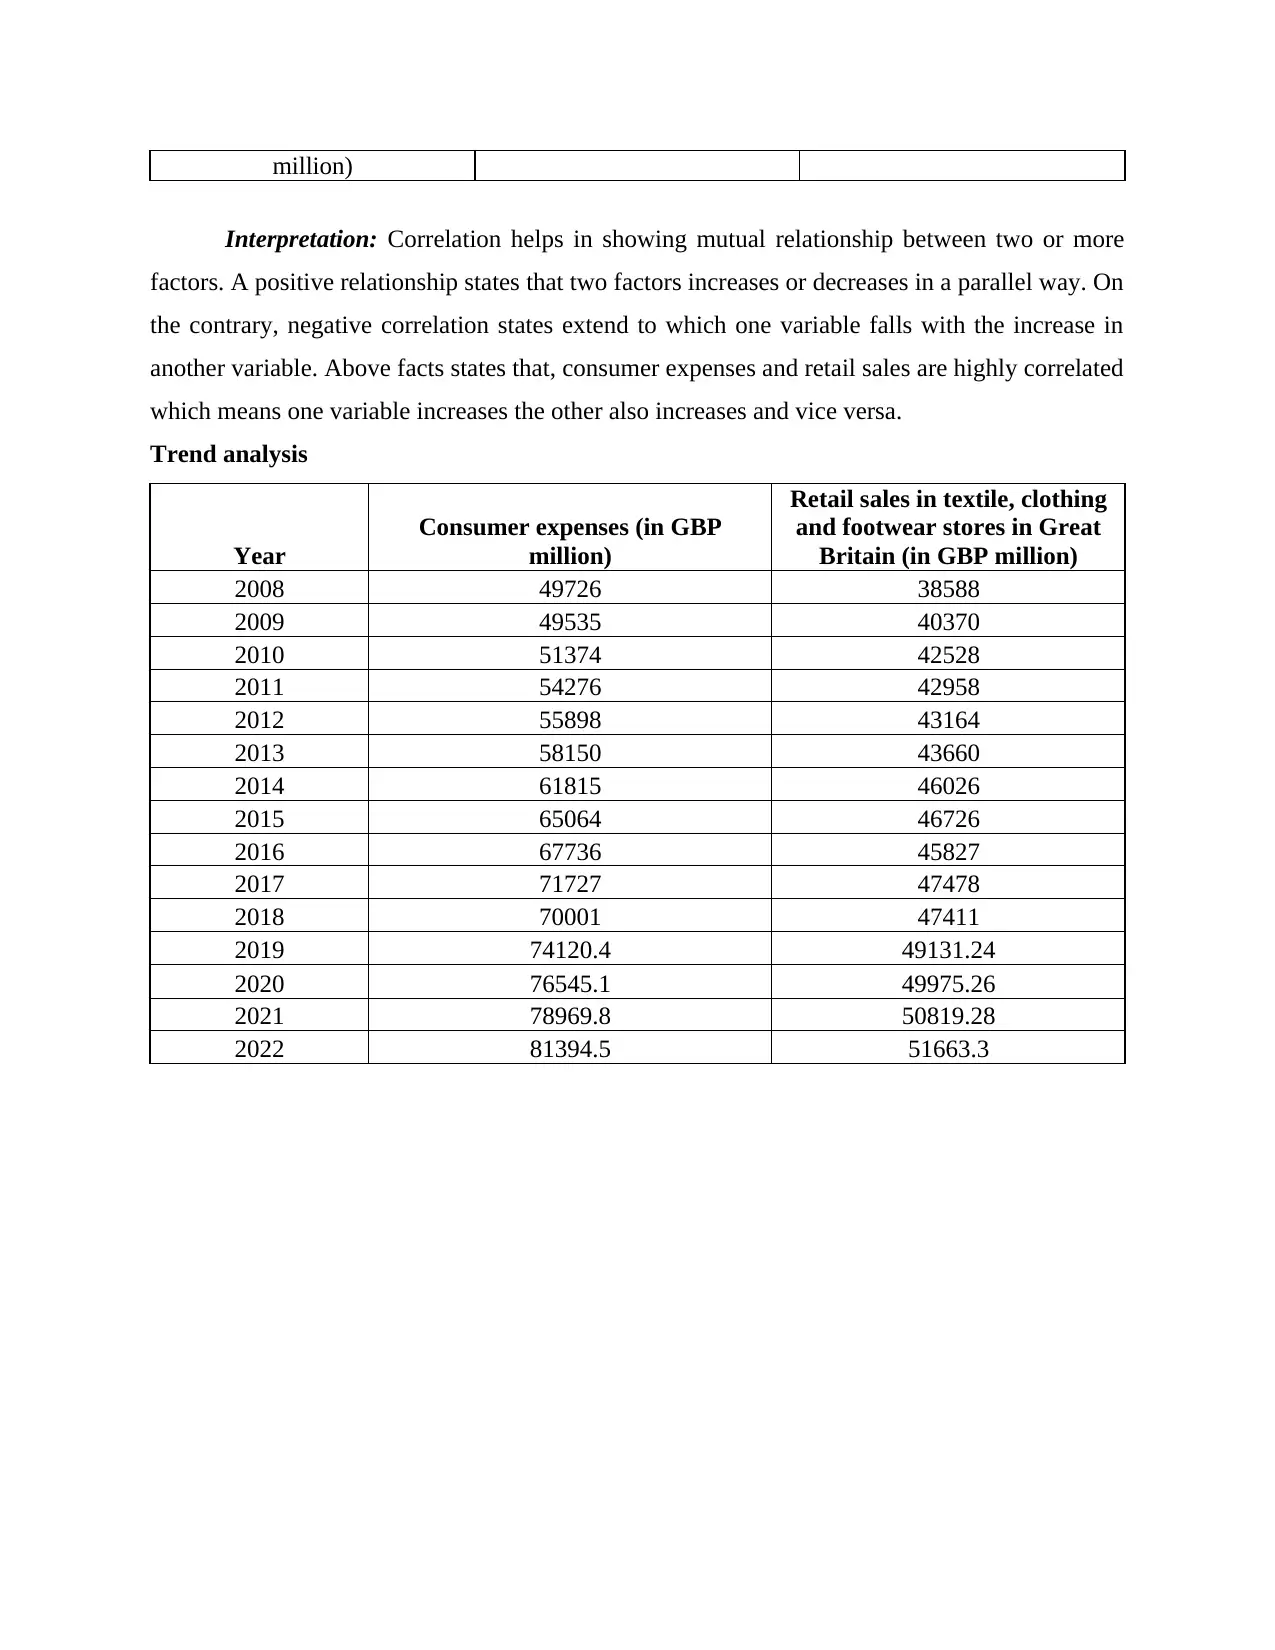
Trend analysis
Year
Consumer expenses (in GBP
million)
Retail sales in textile, clothing
and footwear stores in Great
Britain (in GBP million)
2008 49726 38588
2009 49535 40370
2010 51374 42528
2011 54276 42958
2012 55898 43164
2013 58150 43660
2014 61815 46026
2015 65064 46726
2016 67736 45827
2017 71727 47478
2018 70001 47411
2019 74120.4 49131.24
2020 76545.1 49975.26
2021 78969.8 50819.28
2022 81394.5 51663.3
Interpretation: Correlation helps in showing mutual relationship between two or more
factors. A positive relationship states that two factors increases or decreases in a parallel way. On
the contrary, negative correlation states extend to which one variable falls with the increase in
another variable. Above facts states that, consumer expenses and retail sales are highly correlated
which means one variable increases the other also increases and vice versa.
Trend analysis
Year
Consumer expenses (in GBP
million)
Retail sales in textile, clothing
and footwear stores in Great
Britain (in GBP million)
2008 49726 38588
2009 49535 40370
2010 51374 42528
2011 54276 42958
2012 55898 43164
2013 58150 43660
2014 61815 46026
2015 65064 46726
2016 67736 45827
2017 71727 47478
2018 70001 47411
2019 74120.4 49131.24
2020 76545.1 49975.26
2021 78969.8 50819.28
2022 81394.5 51663.3
Paraphrase This Document
Need a fresh take? Get an instant paraphrase of this document with our AI Paraphraser
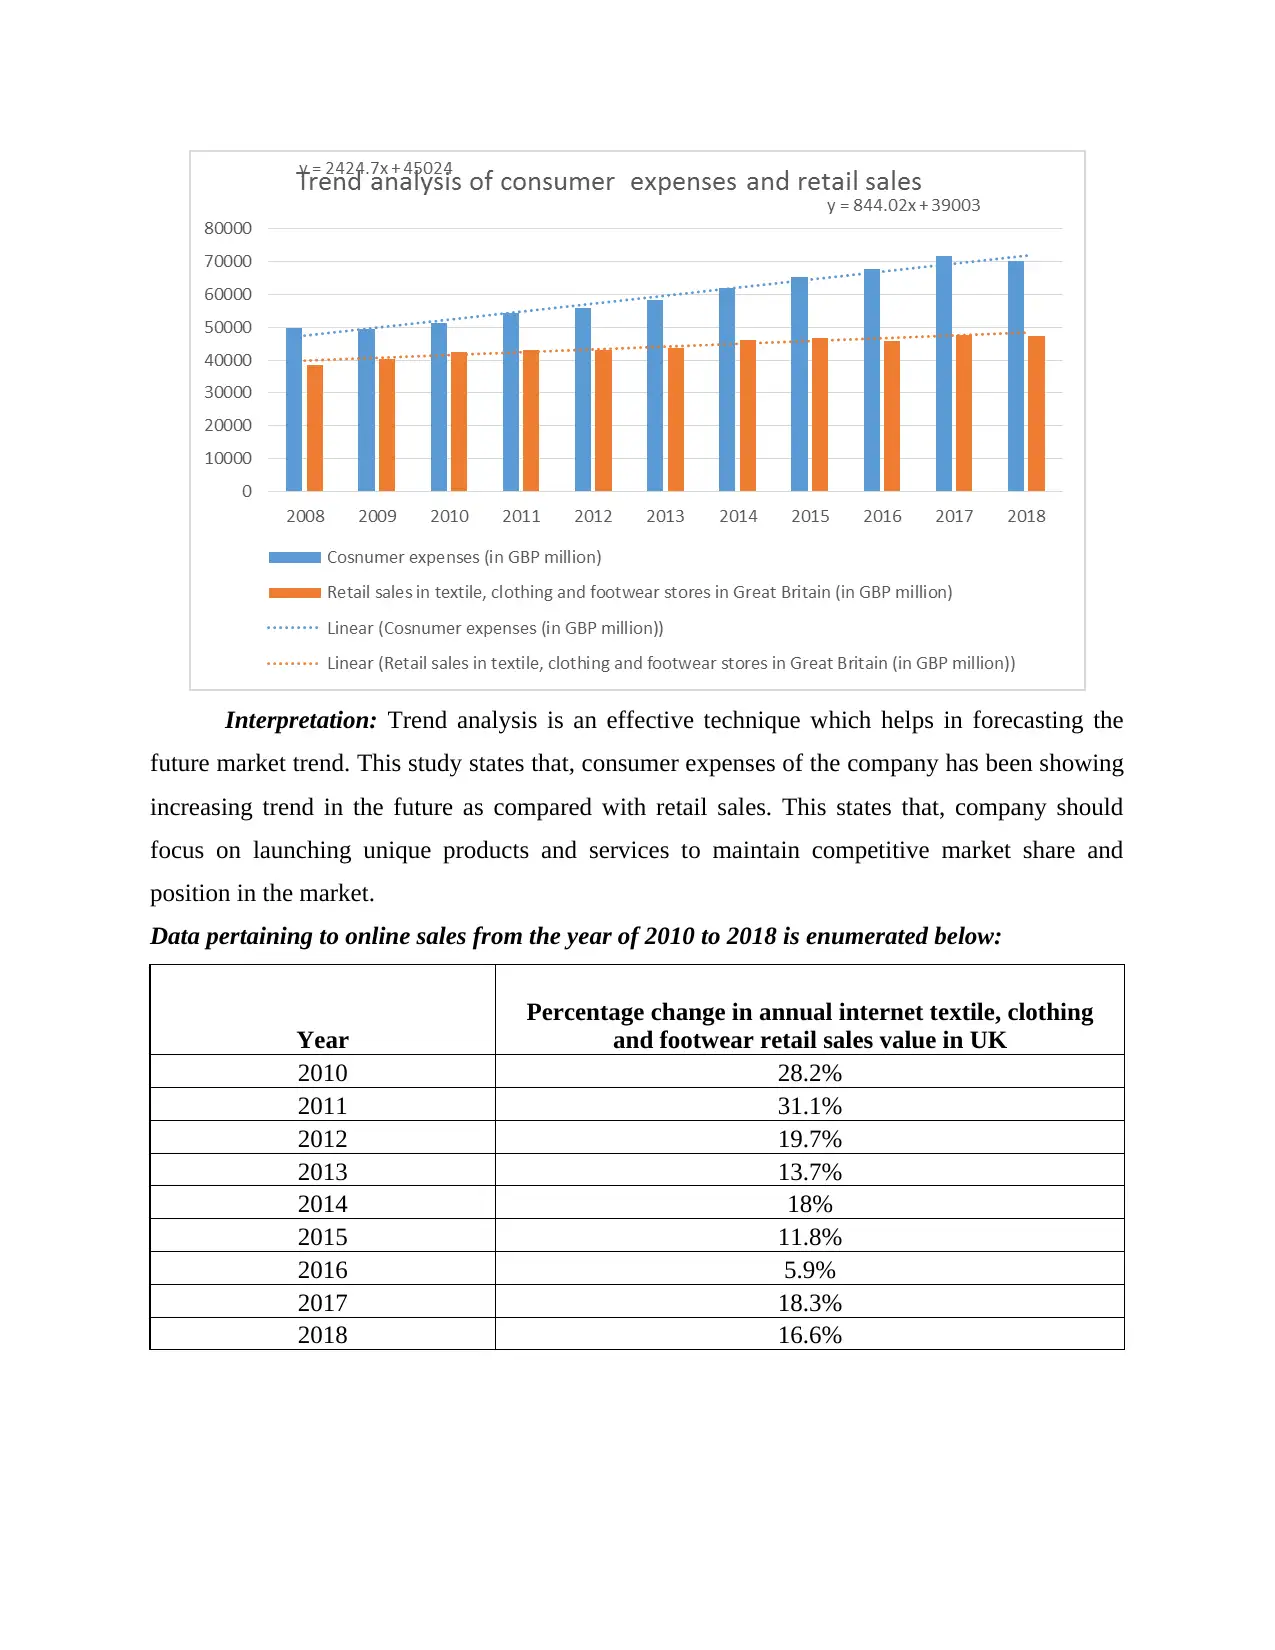
Interpretation: Trend analysis is an effective technique which helps in forecasting the
future market trend. This study states that, consumer expenses of the company has been showing
increasing trend in the future as compared with retail sales. This states that, company should
focus on launching unique products and services to maintain competitive market share and
position in the market.
Data pertaining to online sales from the year of 2010 to 2018 is enumerated below:
Year
Percentage change in annual internet textile, clothing
and footwear retail sales value in UK
2010 28.2%
2011 31.1%
2012 19.7%
2013 13.7%
2014 18%
2015 11.8%
2016 5.9%
2017 18.3%
2018 16.6%
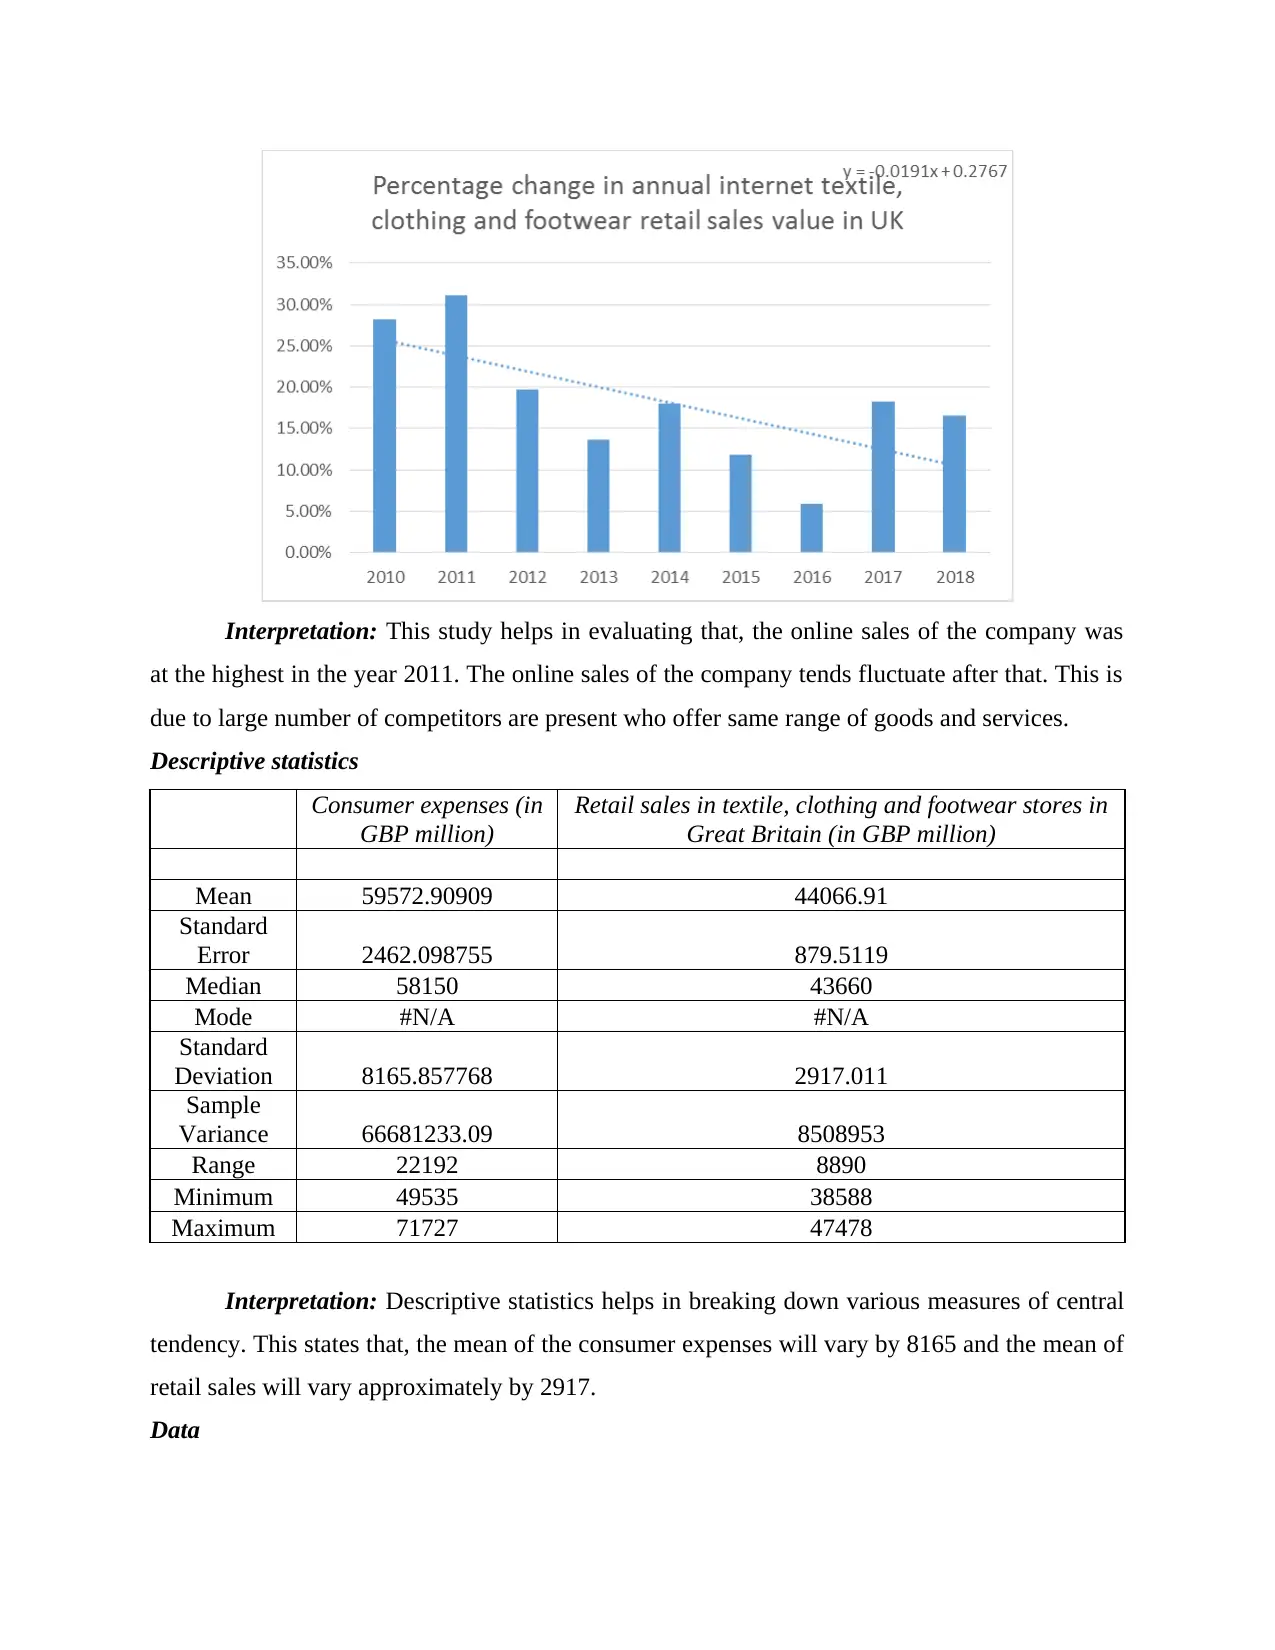
Interpretation: This study helps in evaluating that, the online sales of the company was
at the highest in the year 2011. The online sales of the company tends fluctuate after that. This is
due to large number of competitors are present who offer same range of goods and services.
Descriptive statistics
Consumer expenses (in
GBP million)
Retail sales in textile, clothing and footwear stores in
Great Britain (in GBP million)
Mean 59572.90909 44066.91
Standard
Error 2462.098755 879.5119
Median 58150 43660
Mode #N/A #N/A
Standard
Deviation 8165.857768 2917.011
Sample
Variance 66681233.09 8508953
Range 22192 8890
Minimum 49535 38588
Maximum 71727 47478
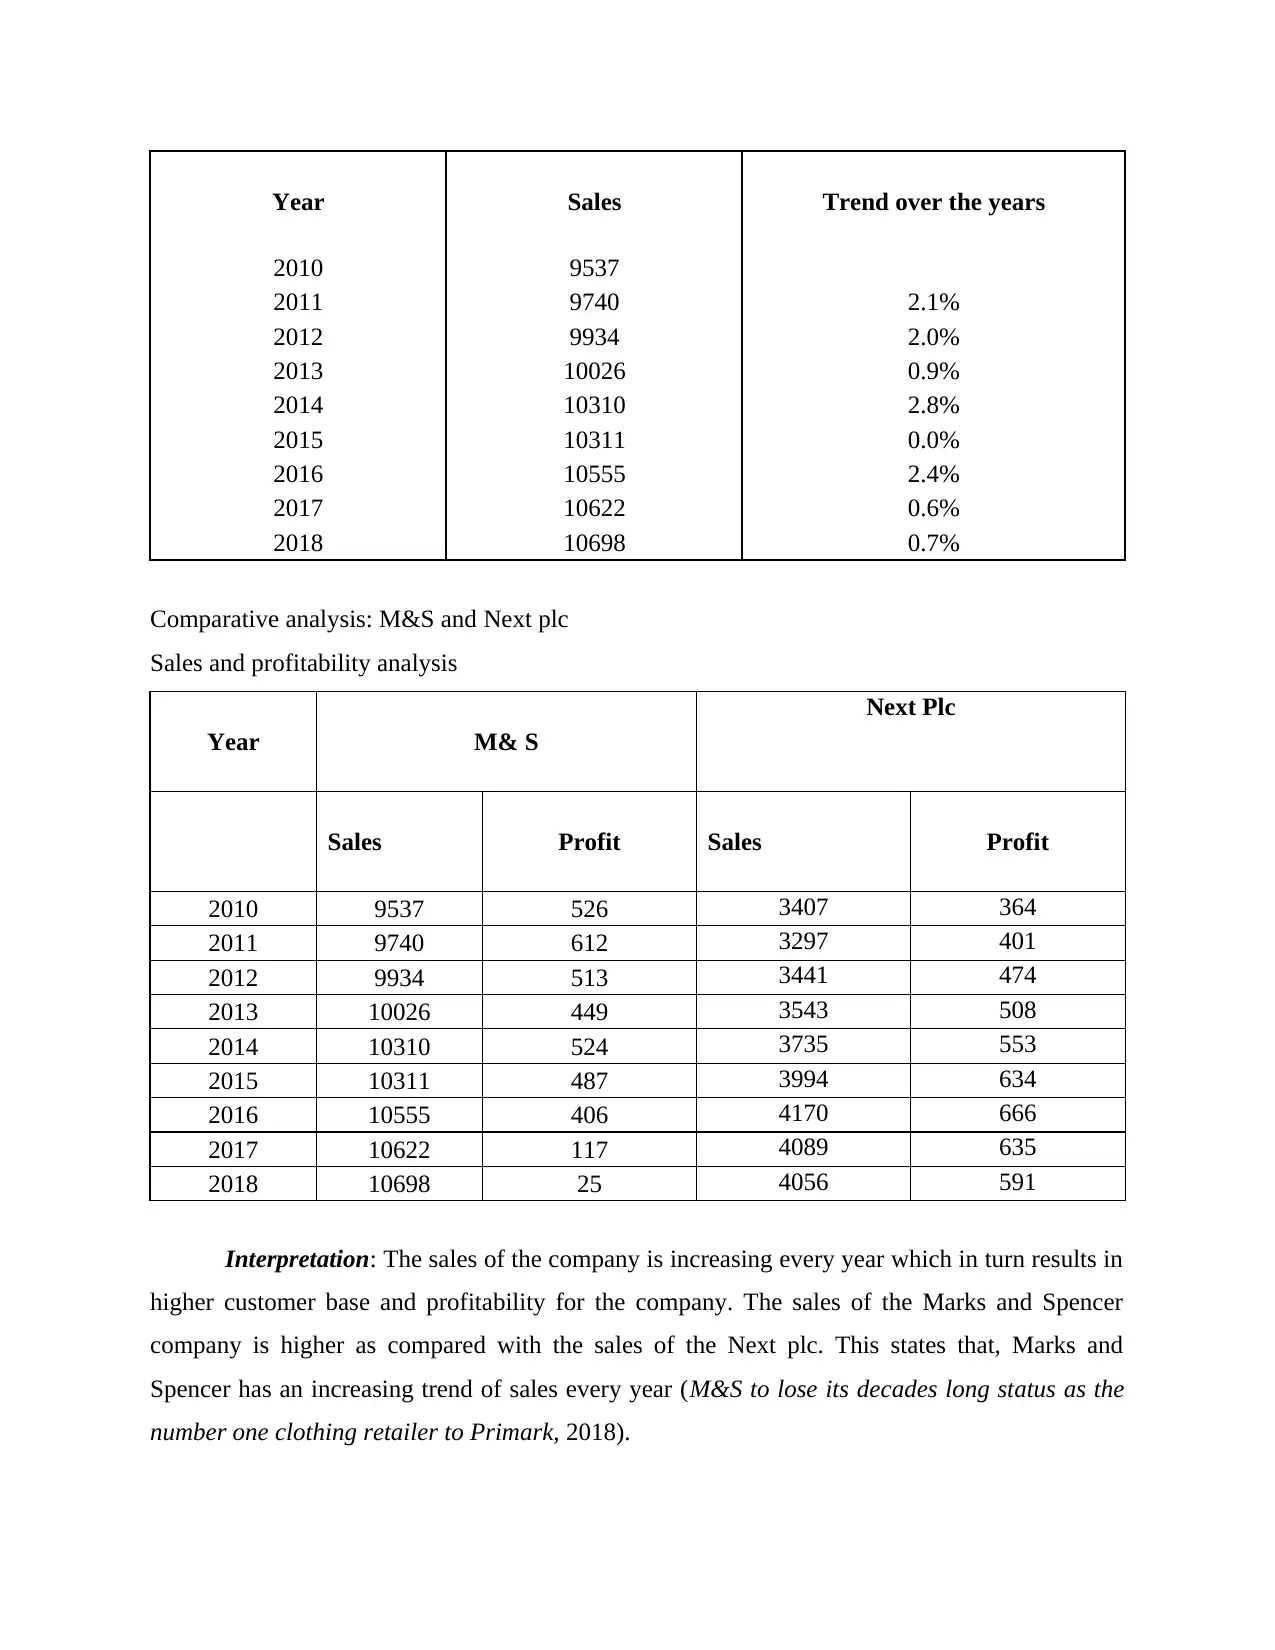
Interpretation: Descriptive statistics helps in breaking down various measures of central
tendency. This states that, the mean of the consumer expenses will vary by 8165 and the mean of
retail sales will vary approximately by 2917.
Data
at the highest in the year 2011. The online sales of the company tends fluctuate after that. This is
due to large number of competitors are present who offer same range of goods and services.
Descriptive statistics
Consumer expenses (in
GBP million)
Retail sales in textile, clothing and footwear stores in
Great Britain (in GBP million)
Mean 59572.90909 44066.91
Standard
Error 2462.098755 879.5119
Median 58150 43660
Mode #N/A #N/A
Standard
Deviation 8165.857768 2917.011
Sample
Variance 66681233.09 8508953
Range 22192 8890
Minimum 49535 38588
Maximum 71727 47478
Interpretation: Descriptive statistics helps in breaking down various measures of central
tendency. This states that, the mean of the consumer expenses will vary by 8165 and the mean of
retail sales will vary approximately by 2917.
Data
⊘ This is a preview!⊘
Do you want full access?
Subscribe today to unlock all pages.
Trusted by 1+ million students worldwide
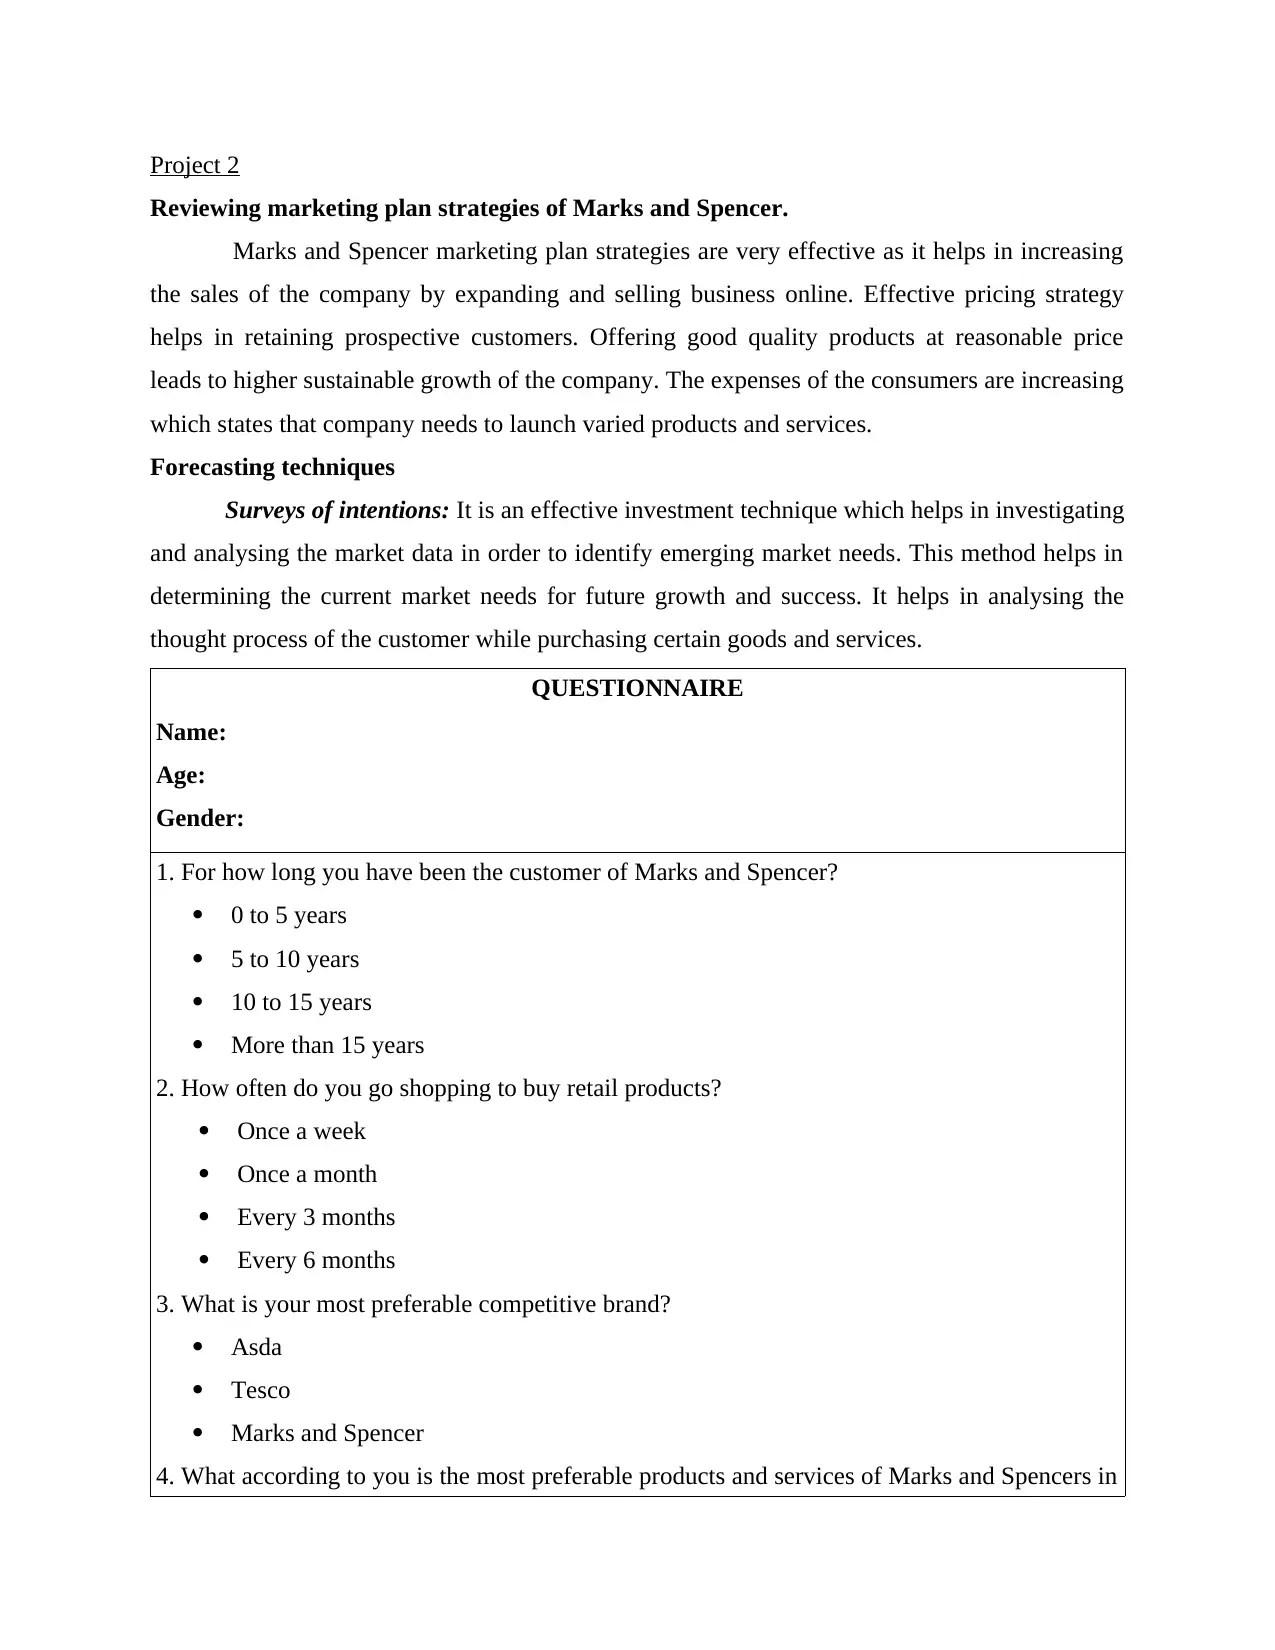
Year Sales Trend over the years
2010 9537
2011 9740 2.1%
2012 9934 2.0%
2013 10026 0.9%
2014 10310 2.8%
2015 10311 0.0%
2016 10555 2.4%
2017 10622 0.6%
2018 10698 0.7%
Comparative analysis: M&S and Next plc
Sales and profitability analysis
Year M& S
Next Plc
Sales Profit Sales Profit
2010 9537 526 3407 364
2011 9740 612 3297 401
2012 9934 513 3441 474
2013 10026 449 3543 508
2014 10310 524 3735 553
2015 10311 487 3994 634
2016 10555 406 4170 666
2017 10622 117 4089 635
2018 10698 25 4056 591
Interpretation: The sales of the company is increasing every year which in turn results in
higher customer base and profitability for the company. The sales of the Marks and Spencer
company is higher as compared with the sales of the Next plc. This states that, Marks and
Spencer has an increasing trend of sales every year (M&S to lose its decades long status as the
number one clothing retailer to Primark, 2018).
Paraphrase This Document
Need a fresh take? Get an instant paraphrase of this document with our AI Paraphraser
Project 2
Reviewing marketing plan strategies of Marks and Spencer.
Marks and Spencer marketing plan strategies are very effective as it helps in increasing
the sales of the company by expanding and selling business online. Effective pricing strategy
helps in retaining prospective customers. Offering good quality products at reasonable price
leads to higher sustainable growth of the company. The expenses of the consumers are increasing
which states that company needs to launch varied products and services.
Forecasting techniques
Surveys of intentions: It is an effective investment technique which helps in investigating
and analysing the market data in order to identify emerging market needs. This method helps in
determining the current market needs for future growth and success. It helps in analysing the
thought process of the customer while purchasing certain goods and services.
QUESTIONNAIRE
Name:
Age:
Gender:
1. For how long you have been the customer of Marks and Spencer?
0 to 5 years
5 to 10 years
10 to 15 years
More than 15 years
2. How often do you go shopping to buy retail products?
Once a week
Once a month
Every 3 months
Every 6 months
3. What is your most preferable competitive brand?
Asda
Tesco
Marks and Spencer
4. What according to you is the most preferable products and services of Marks and Spencers in
order to meet customer need?
Clothes
Footwear
Home appliances
Cosmetics
5. What according to you is the most preferable shopping experience?
Online shopping
Physical stores
6. What according to you is the most preferred need of the customers?
Fair price
Good quality of product
After sale services
7. How much do you like to spend on particular products and services?
$100 to $250
$250 to $500
$500 to $750
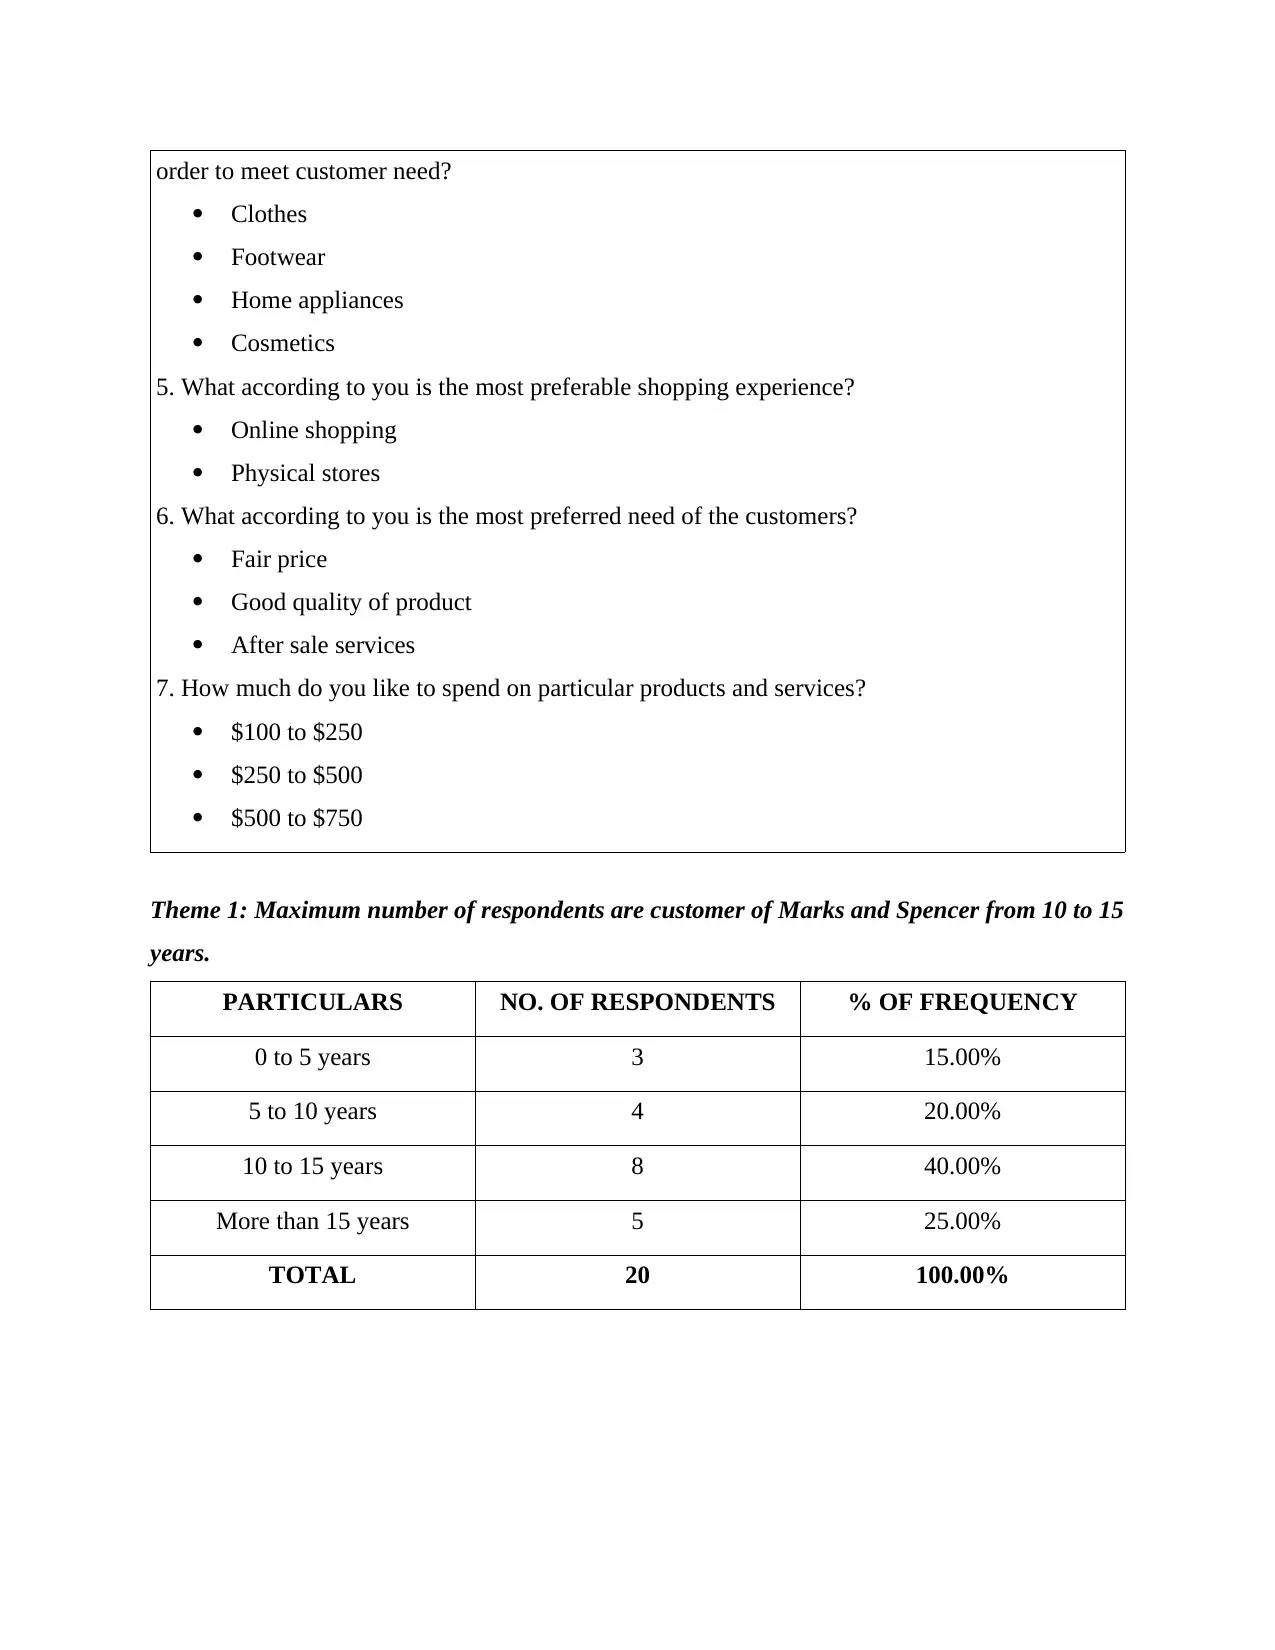
Theme 1: Maximum number of respondents are customer of Marks and Spencer from 10 to 15
years.
PARTICULARS NO. OF RESPONDENTS % OF FREQUENCY
0 to 5 years 3 15.00%
5 to 10 years 4 20.00%
10 to 15 years 8 40.00%
More than 15 years 5 25.00%
TOTAL 20 100.00%
Clothes
Footwear
Home appliances
Cosmetics
5. What according to you is the most preferable shopping experience?
Online shopping
Physical stores
6. What according to you is the most preferred need of the customers?
Fair price
Good quality of product
After sale services
7. How much do you like to spend on particular products and services?
$100 to $250
$250 to $500
$500 to $750
Theme 1: Maximum number of respondents are customer of Marks and Spencer from 10 to 15
years.
PARTICULARS NO. OF RESPONDENTS % OF FREQUENCY
0 to 5 years 3 15.00%
5 to 10 years 4 20.00%
10 to 15 years 8 40.00%
More than 15 years 5 25.00%
TOTAL 20 100.00%
⊘ This is a preview!⊘
Do you want full access?
Subscribe today to unlock all pages.
Trusted by 1+ million students worldwide
1 out of 21
Related Documents


Your All-in-One AI-Powered Toolkit for Academic Success.
+13062052269
info@desklib.com
Available 24*7 on WhatsApp / Email
![[object Object]](/_next/static/media/star-bottom.7253800d.svg)
Unlock your academic potential
Copyright © 2020–2026 A2Z Services. All Rights Reserved. Developed and managed by ZUCOL.