An In-Depth Report on Financial Market Efficiency and Risk Analysis
VerifiedAdded on 2022/01/17
|9
|3466
|60
Report
AI Summary
This report delves into the concept of market efficiency, differentiating between weak, semi-strong, and strong forms, and provides empirical evidence from China's stock market, analyzing its efficiency based on historical data and event studies. The report then explores the distinct roles and functions of capital and money markets, examining how money market activities influence asset prices in capital markets, supported by real-world examples. Finally, the report addresses financial risks, including transaction, translation, and economic risks, and discusses hedging strategies like forward contracts, providing examples of how companies manage these risks. The analysis provides a comprehensive overview of market dynamics and risk management in finance.
Question 1
Q.1.a. Distinguish between different levels of market efficiency. (300w)
EMH stipulates that securities are exactly priced and stocks will reflect all available
information in its price. The basic concept of levels of market efficiency was provided by
Fama (1971), showing that market efficiency could be divided into three levels ranging from
weak to strong form.
Firstly, the weak form argued that stock prices reflect all historical trading information in
terms of trading prices, volume or interest (Baiz et al,1999). Therefore, technical analysis
based on trading quantity and trading price movements is useless in this case since it cannot
predict the following trading prices. Whereas, fundamental analysis can be beneficial to
determine whether a stock is undervalued or overvalued. That’s simply because it is based on
the true operation of the firm. For instance, the Philippine exchange market is weak-form
efficient (Aquino, 2006).
Secondly, in the semi-strong form, stock prices reflect both historical trading information and
all published information (Demsetz, 1981). In this form, all investors receive all past and
current information simultaneously, and stock prices will reflect immediately the information.
Therefore, not only technical but also fundamental analysis cannot be applied. Nevertheless,
insider information about a public firm’s decisions that haven’t yet been released still can
work and earn some benefits. According to Vandana & Gupta (2003), and Mishra (2005),
Indian stock exchange market is efficient in its semi-strong form.
Thirdly, in the strong form, share prices fully and fairly reflect all information including
historical, publicly available information and insider information. Therefore, it’s impossible
to make benefits by researching any kinds of information. For example, the Warsaw stock
market (Poland) is confirmed to be a strong form efficiency (Potocki & Swist, 2012).
Q.1.b.
Literature review
Previous studies have been conducted to test the efficiency market in China’s stock market.
However, this market received several mixed opinions. Some researchers argued that China’s
stock market is efficient is its weak form, while others claimed the inefficiency of this
market. Besides, there are some arguments found that China’s stock market is near the semi-
strong form.
Worthington and Higgs (2006) have examined the market efficiency of fifteen Asian stock
market including China market. By using the serial correlation and runs tests, they confirmed
the weak-form of Chinese stock market. The study conducted by Chung (2006) has collected
closing stock prices for China stock exchanges in Shanghai and Shenzhen from 1992 to 2005.
The empirical result suggest that Chinese market is found to be a weak form. Otherwise, the
paper conducted by Liu (2011) has the same idea. This research investigates the growth of
China stock market from 2001 to 2008 through collecting daily and weekly index return
Paraphrase This Document
Need a fresh take? Get an instant paraphrase of this document with our AI Paraphraser
series. It shows that following trading prices cannot be predicted by historical data in Chinese
stock market.
Nevertheless, the research provided by Lefen and Haijun (2007) has an opposite view. They
choose the reform of the shareholder structure event to test the market efficiency in 1302
sample firms. The result find that the reform on China’s stock market did not get but close to
the semi-strong form. Furthermore, Zhong and Fan (2010) also confirmed the great
improvement of China stock market, near the semi-strong form efficiency.
Other researchers have shown different opinions that China’s stock market is inefficiency.
Particularly, Wen et al (1997) has confirmed this argument by using the Garch-M model to
evaluate the daily rate of return in Shanghai A share index (SHA) and Shenzhen A share
index (SZA) from 2001 to 2009. They conclude that Chinese stock market do not reach the
weak form efficiency. Furthermore, Ma (2000) has examined the weak and semi-strong form
of China’s stock market by testing the random walk of the stock prices through the runs test
and correlation coefficient test. The result found that China’s stock market is nether weak
form nor semi-strong form efficiency.
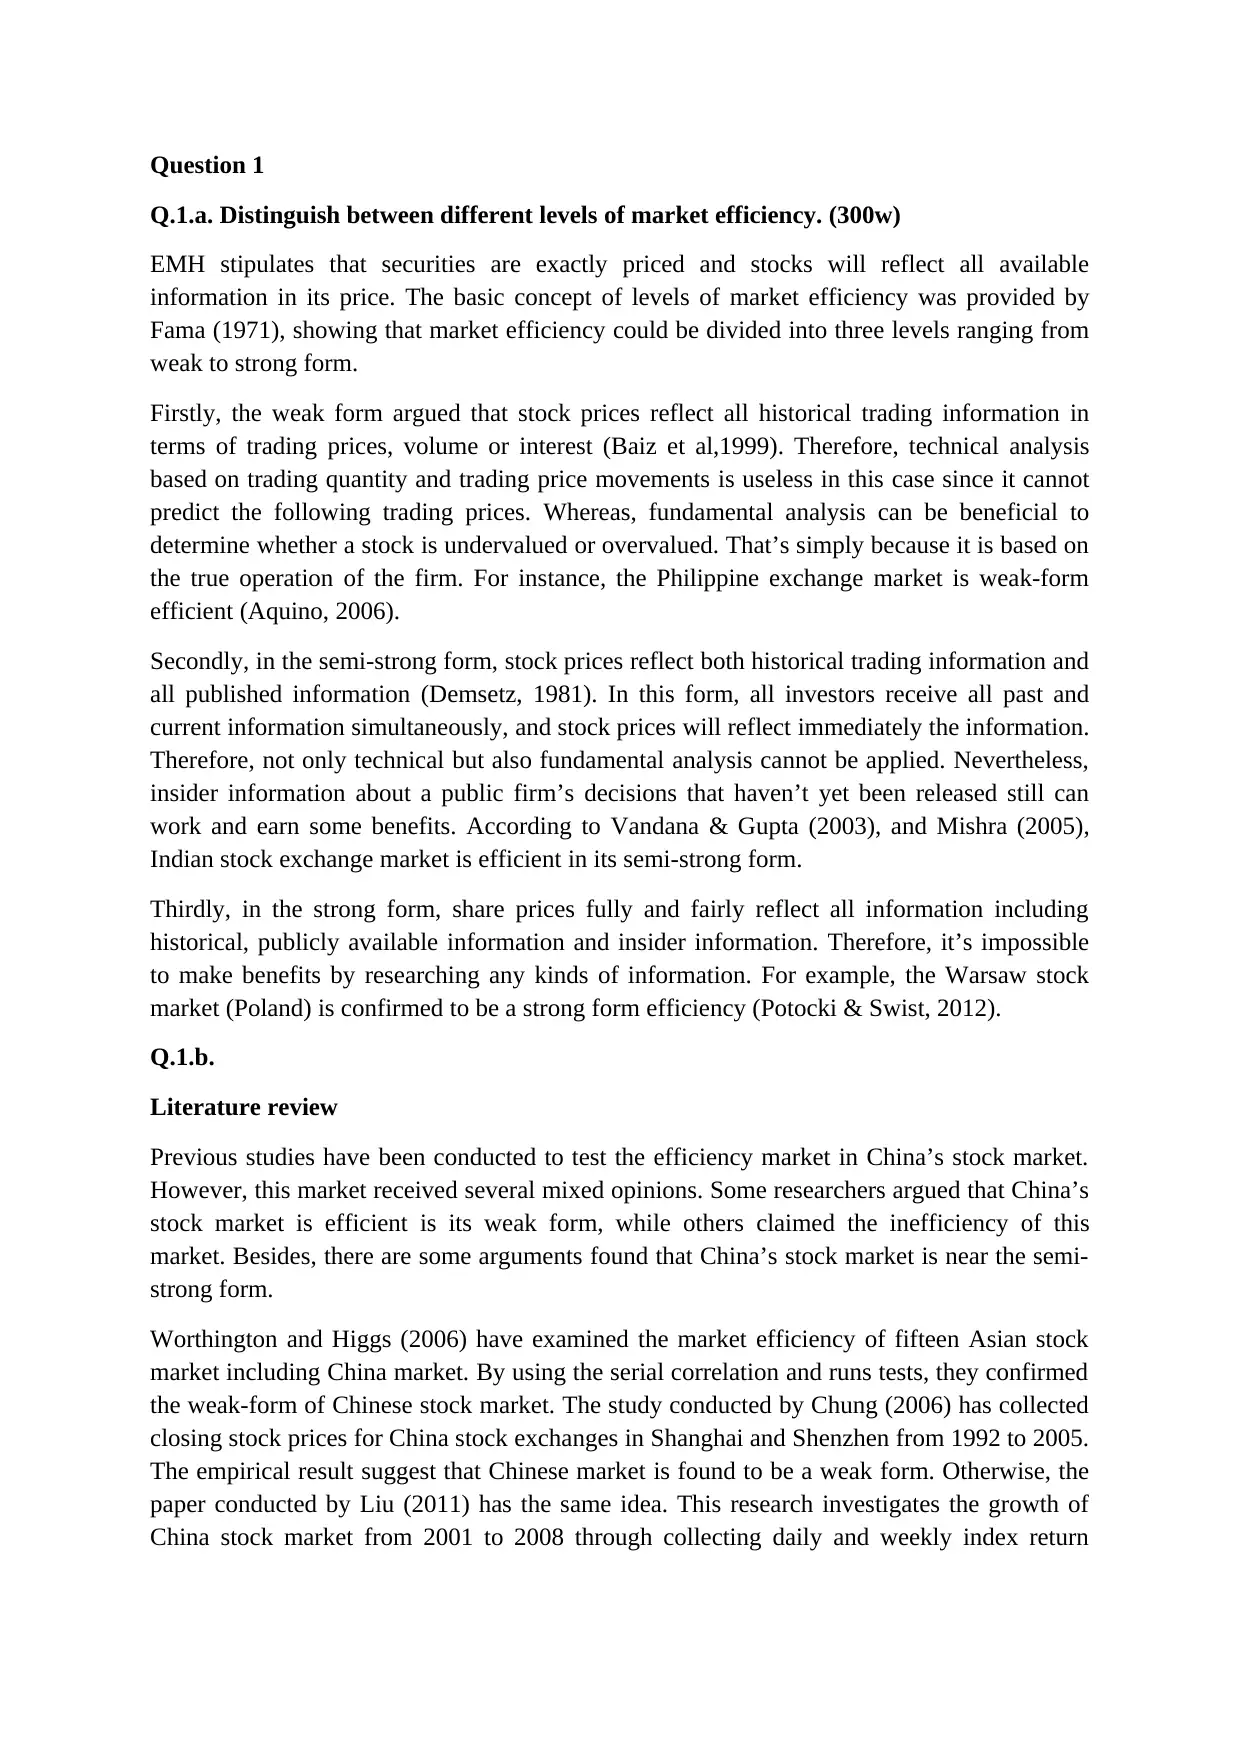
Empirical Evidence
Shanghai composite index (SSEC), Inner Mongolia BaoTou stock index and China
Molybdenum stock are selected to test the efficient market of China’s stock market, and the
data collected comes from Investing.com. Particularly, the closing price index is gathered
from 28th June to 26th November 2021. Rate of return formula R= [P1 – P(t-1)]/ P(t-1)*100%
is applied to check whether Chinese stock market is efficient or not.
28-Jun-21
5-Jul-21
12-Jul-21
19-Jul-21
26-Jul-21
2-Aug-21
9-Aug-21
16-Aug-21
23-Aug-21
30-Aug-21
6-Sep-21
13-Sep-21
20-Sep-21
27-Sep-21
4-Oct-21
11-Oct-21
18-Oct-21
25-Oct-21
1-Nov-21
8-Nov-21
15-Nov-21
22-Nov-21
-3.00%
-2.00%
-1.00%
0.00%
1.00%
2.00%
3.00%
Daily Return of SSEC Index
stock market.
Nevertheless, the research provided by Lefen and Haijun (2007) has an opposite view. They
choose the reform of the shareholder structure event to test the market efficiency in 1302
sample firms. The result find that the reform on China’s stock market did not get but close to
the semi-strong form. Furthermore, Zhong and Fan (2010) also confirmed the great
improvement of China stock market, near the semi-strong form efficiency.
Other researchers have shown different opinions that China’s stock market is inefficiency.
Particularly, Wen et al (1997) has confirmed this argument by using the Garch-M model to
evaluate the daily rate of return in Shanghai A share index (SHA) and Shenzhen A share
index (SZA) from 2001 to 2009. They conclude that Chinese stock market do not reach the
weak form efficiency. Furthermore, Ma (2000) has examined the weak and semi-strong form
of China’s stock market by testing the random walk of the stock prices through the runs test
and correlation coefficient test. The result found that China’s stock market is nether weak
form nor semi-strong form efficiency.
Empirical Evidence
Shanghai composite index (SSEC), Inner Mongolia BaoTou stock index and China
Molybdenum stock are selected to test the efficient market of China’s stock market, and the
data collected comes from Investing.com. Particularly, the closing price index is gathered
from 28th June to 26th November 2021. Rate of return formula R= [P1 – P(t-1)]/ P(t-1)*100%
is applied to check whether Chinese stock market is efficient or not.
28-Jun-21
5-Jul-21
12-Jul-21
19-Jul-21
26-Jul-21
2-Aug-21
9-Aug-21
16-Aug-21
23-Aug-21
30-Aug-21
6-Sep-21
13-Sep-21
20-Sep-21
27-Sep-21
4-Oct-21
11-Oct-21
18-Oct-21
25-Oct-21
1-Nov-21
8-Nov-21
15-Nov-21
22-Nov-21
-3.00%
-2.00%
-1.00%
0.00%
1.00%
2.00%
3.00%
Daily Return of SSEC Index
28-Jun-21
5-Jul-21
12-Jul-21
19-Jul-21
26-Jul-21
2-Aug-21
9-Aug-21
16-Aug-21
23-Aug-21
30-Aug-21
6-Sep-21
13-Sep-21
20-Sep-21
27-Sep-21
4-Oct-21
11-Oct-21
18-Oct-21
25-Oct-21
1-Nov-21
8-Nov-21
15-Nov-21
22-Nov-21
-15.00%
-10.00%
-5.00%
0.00%
5.00%
10.00%
15.00%
Daily Return of China Molybdenum
Index
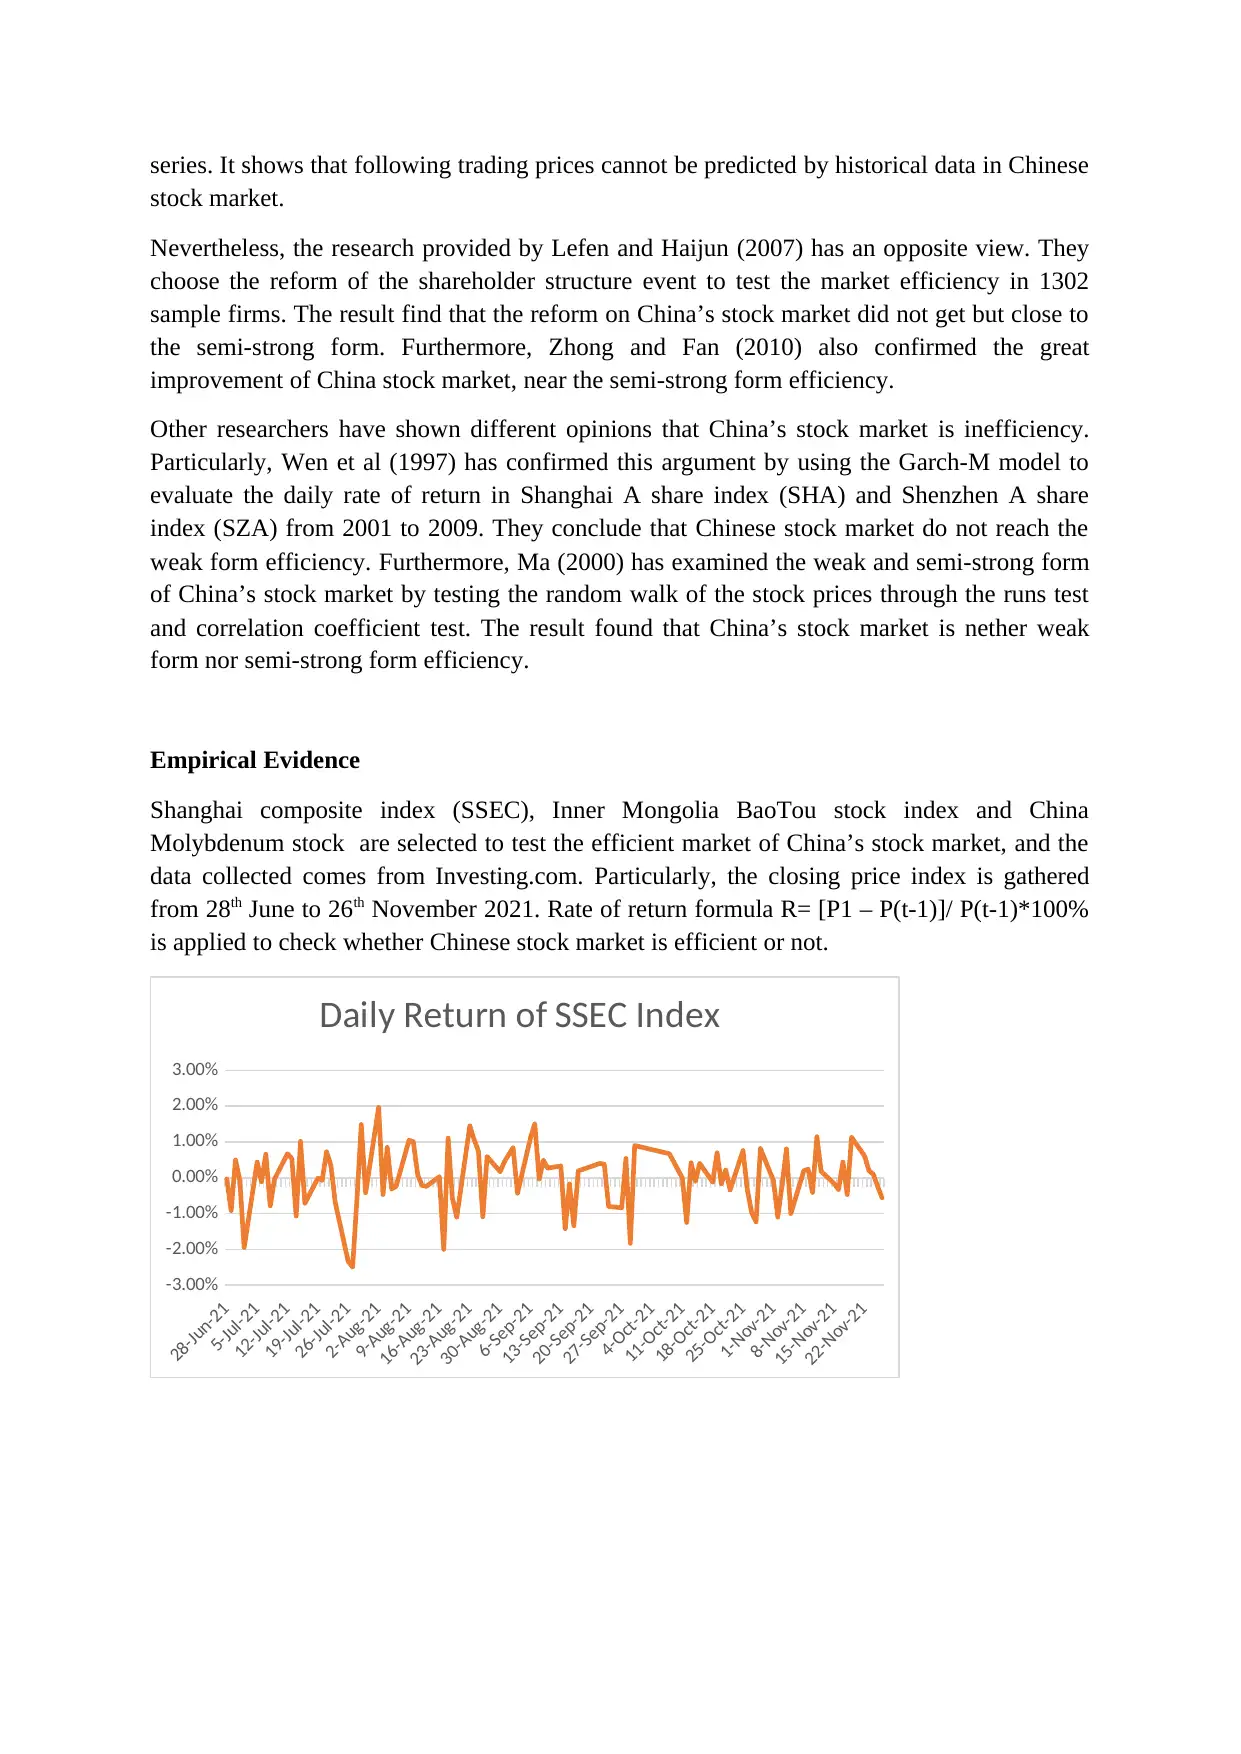
In three charts above, we can see that the rate of return fluctuate around 0. This means that
Shanghai market index, Inner Mongolia BaoTou stock index and China Molybdenum stock
index do not present the clear trend. Based on these information above, it can conclude that
China’s stock market can be defined as a weak form.
China Molybdenum Co Ltd Class A (603993) is selected to test the semi-strong form of
China’s stock market. In 6th July, 2021, this firm decided to pay dividends for the
shareholders, therefore the date of this announcement is chosen as a major event. The stock
price is collected within 10 days before and after the date of dividend payment, as follow:
Price
t-10 5.12
t-9 5.19
t-8 5.16
t-7 5.36
t-6 5.27
28-Jun-21
5-Jul-21
12-Jul-21
19-Jul-21
26-Jul-21
2-Aug-21
9-Aug-21
16-Aug-21
23-Aug-21
30-Aug-21
6-Sep-21
13-Sep-21
20-Sep-21
27-Sep-21
4-Oct-21
11-Oct-21
18-Oct-21
25-Oct-21
1-Nov-21
8-Nov-21
15-Nov-21
22-Nov-21
-15.00%
-10.00%
-5.00%
0.00%
5.00%
10.00%
15.00%
Daily Return of Inner Mongolia
BaoTou Index
5-Jul-21
12-Jul-21
19-Jul-21
26-Jul-21
2-Aug-21
9-Aug-21
16-Aug-21
23-Aug-21
30-Aug-21
6-Sep-21
13-Sep-21
20-Sep-21
27-Sep-21
4-Oct-21
11-Oct-21
18-Oct-21
25-Oct-21
1-Nov-21
8-Nov-21
15-Nov-21
22-Nov-21
-15.00%
-10.00%
-5.00%
0.00%
5.00%
10.00%
15.00%
Daily Return of China Molybdenum
Index
In three charts above, we can see that the rate of return fluctuate around 0. This means that
Shanghai market index, Inner Mongolia BaoTou stock index and China Molybdenum stock
index do not present the clear trend. Based on these information above, it can conclude that
China’s stock market can be defined as a weak form.
China Molybdenum Co Ltd Class A (603993) is selected to test the semi-strong form of
China’s stock market. In 6th July, 2021, this firm decided to pay dividends for the
shareholders, therefore the date of this announcement is chosen as a major event. The stock
price is collected within 10 days before and after the date of dividend payment, as follow:
Price
t-10 5.12
t-9 5.19
t-8 5.16
t-7 5.36
t-6 5.27
28-Jun-21
5-Jul-21
12-Jul-21
19-Jul-21
26-Jul-21
2-Aug-21
9-Aug-21
16-Aug-21
23-Aug-21
30-Aug-21
6-Sep-21
13-Sep-21
20-Sep-21
27-Sep-21
4-Oct-21
11-Oct-21
18-Oct-21
25-Oct-21
1-Nov-21
8-Nov-21
15-Nov-21
22-Nov-21
-15.00%
-10.00%
-5.00%
0.00%
5.00%
10.00%
15.00%
Daily Return of Inner Mongolia
BaoTou Index
⊘ This is a preview!⊘
Do you want full access?
Subscribe today to unlock all pages.
Trusted by 1+ million students worldwide
t-5 5.14
t-4 5.16
t-3 5.06
t-2 5.11
t-1 5.59
t=0 5.71
t+1 6.2
t+2 6.29
t+3 6.65
t+4 6.9
t+5 6.55
t+6 6.62
t+7 6.72
t+8 6.73
t+9 6.81
t+10 6.7
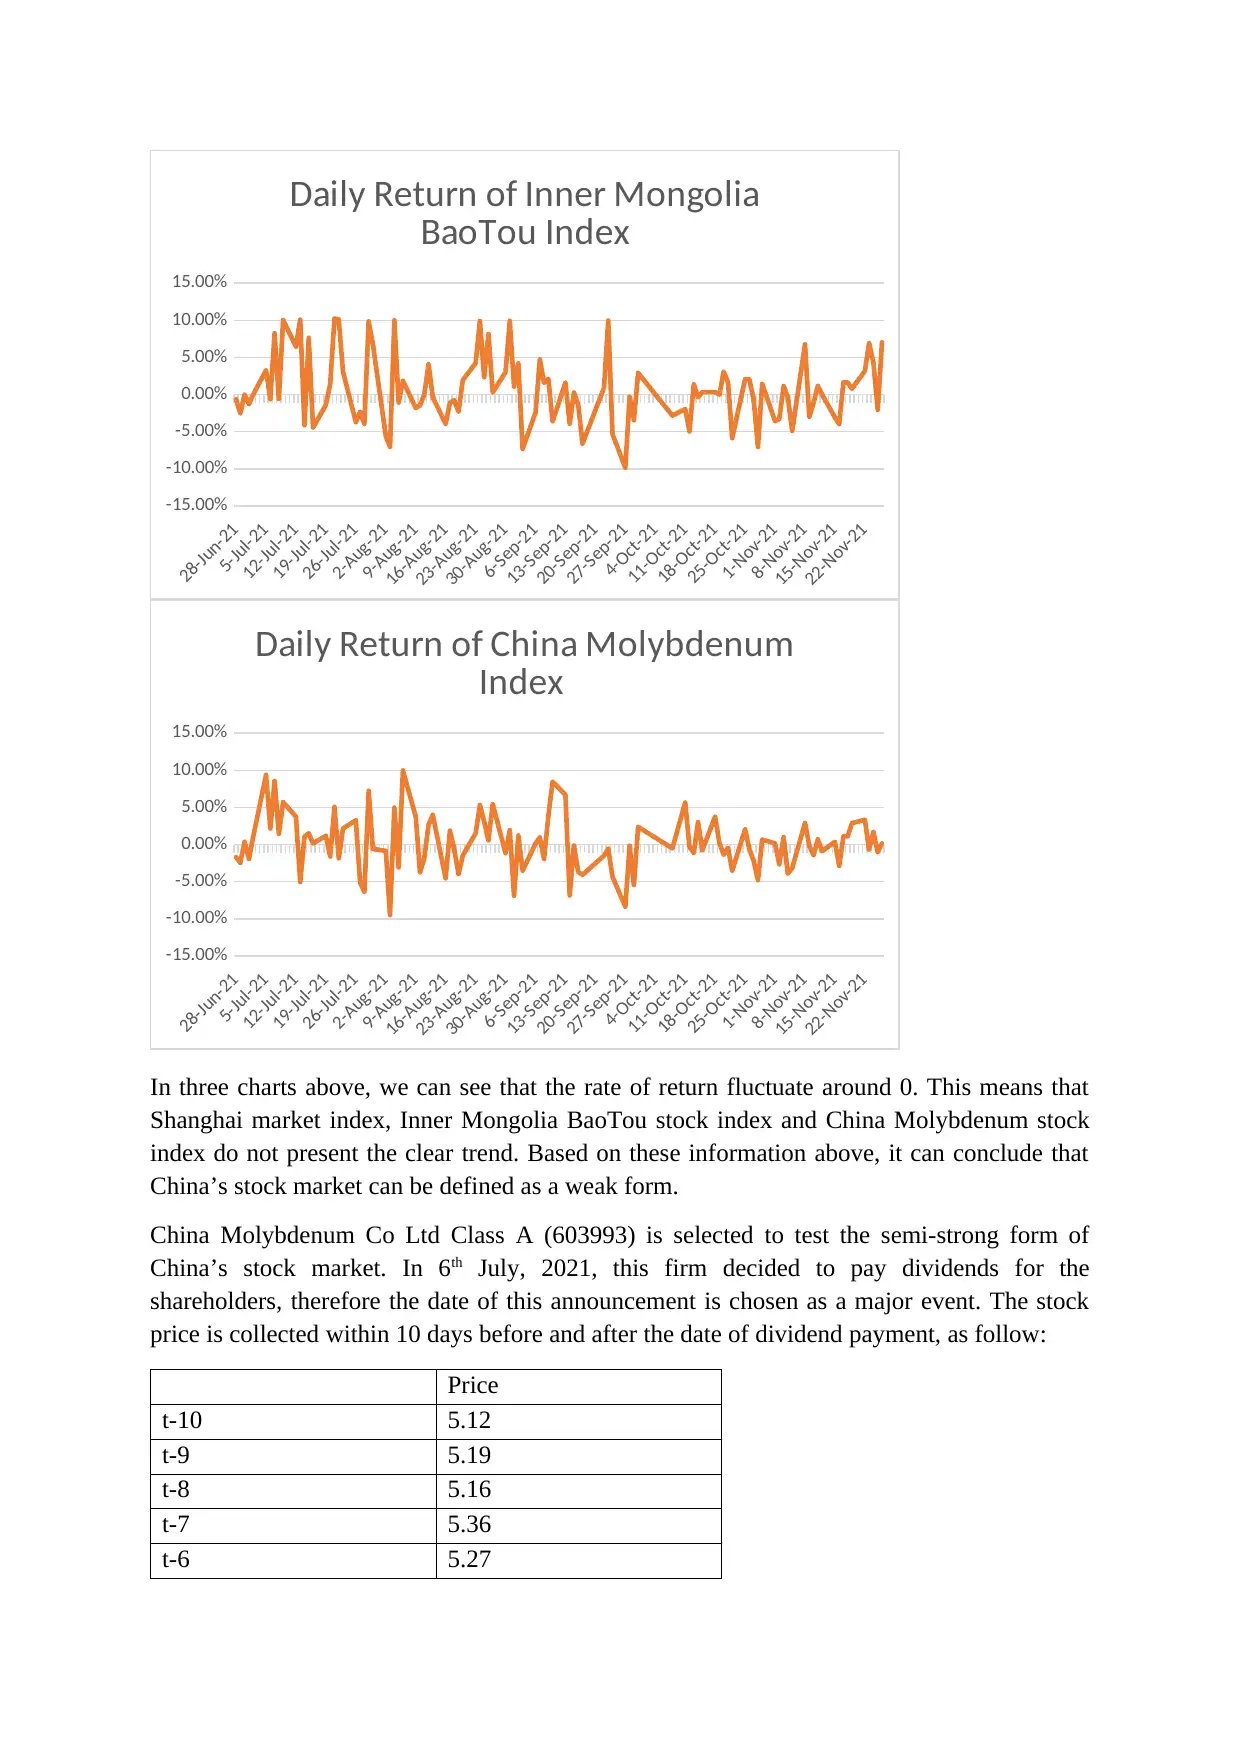
From the table below, the stock price is still low and do not enhance much until the date of
the announcement (t=0). After the payment date, it jumps dramatically from 5.71 (t=0) to 6.2
(t+1), which shows that not many investors concern about this information, and the
information is not incorporated in the stock price. Besides, the stock price is recorded to
enhance sharply in the following days. Therefore, it confirms that the market for China
Molybdenum firm is not or close to semi-strong form.
In conclusion, China’s stock market is found to be a weak form efficiency through evaluating
the daily rate of return and the level of information receptivity. The empirical result provides
the same idea with Worthington and Higgs (2006), Chung (2006) and Liu (2011).
Question 2:
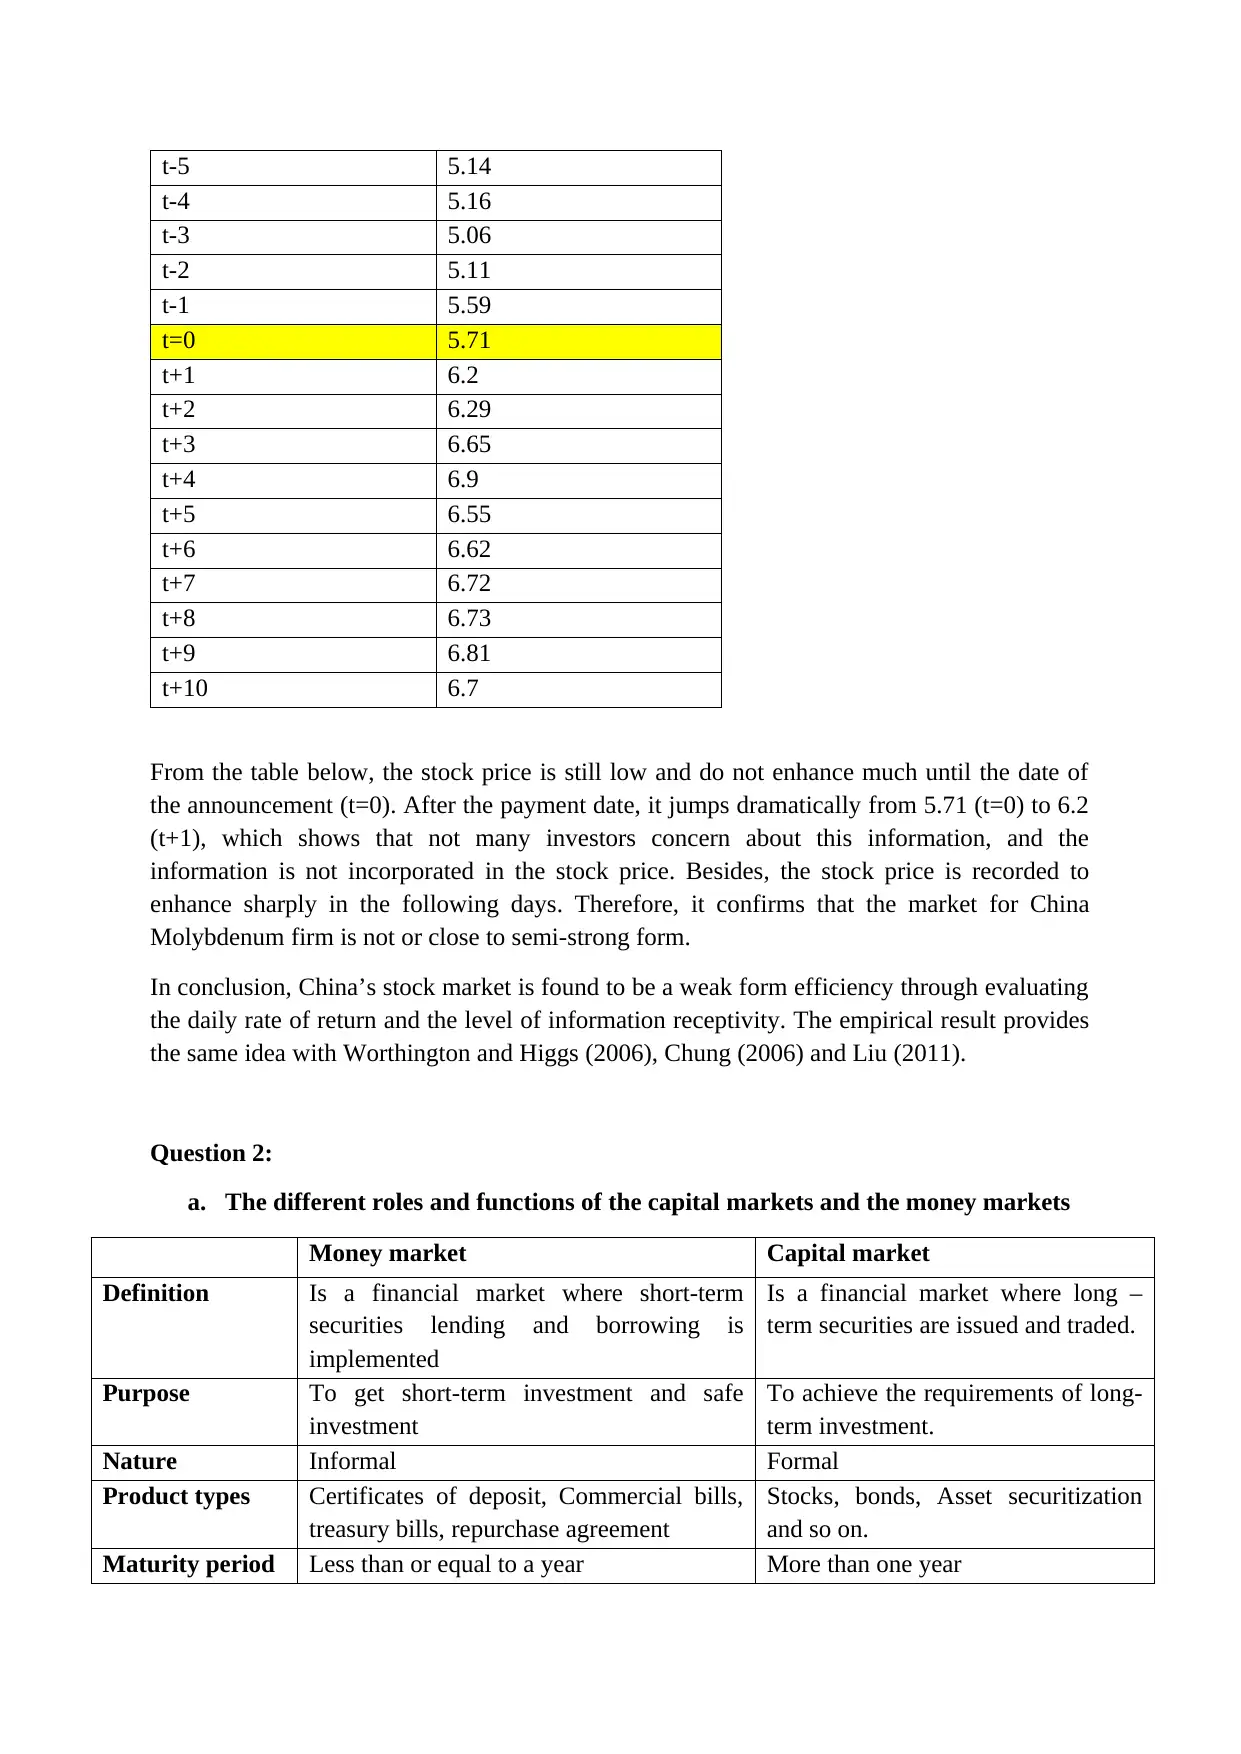
a. The different roles and functions of the capital markets and the money markets
Money market Capital market
Definition Is a financial market where short-term
securities lending and borrowing is
implemented
Is a financial market where long –
term securities are issued and traded.
Purpose To get short-term investment and safe
investment
To achieve the requirements of long-
term investment.
Nature Informal Formal
Product types Certificates of deposit, Commercial bills,
treasury bills, repurchase agreement
Stocks, bonds, Asset securitization
and so on.
Maturity period Less than or equal to a year More than one year
t-4 5.16
t-3 5.06
t-2 5.11
t-1 5.59
t=0 5.71
t+1 6.2
t+2 6.29
t+3 6.65
t+4 6.9
t+5 6.55
t+6 6.62
t+7 6.72
t+8 6.73
t+9 6.81
t+10 6.7
From the table below, the stock price is still low and do not enhance much until the date of
the announcement (t=0). After the payment date, it jumps dramatically from 5.71 (t=0) to 6.2
(t+1), which shows that not many investors concern about this information, and the
information is not incorporated in the stock price. Besides, the stock price is recorded to
enhance sharply in the following days. Therefore, it confirms that the market for China
Molybdenum firm is not or close to semi-strong form.
In conclusion, China’s stock market is found to be a weak form efficiency through evaluating
the daily rate of return and the level of information receptivity. The empirical result provides
the same idea with Worthington and Higgs (2006), Chung (2006) and Liu (2011).
Question 2:
a. The different roles and functions of the capital markets and the money markets
Money market Capital market
Definition Is a financial market where short-term
securities lending and borrowing is
implemented
Is a financial market where long –
term securities are issued and traded.
Purpose To get short-term investment and safe
investment
To achieve the requirements of long-
term investment.
Nature Informal Formal
Product types Certificates of deposit, Commercial bills,
treasury bills, repurchase agreement
Stocks, bonds, Asset securitization
and so on.
Maturity period Less than or equal to a year More than one year
Paraphrase This Document
Need a fresh take? Get an instant paraphrase of this document with our AI Paraphraser
Liquidity High liquidity because all instruments have
short maturity periods.
Less liquidity compared to money
market
Risk feature Low risk since they are issued by banks,
government and big firms with high
reputation and healthy financial state.
Whereas, it can cause low return.
More risky owning to less liquidity
and long maturity
Return Low return due to low risk and short
maturity
High return
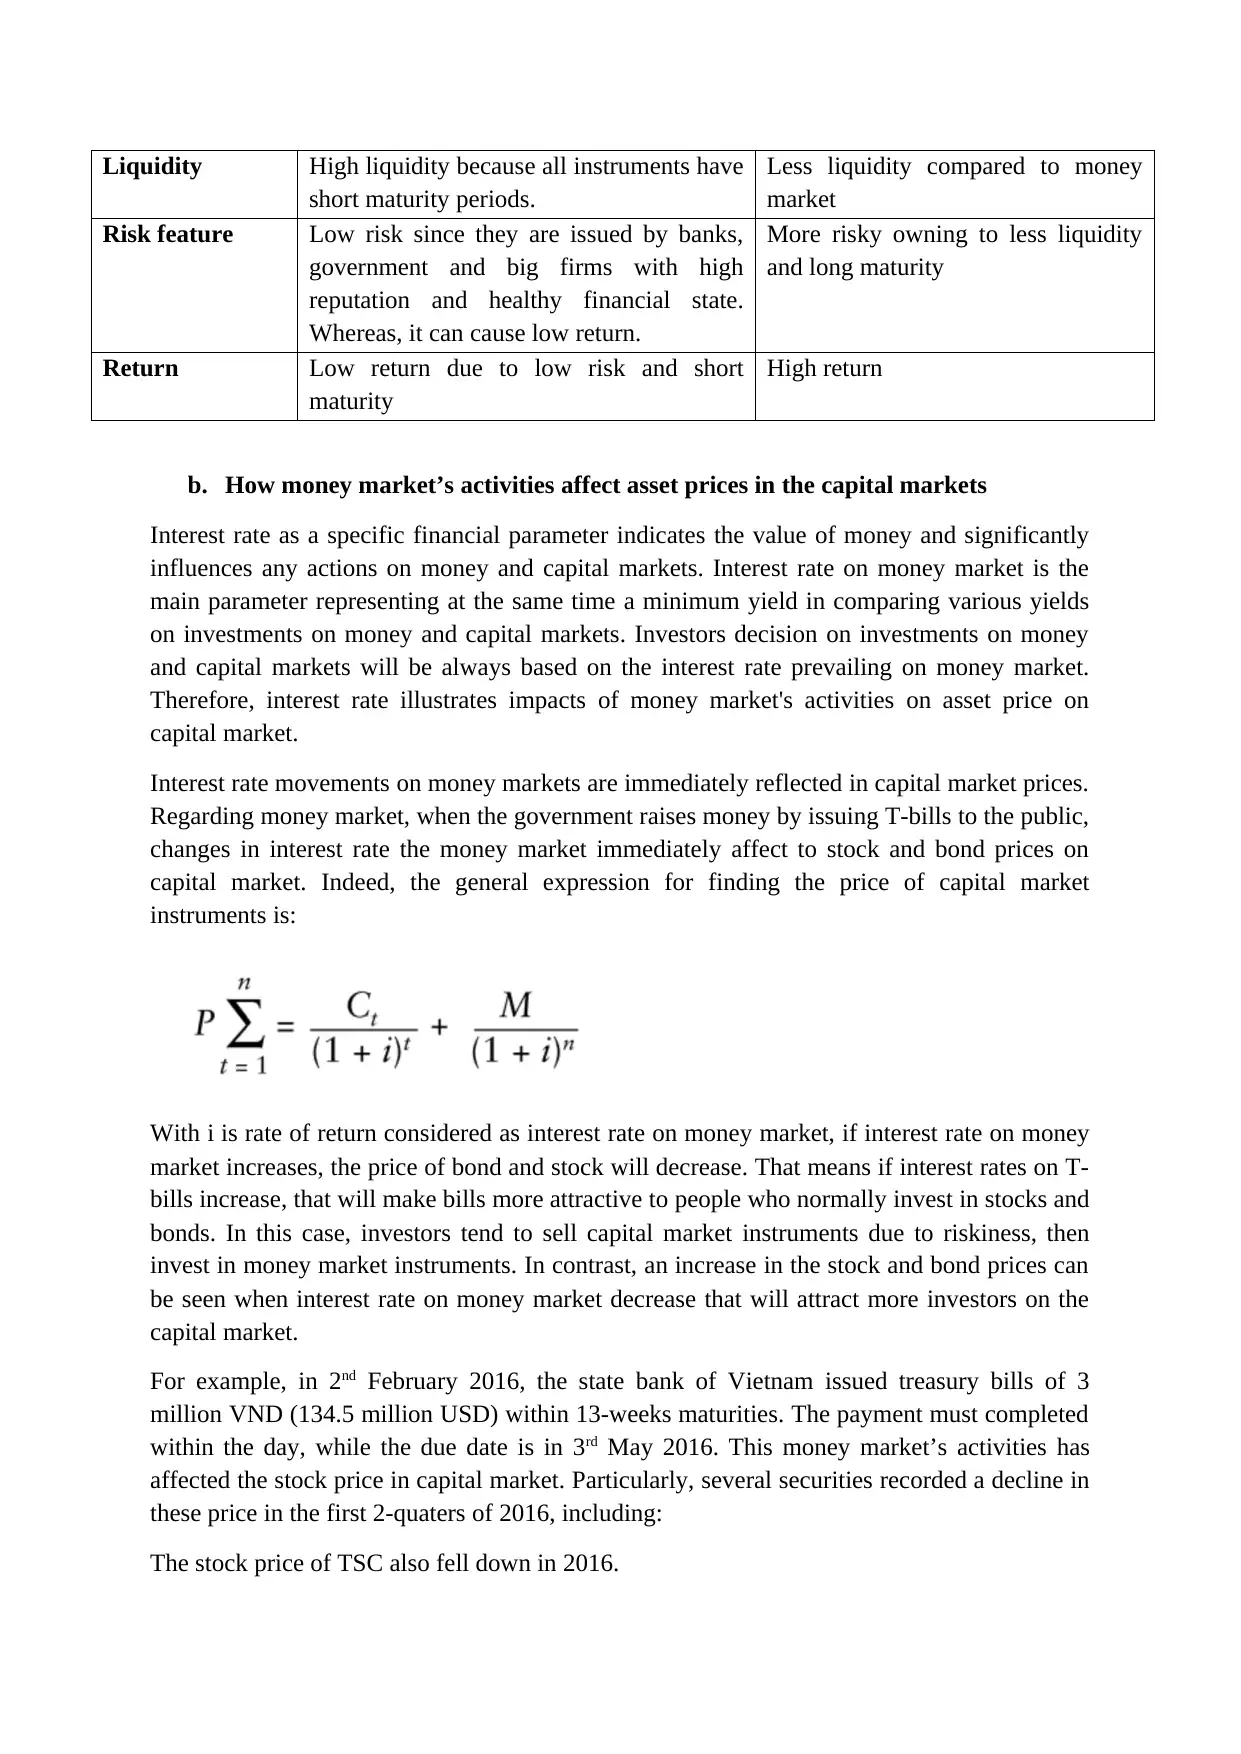
b. How money market’s activities affect asset prices in the capital markets
Interest rate as a specific financial parameter indicates the value of money and significantly
influences any actions on money and capital markets. Interest rate on money market is the
main parameter representing at the same time a minimum yield in comparing various yields
on investments on money and capital markets. Investors decision on investments on money
and capital markets will be always based on the interest rate prevailing on money market.
Therefore, interest rate illustrates impacts of money market's activities on asset price on
capital market.
Interest rate movements on money markets are immediately reflected in capital market prices.
Regarding money market, when the government raises money by issuing T-bills to the public,
changes in interest rate the money market immediately affect to stock and bond prices on
capital market. Indeed, the general expression for finding the price of capital market
instruments is:
With i is rate of return considered as interest rate on money market, if interest rate on money
market increases, the price of bond and stock will decrease. That means if interest rates on T-
bills increase, that will make bills more attractive to people who normally invest in stocks and
bonds. In this case, investors tend to sell capital market instruments due to riskiness, then
invest in money market instruments. In contrast, an increase in the stock and bond prices can
be seen when interest rate on money market decrease that will attract more investors on the
capital market.
For example, in 2nd February 2016, the state bank of Vietnam issued treasury bills of 3
million VND (134.5 million USD) within 13-weeks maturities. The payment must completed
within the day, while the due date is in 3rd May 2016. This money market’s activities has
affected the stock price in capital market. Particularly, several securities recorded a decline in
these price in the first 2-quaters of 2016, including:
The stock price of TSC also fell down in 2016.
short maturity periods.
Less liquidity compared to money
market
Risk feature Low risk since they are issued by banks,
government and big firms with high
reputation and healthy financial state.
Whereas, it can cause low return.
More risky owning to less liquidity
and long maturity
Return Low return due to low risk and short
maturity
High return
b. How money market’s activities affect asset prices in the capital markets
Interest rate as a specific financial parameter indicates the value of money and significantly
influences any actions on money and capital markets. Interest rate on money market is the
main parameter representing at the same time a minimum yield in comparing various yields
on investments on money and capital markets. Investors decision on investments on money
and capital markets will be always based on the interest rate prevailing on money market.
Therefore, interest rate illustrates impacts of money market's activities on asset price on
capital market.
Interest rate movements on money markets are immediately reflected in capital market prices.
Regarding money market, when the government raises money by issuing T-bills to the public,
changes in interest rate the money market immediately affect to stock and bond prices on
capital market. Indeed, the general expression for finding the price of capital market
instruments is:
With i is rate of return considered as interest rate on money market, if interest rate on money
market increases, the price of bond and stock will decrease. That means if interest rates on T-
bills increase, that will make bills more attractive to people who normally invest in stocks and
bonds. In this case, investors tend to sell capital market instruments due to riskiness, then
invest in money market instruments. In contrast, an increase in the stock and bond prices can
be seen when interest rate on money market decrease that will attract more investors on the
capital market.
For example, in 2nd February 2016, the state bank of Vietnam issued treasury bills of 3
million VND (134.5 million USD) within 13-weeks maturities. The payment must completed
within the day, while the due date is in 3rd May 2016. This money market’s activities has
affected the stock price in capital market. Particularly, several securities recorded a decline in
these price in the first 2-quaters of 2016, including:
The stock price of TSC also fell down in 2016.
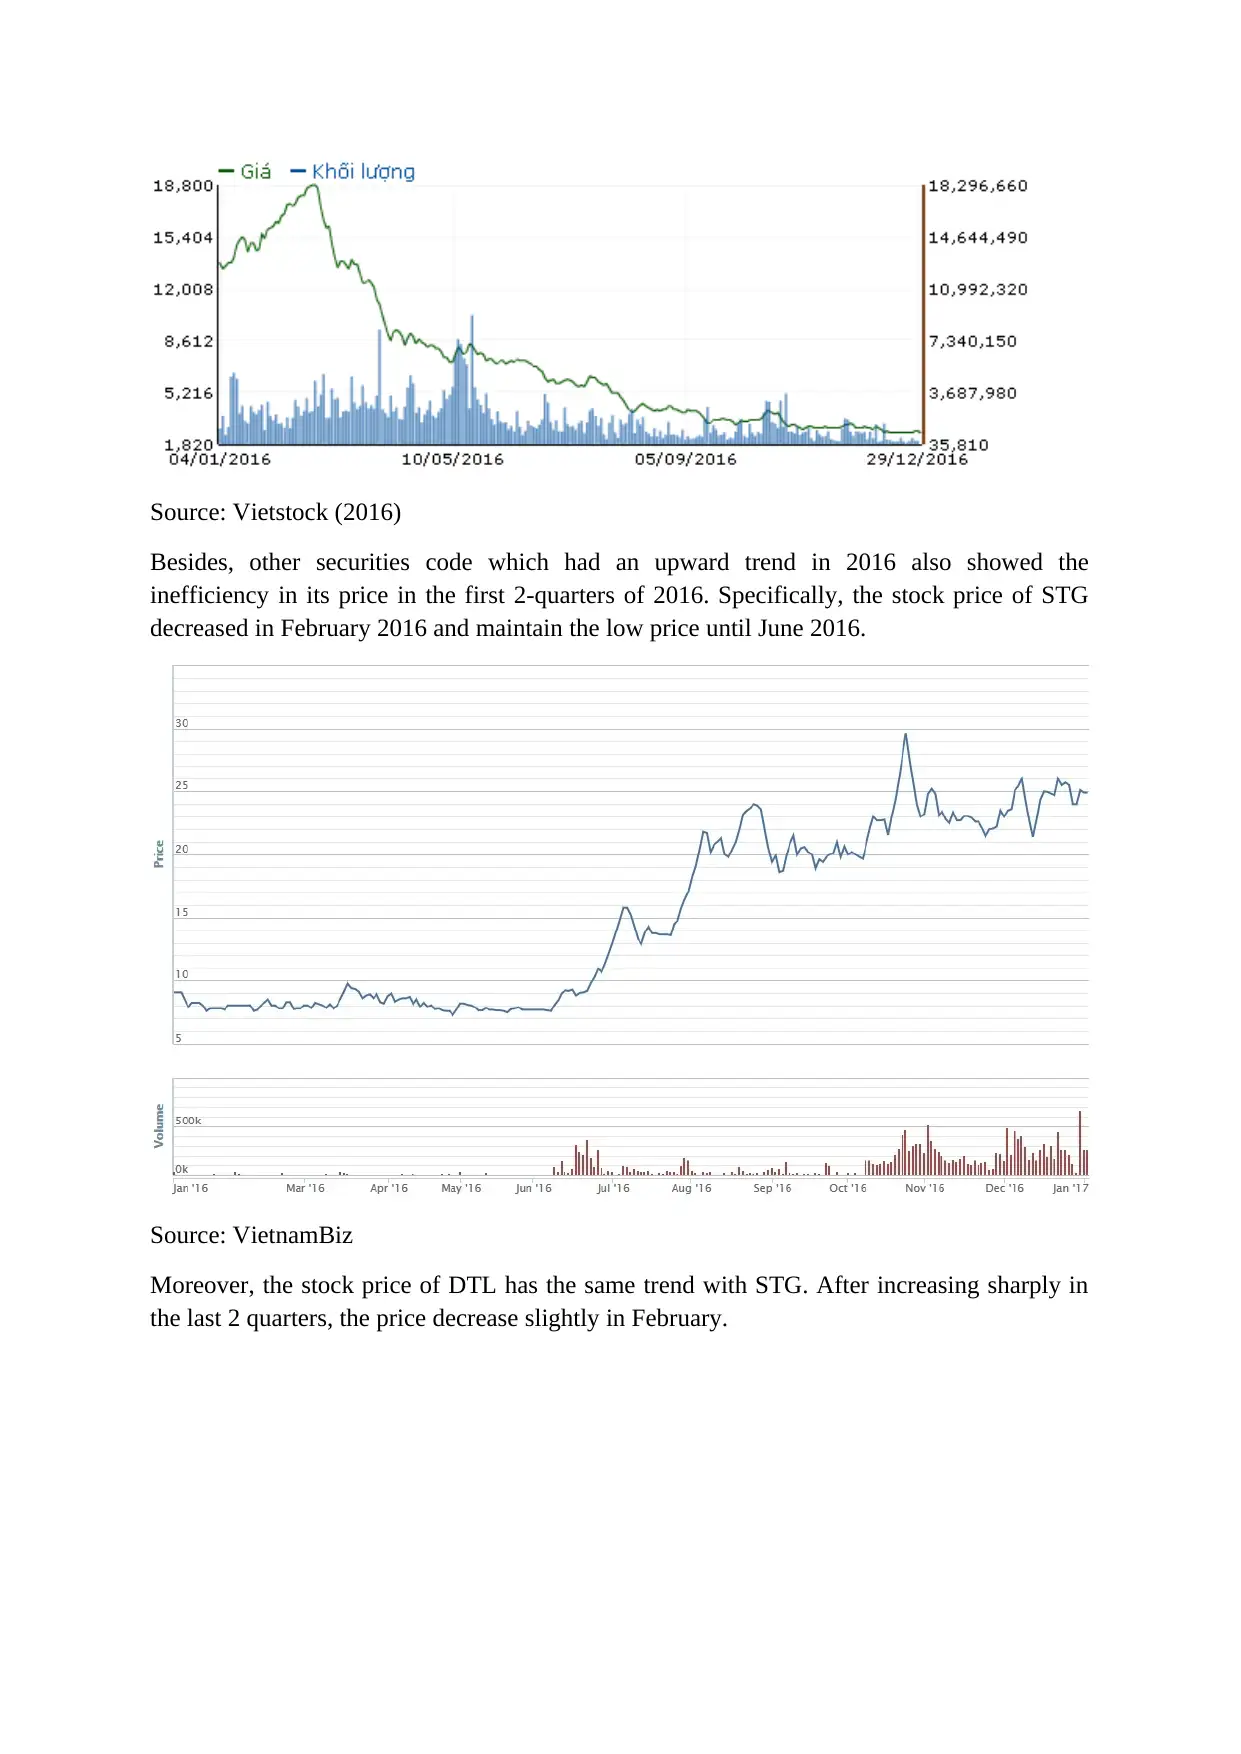
Source: Vietstock (2016)
Besides, other securities code which had an upward trend in 2016 also showed the
inefficiency in its price in the first 2-quarters of 2016. Specifically, the stock price of STG
decreased in February 2016 and maintain the low price until June 2016.
Source: VietnamBiz
Moreover, the stock price of DTL has the same trend with STG. After increasing sharply in
the last 2 quarters, the price decrease slightly in February.
⊘ This is a preview!⊘
Do you want full access?
Subscribe today to unlock all pages.
Trusted by 1+ million students worldwide
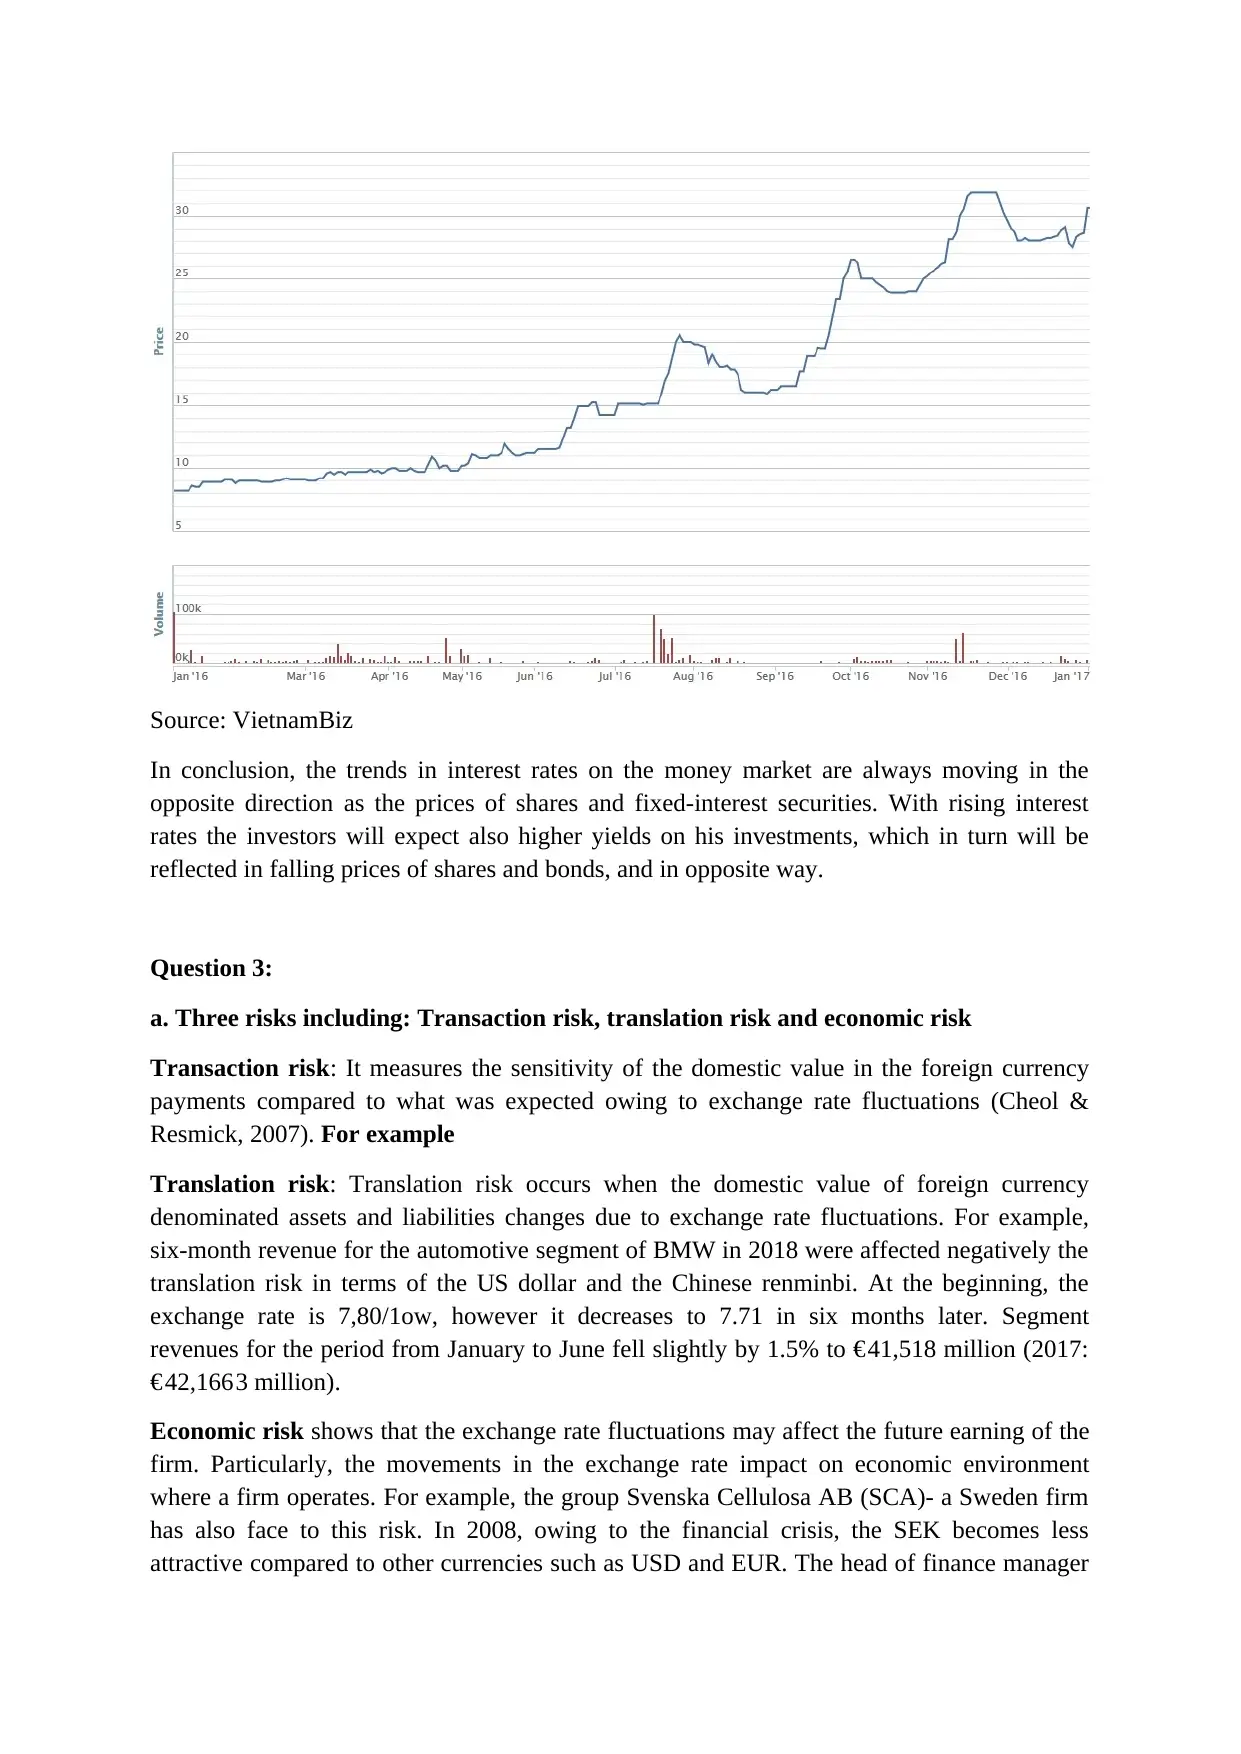
Source: VietnamBiz
In conclusion, the trends in interest rates on the money market are always moving in the
opposite direction as the prices of shares and fixed-interest securities. With rising interest
rates the investors will expect also higher yields on his investments, which in turn will be
reflected in falling prices of shares and bonds, and in opposite way.
Question 3:
a. Three risks including: Transaction risk, translation risk and economic risk
Transaction risk: It measures the sensitivity of the domestic value in the foreign currency
payments compared to what was expected owing to exchange rate fluctuations (Cheol &
Resmick, 2007). For example
Translation risk: Translation risk occurs when the domestic value of foreign currency
denominated assets and liabilities changes due to exchange rate fluctuations. For example,
six-month revenue for the automotive segment of BMW in 2018 were affected negatively the
translation risk in terms of the US dollar and the Chinese renminbi. At the beginning, the
exchange rate is 7,80/1ow, however it decreases to 7.71 in six months later. Segment
revenues for the period from January to June fell slightly by 1.5% to € 41,518 million (2017:
€ 42,166 3 million).
Economic risk shows that the exchange rate fluctuations may affect the future earning of the
firm. Particularly, the movements in the exchange rate impact on economic environment
where a firm operates. For example, the group Svenska Cellulosa AB (SCA)- a Sweden firm
has also face to this risk. In 2008, owing to the financial crisis, the SEK becomes less
attractive compared to other currencies such as USD and EUR. The head of finance manager
Paraphrase This Document
Need a fresh take? Get an instant paraphrase of this document with our AI Paraphraser
–Linvall says that the decline in home currency has affected negatively the suppliers who get
paid in SEK. Whereas, the international customers get a lower price, which reduces SAC’s
revenue (Lindstrom & Saterborg, 2009).
Forward contract: It is an obligation to buy or sell a currency at a specified exchange rate,
specified time as well as a specified amount. Obviously, forward contract can help
international traders deal with the risks arising due to exchange rate fluctuations. According
to Belk and Glaum (1990), forward contract is one of the most common way used to hedge
currency risks.. The group Svenska Cellulosa AB (SCA) also applies forward contract to
hedge their currency risks (Lindstrom & Saterborg, 2009). The forwards are primarily used to
hedge for movements in exchange rates. Ulf Stengard - Senior dealer foreign exchange in
SCA, whose daily work mostly involves currency trading, explains the banks function when
making forward contracts. Practically it could work like this: Stengard got the information
that he will transfer SEK into 100m USD in 10 days. He contacts the banks through the bank
platform and specifies his order. The contract will be on 100m USD, 10 days maturity and he
transmits his order. The best price available will be listed, and the forward contract could be
confirmed instantly. Clearly, forward contract assist SCA in avoiding risks arising owing to
the movement of exchange rate.
b. Distinguish between the spot rate and the forward foreign exchange rates
The spot rate is the exchange rate that a currency pair can be bought or sold immediately.
The spot price is quoted as a spread which is the difference in the buying (bid) and selling
(ask) price set by the central bank. For example, according to the State bank of Vietnam
(2021), the VND/$ spot rate is 22,650-23,771 VND. US dollar is the primary currency while
VND is the secondary currency. Particularly, with 22,650 VND, customers can buy $1 as a
buyer’s rate. $1 can get 23,771 VND as a seller’s rate.
The forward rate is the rate of exchange agreed upon now for a foreign exchange
transaction that will happen at a specified date in the future. The agreement to make such an
exchange in the future at a rate agreed upon now is called forward contract. For instance,
according to Techcombank (2021), The VND/$ 30-days forward exchange rate is 22,782-
22,943 VND. The bid price is 22,782 VND, while the ask price is 22,943 VND.
The nature relationship between spot rate and forward rate
The forward rate is calculated based on the spot rate with the formula is:
Forward rate = 1+ Is
1+ Ip x spot rate
Is is the interest rate of secondary currency, and Ip is the interest rate of primary currency.
Question 4:
Asymmetric information situation happens when one party of a financial contract has better
information than the other. The party knowing less information may make less preferable
decision or even get huge losses. This is meanly because that party may not evaluate fully the
risk which can occur thereby mispricing it. Asymmetric information situation can happen to
either lenders or borrowers, sellers or buyers of financial products. Asymmetric information
situations are usually divided into two types of threats which is Adverse selection and Moral
hazard.
Regarding Adverse selection, it operates prior to a transaction being entered into.
Specifically, this situation happens when the lender or buyer does not have fully detailed
information about the borrower or the issuer. This mainly because the relevant information is
not available or the borrower (the issuer) want to hide from the lender (the buyer). Therefore,
the lender or buyer cannot make an accurate appraisal of the level of risk or even does not
evaluate the risk. Look at the case of Parmalat as an example. Parmalat was established in
Northern Italy as a family-run farm in 1962. Until the crisis in 2003, Parmalat had 214 listed
subsidiaries in 48 different countries. Farmalat’s fraud apparently occurs from 1990 to 2003.
In general, the firm’s financial performance has problems in 1990, however, instead of fixing,
Parmalat decided to solve these problems through fraud and collusion. During the period of
13-year, the firm applied a lot of unethical techniques to hide its financial situation. Tanzi
designed a merger plan. He let Parmalat combine with a securities firm that was inactive but
listed on the Milan stock exchange. The combined company then raised about 150 million
euros from outside investors. As a result, Parmalat became a joint-stock company in 1990 and
closed the debt holes in the accounts. Furthermore, they create fake transaction through a
double-billing scheme with the aim of enhancing revenues. They used these inflation trades
to borrow money from banks. They even cooperate with auditors and banks to shield the
fraud indefinitely. Parmalat's scandal was exposed when the group revealed a subsidiary bank
account without 3.94 billion euros. The group filed for bankruptcy and announced debts of up
to 14.3 billion euros.
For Moral Hazard, it occurs after a contract has been finished. It is the situation whereby the
borrower or issuer receives funds and invests them in riskier projects than what the lender
expected. The high return is mainly a reason why the borrower invests in such projects which
cause risky for all parties. The scandal of Enron can be consider as an outstanding example
for moral hazard. Enron is among the largest firm in US and one of the top-ten Us public firm
in 2000. Nevertheless, Enron went bankruptcy in 2001 with $31,24 billion debt, most of
which had been hidden from shareholders and investors. The managers hidden the bad debt
from shareholders and continue to enhance the leverage ratio not reporting on the firm’s
balance sheets. Eventually, Enron did not deal with the debt and declared bankruptcy, which
is a bad new for shareholders. In the case of Enron, almost shareholders lost their funds.
The need for regulating financial market
Financial regulations refer to a form of regulation or supervision of financial markets and
institutions. One of the key purposes of establishing financial regulations is to maintain the
integrity of the financial system. In the case of Parmalat and Enron, when these firms go
bankruptcy, it is unable to meet its obligation to shareholders or other investors, which can
cause problems for the wider economy. Therefore, financial regulations are applied to enforce
applicable laws; prosecute cases of market misconduct; license providers of financial
⊘ This is a preview!⊘
Do you want full access?
Subscribe today to unlock all pages.
Trusted by 1+ million students worldwide
1 out of 9
Related Documents


Your All-in-One AI-Powered Toolkit for Academic Success.
+13062052269
info@desklib.com
Available 24*7 on WhatsApp / Email
![[object Object]](/_next/static/media/star-bottom.7253800d.svg)
Unlock your academic potential
Copyright © 2020–2026 A2Z Services. All Rights Reserved. Developed and managed by ZUCOL.