BEA200 Intermediate Microeconomics: Market Equilibrium and Tax Effects
VerifiedAdded on 2023/06/13
|22
|4192
|129
Homework Assignment
AI Summary
This microeconomics assignment delves into various economic concepts, starting with an analysis of household spending on soft drinks, energy drinks, and cordials across different net worth quintiles, followed by an examination of the impact of ad valorem taxes on these goods, including tax incidence and revenue implications. The assignment further explores the effects of different tax schemes (ad valorem, volumetric, and content-based) on sugar-sweetened beverages (SSBs). It also covers consumer choice theory, specifically analyzing household demand functions for private education and other goods under varying income levels and government assistance programs. Lastly, the assignment investigates the consumption-leisure model and the effects of tax rate cuts on labor supply, considering both income and substitution effects. Desklib provides past papers and solved assignments for students.
Running Head: MICROECONOMICS
Microeconomics
Name of the Student
Name of the University
Author note
Microeconomics
Name of the Student
Name of the University
Author note
Paraphrase This Document
Need a fresh take? Get an instant paraphrase of this document with our AI Paraphraser
1MICROECONOMICS
Table of Contents
Answer 1....................................................................................................................................2
Answer a.................................................................................................................................2
Answer b................................................................................................................................3
Answer c.................................................................................................................................4
Answer d................................................................................................................................4
Answer e.................................................................................................................................4
Answer f.................................................................................................................................5
Answer g................................................................................................................................5
Answer 2....................................................................................................................................5
Answer a.................................................................................................................................5
Answer b................................................................................................................................6
Answer 3....................................................................................................................................6
Answer a.................................................................................................................................7
Answer b................................................................................................................................8
Answer c...............................................................................................................................11
Answer d..............................................................................................................................11
Answer e...............................................................................................................................11
Answer f...............................................................................................................................11
Answer 4..................................................................................................................................12
Answer a...............................................................................................................................12
Answer b..............................................................................................................................15
Answer c...............................................................................................................................16
Answer 5..................................................................................................................................17
Answer a...............................................................................................................................17
Answer b..............................................................................................................................17
References................................................................................................................................21
2MICROECONOMICS
Answer 1
Total spent on energy drinks, soft drinks and cordials
Net worth Lowest Second Third Fourth Highest
All
Household
Soft drinks 2.77 3.85 3.62 4.11 3.59 3.58
Energy drinks 0.77 0.72 0.39 0.39 0.45 0.52
Cordials 0.30 0.36 0.34 0.40 0.40 0.36
Total Spent 3.84 4.93 4.35 4.90 4.44 4.46
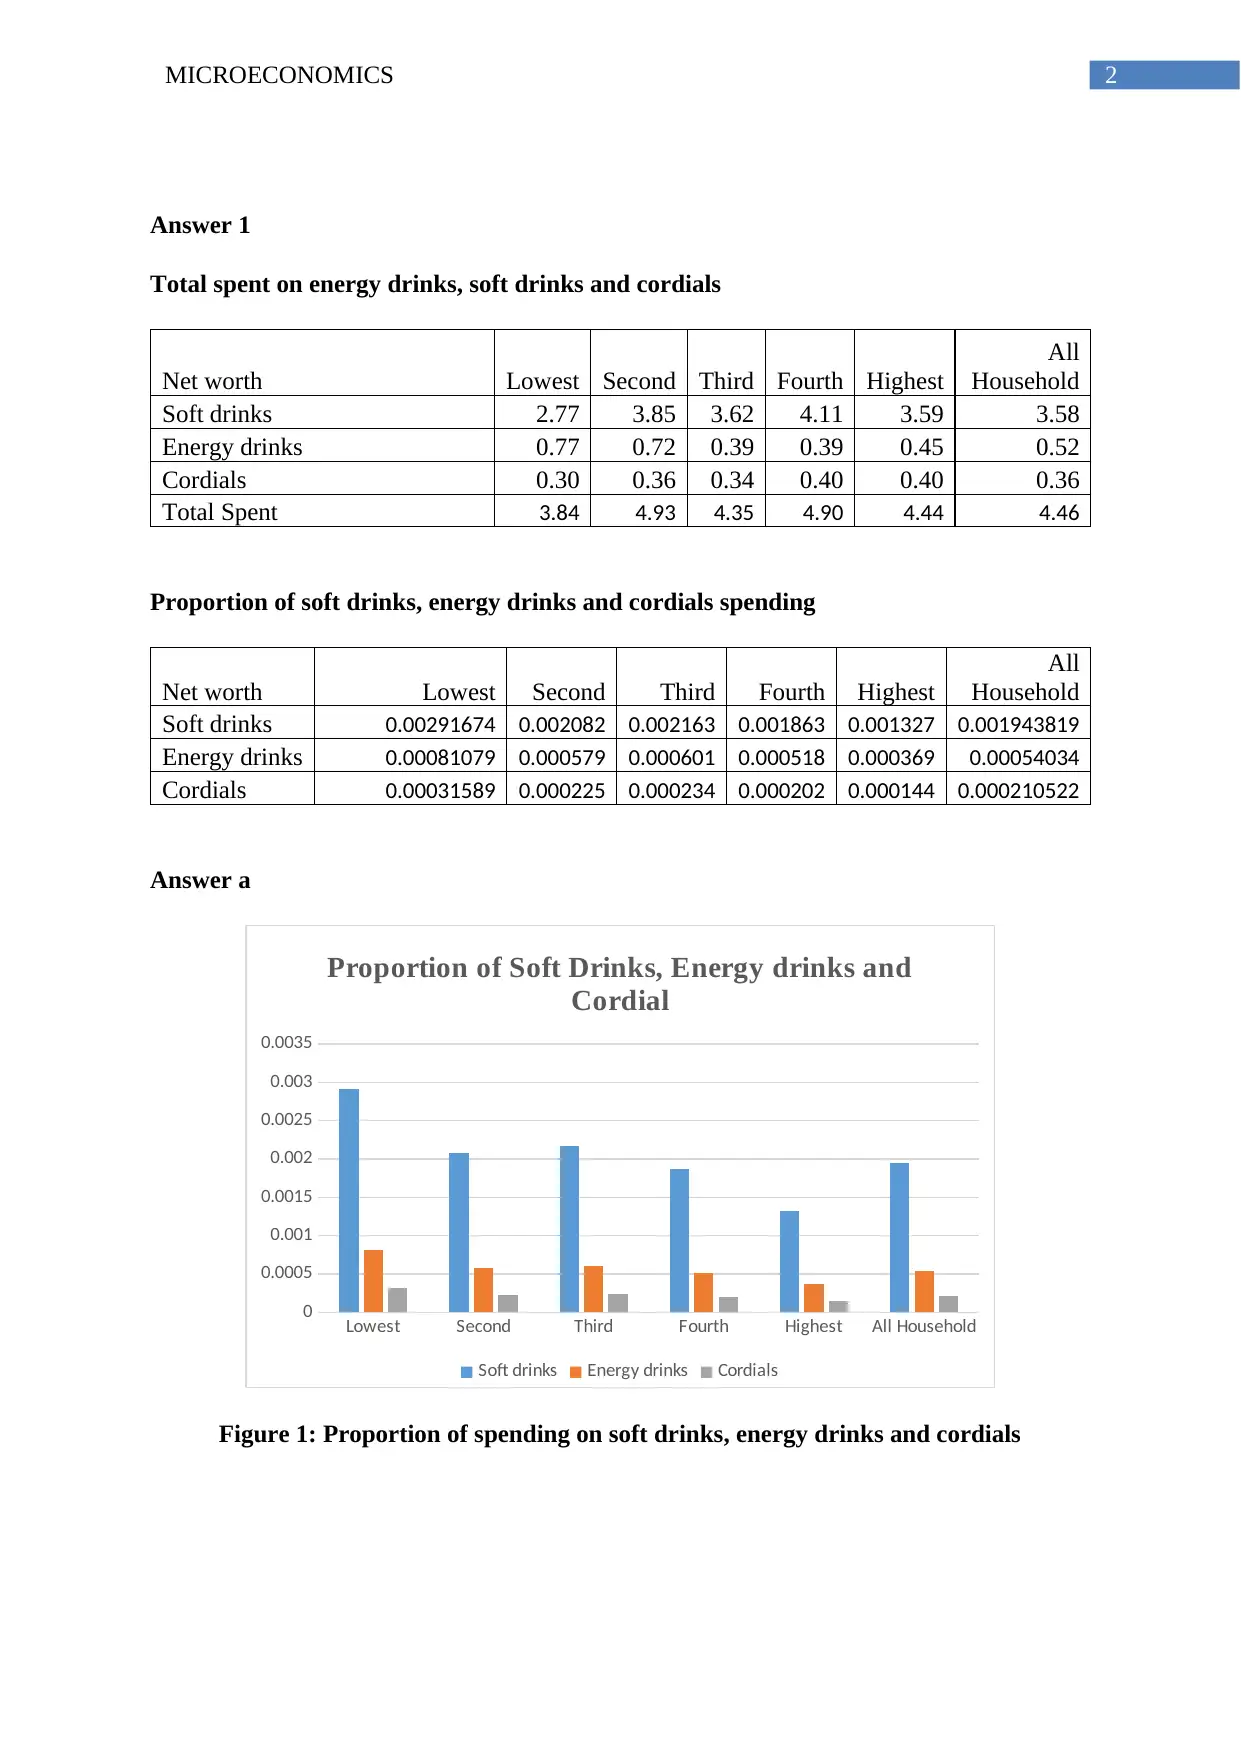
Proportion of soft drinks, energy drinks and cordials spending
Net worth Lowest Second Third Fourth Highest
All
Household
Soft drinks 0.00291674 0.002082 0.002163 0.001863 0.001327 0.001943819
Energy drinks 0.00081079 0.000579 0.000601 0.000518 0.000369 0.00054034
Cordials 0.00031589 0.000225 0.000234 0.000202 0.000144 0.000210522
Answer a
Lowest Second Third Fourth Highest All Household
0
0.0005
0.001
0.0015
0.002
0.0025
0.003
0.0035
Proportion of Soft Drinks, Energy drinks and
Cordial
Soft drinks Energy drinks Cordials
Figure 1: Proportion of spending on soft drinks, energy drinks and cordials
Answer 1
Total spent on energy drinks, soft drinks and cordials
Net worth Lowest Second Third Fourth Highest
All
Household
Soft drinks 2.77 3.85 3.62 4.11 3.59 3.58
Energy drinks 0.77 0.72 0.39 0.39 0.45 0.52
Cordials 0.30 0.36 0.34 0.40 0.40 0.36
Total Spent 3.84 4.93 4.35 4.90 4.44 4.46
Proportion of soft drinks, energy drinks and cordials spending
Net worth Lowest Second Third Fourth Highest
All
Household
Soft drinks 0.00291674 0.002082 0.002163 0.001863 0.001327 0.001943819
Energy drinks 0.00081079 0.000579 0.000601 0.000518 0.000369 0.00054034
Cordials 0.00031589 0.000225 0.000234 0.000202 0.000144 0.000210522
Answer a
Lowest Second Third Fourth Highest All Household
0
0.0005
0.001
0.0015
0.002
0.0025
0.003
0.0035
Proportion of Soft Drinks, Energy drinks and
Cordial
Soft drinks Energy drinks Cordials
Figure 1: Proportion of spending on soft drinks, energy drinks and cordials
⊘ This is a preview!⊘
Do you want full access?
Subscribe today to unlock all pages.
Trusted by 1+ million students worldwide
3MICROECONOMICS
Lowest Second Third Fourth Highest
0.00
1.00
2.00
3.00
4.00
5.00
6.00
Total Spent
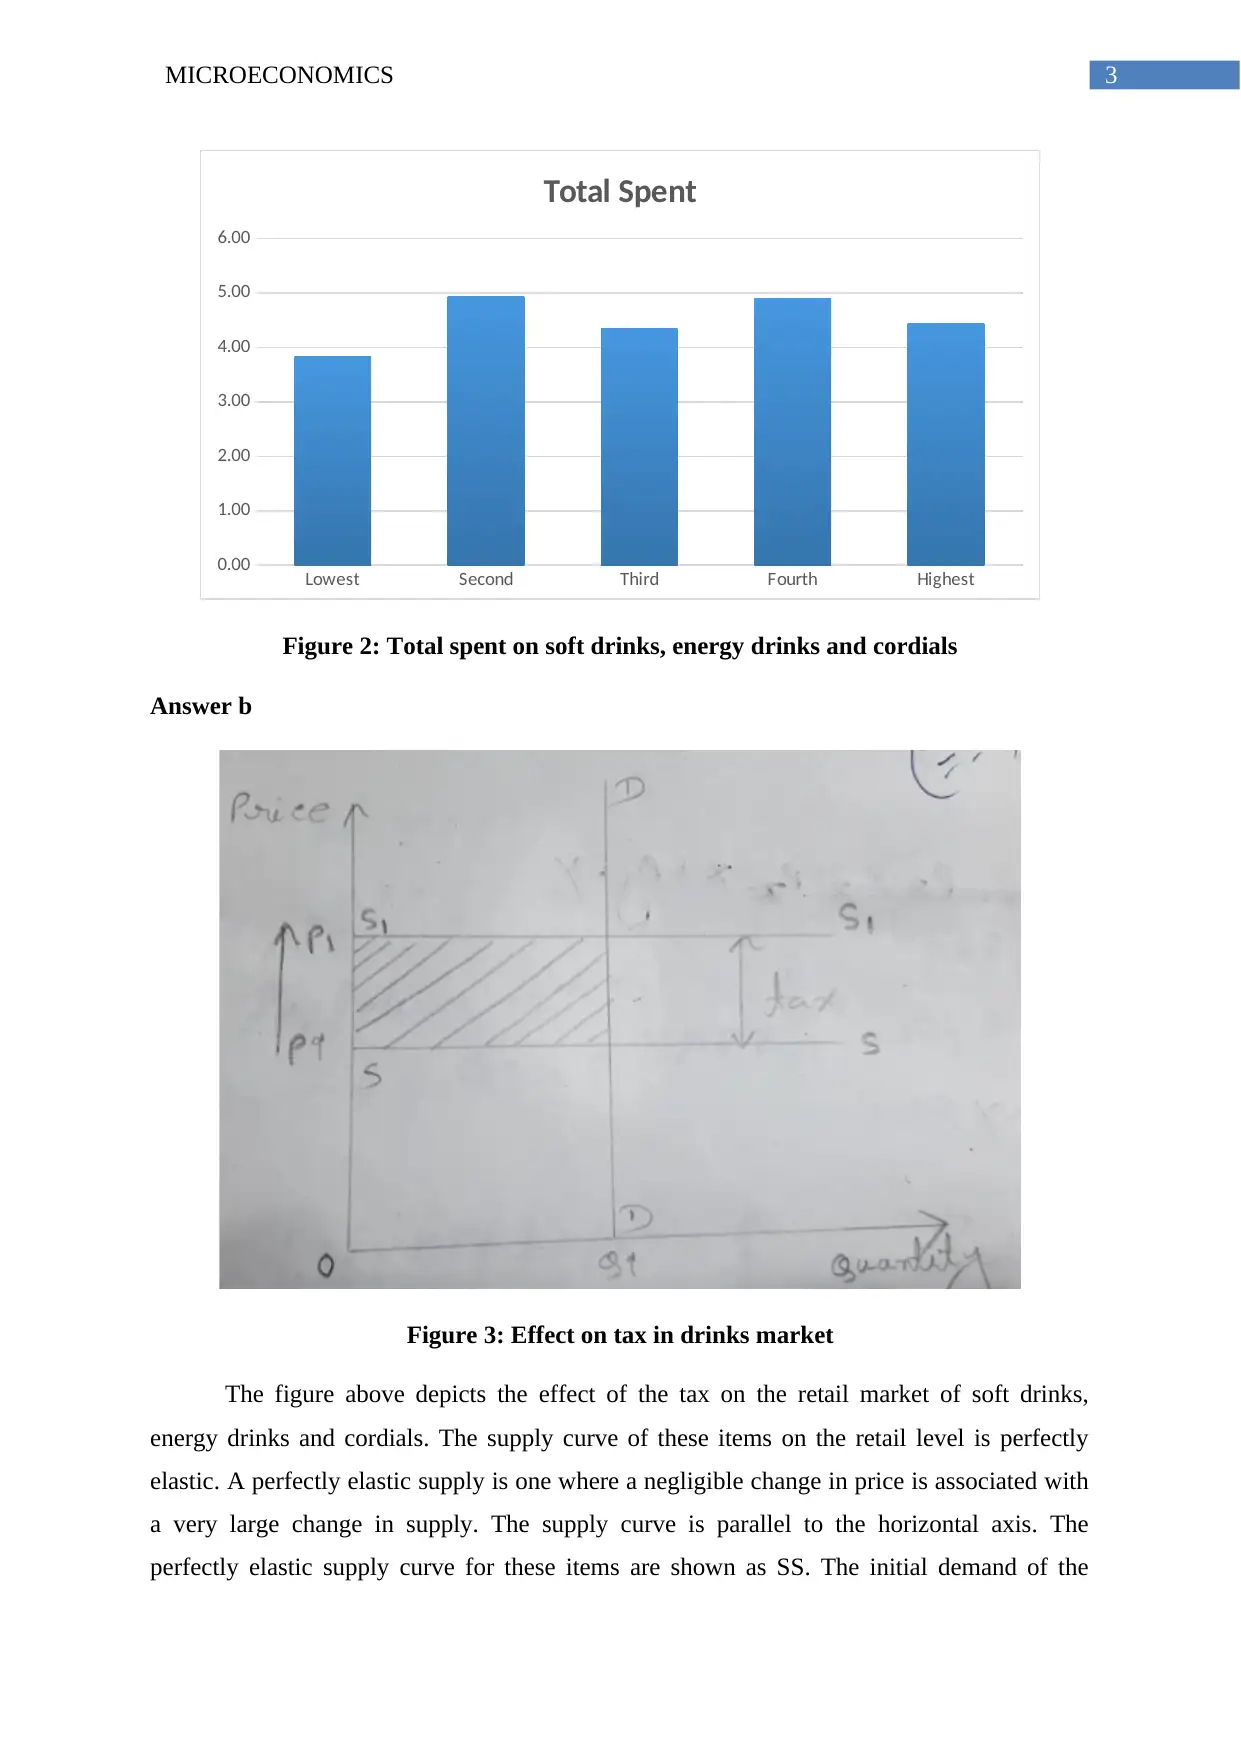
Figure 2: Total spent on soft drinks, energy drinks and cordials
Answer b
Figure 3: Effect on tax in drinks market
The figure above depicts the effect of the tax on the retail market of soft drinks,
energy drinks and cordials. The supply curve of these items on the retail level is perfectly
elastic. A perfectly elastic supply is one where a negligible change in price is associated with
a very large change in supply. The supply curve is parallel to the horizontal axis. The
perfectly elastic supply curve for these items are shown as SS. The initial demand of the
Lowest Second Third Fourth Highest
0.00
1.00
2.00
3.00
4.00
5.00
6.00
Total Spent
Figure 2: Total spent on soft drinks, energy drinks and cordials
Answer b
Figure 3: Effect on tax in drinks market
The figure above depicts the effect of the tax on the retail market of soft drinks,
energy drinks and cordials. The supply curve of these items on the retail level is perfectly
elastic. A perfectly elastic supply is one where a negligible change in price is associated with
a very large change in supply. The supply curve is parallel to the horizontal axis. The
perfectly elastic supply curve for these items are shown as SS. The initial demand of the
Paraphrase This Document
Need a fresh take? Get an instant paraphrase of this document with our AI Paraphraser
4MICROECONOMICS
household is perfectly inelastic. Household facing perfectly inelastic demand curve cannot
change their demand even when price changes (Fine 2016). In this the demand curve is
parallel to the price axis. The perfectly inelastic demand curve is shown as DD. The
equilibrium is obtained at point E. Corresponding equilibrium price is P* and equilibrium
quantity is Q*. Now, imposition of ad valorem tax collected on retailers will shift the supply
curve upwards from SS to S1S1 by the tax rate. The new equilibrium is at E1. Price paid by the
buyers, increases to P1. This is the tax inclusive price.
Answer c
The division of tax burden depends on the elasticity of supply and demand. Higher the
elasticity lower is the tax burden and vice versa. The seller of these items have a perfectly
elastic supply curve meaning supply can change infinitely in response to price (Katz 2016).
Buyers because of inelastic nature of demand cannot reduce their demand. Therefore, sellers
bypass the entire tax burden to buyers.
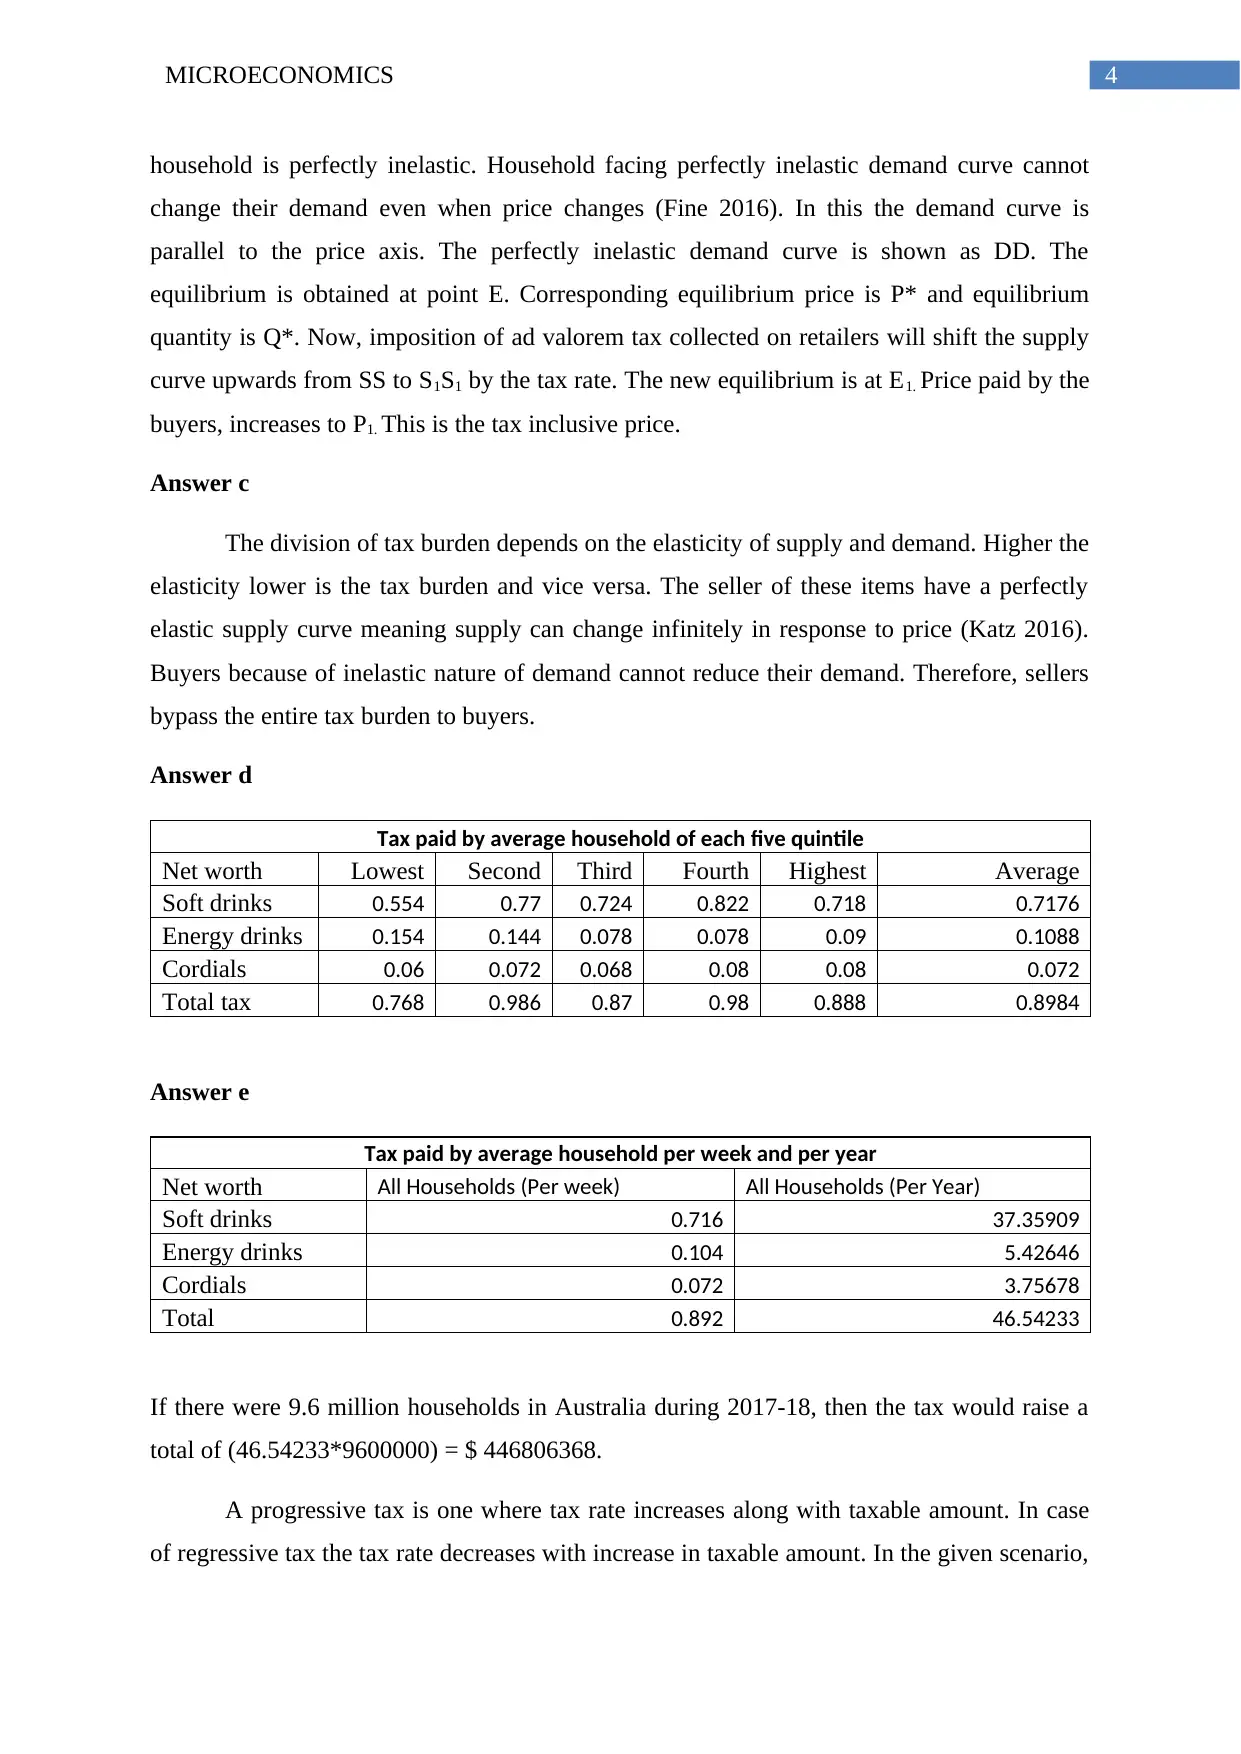
Answer d
Tax paid by average household of each five quintile
Net worth Lowest Second Third Fourth Highest Average
Soft drinks 0.554 0.77 0.724 0.822 0.718 0.7176
Energy drinks 0.154 0.144 0.078 0.078 0.09 0.1088
Cordials 0.06 0.072 0.068 0.08 0.08 0.072
Total tax 0.768 0.986 0.87 0.98 0.888 0.8984
Answer e
Tax paid by average household per week and per year
Net worth All Households (Per week) All Households (Per Year)
Soft drinks 0.716 37.35909
Energy drinks 0.104 5.42646
Cordials 0.072 3.75678
Total 0.892 46.54233
If there were 9.6 million households in Australia during 2017-18, then the tax would raise a
total of (46.54233*9600000) = $ 446806368.
A progressive tax is one where tax rate increases along with taxable amount. In case
of regressive tax the tax rate decreases with increase in taxable amount. In the given scenario,
household is perfectly inelastic. Household facing perfectly inelastic demand curve cannot
change their demand even when price changes (Fine 2016). In this the demand curve is
parallel to the price axis. The perfectly inelastic demand curve is shown as DD. The
equilibrium is obtained at point E. Corresponding equilibrium price is P* and equilibrium
quantity is Q*. Now, imposition of ad valorem tax collected on retailers will shift the supply
curve upwards from SS to S1S1 by the tax rate. The new equilibrium is at E1. Price paid by the
buyers, increases to P1. This is the tax inclusive price.
Answer c
The division of tax burden depends on the elasticity of supply and demand. Higher the
elasticity lower is the tax burden and vice versa. The seller of these items have a perfectly
elastic supply curve meaning supply can change infinitely in response to price (Katz 2016).
Buyers because of inelastic nature of demand cannot reduce their demand. Therefore, sellers
bypass the entire tax burden to buyers.
Answer d
Tax paid by average household of each five quintile
Net worth Lowest Second Third Fourth Highest Average
Soft drinks 0.554 0.77 0.724 0.822 0.718 0.7176
Energy drinks 0.154 0.144 0.078 0.078 0.09 0.1088
Cordials 0.06 0.072 0.068 0.08 0.08 0.072
Total tax 0.768 0.986 0.87 0.98 0.888 0.8984
Answer e
Tax paid by average household per week and per year
Net worth All Households (Per week) All Households (Per Year)
Soft drinks 0.716 37.35909
Energy drinks 0.104 5.42646
Cordials 0.072 3.75678
Total 0.892 46.54233
If there were 9.6 million households in Australia during 2017-18, then the tax would raise a
total of (46.54233*9600000) = $ 446806368.
A progressive tax is one where tax rate increases along with taxable amount. In case
of regressive tax the tax rate decreases with increase in taxable amount. In the given scenario,
5MICROECONOMICS
the tax rate does not alter depending on the level of spending. The rate remains same
irrespective of the taxable amount. Therefore, the tax is proportional.
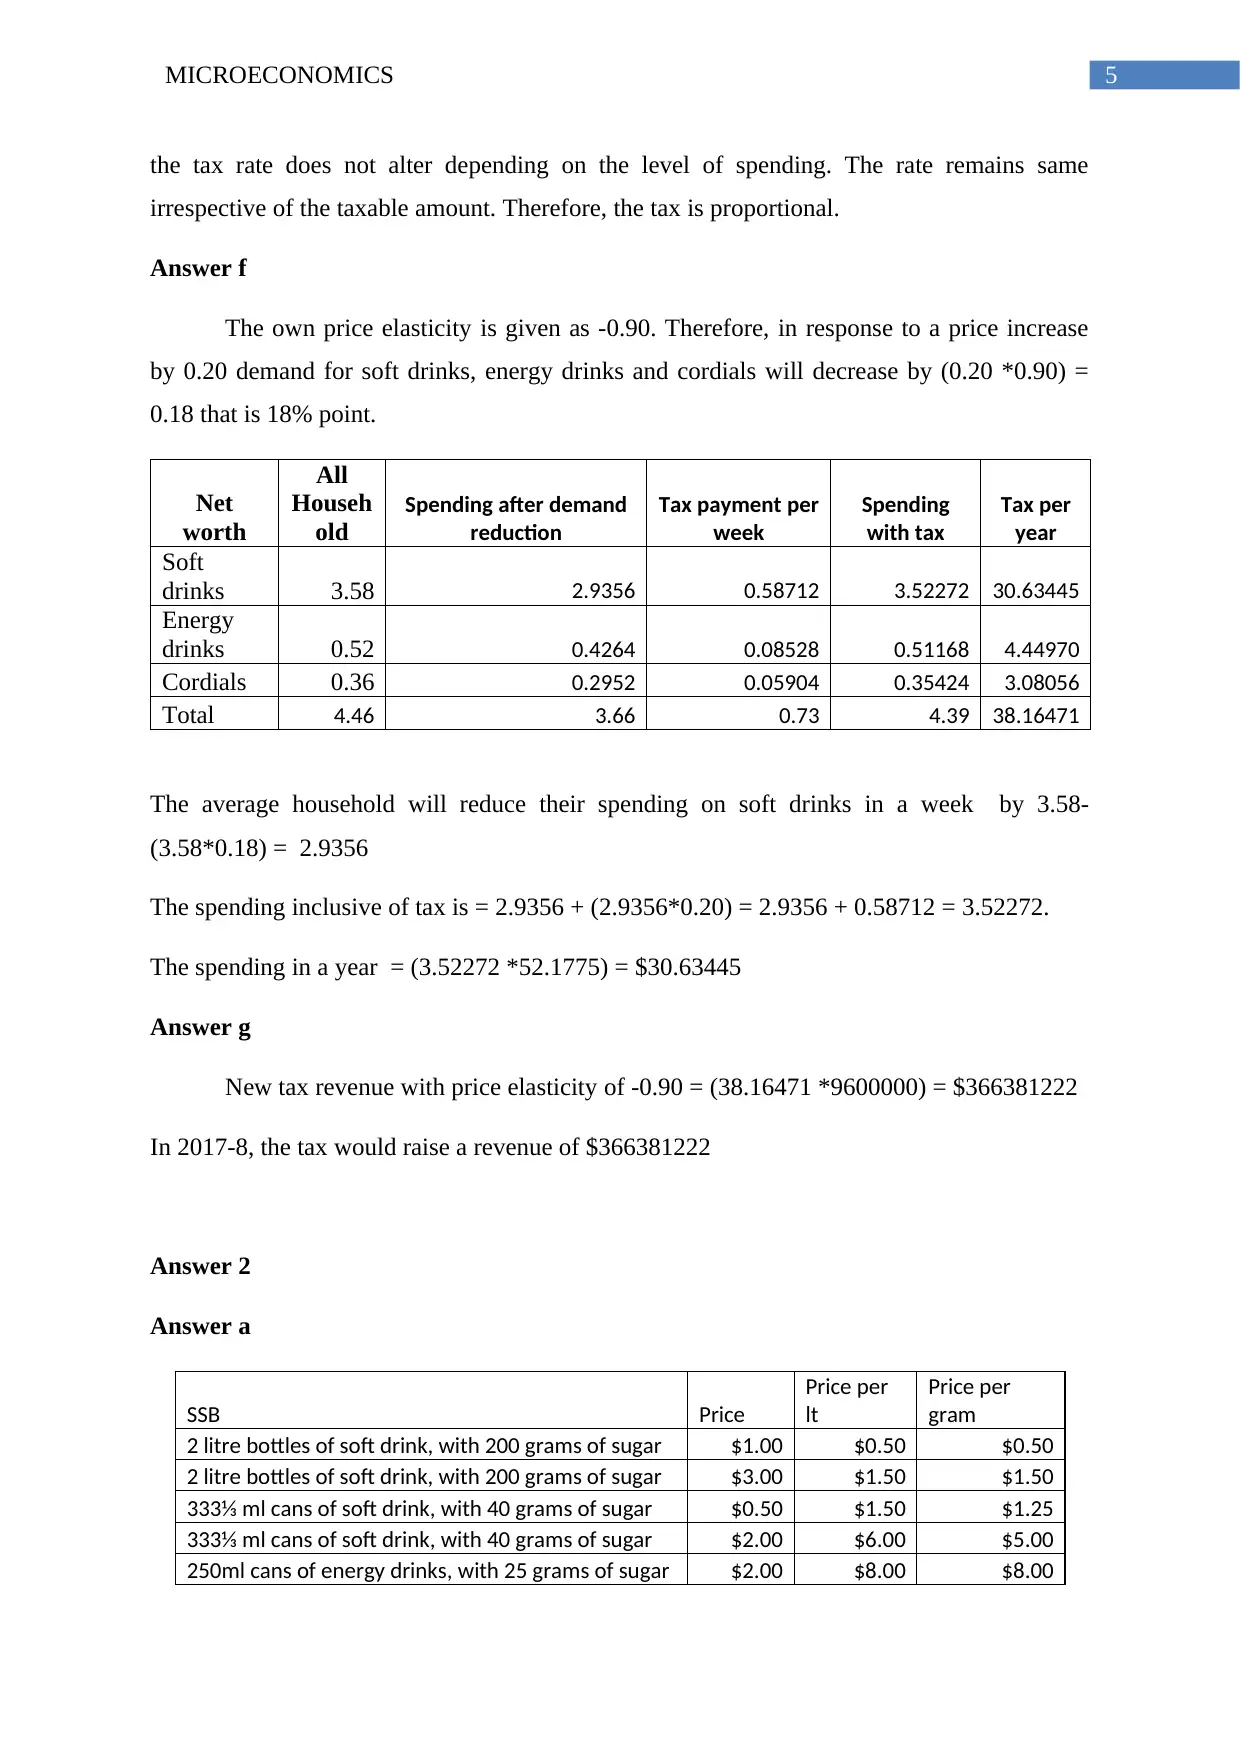
Answer f
The own price elasticity is given as -0.90. Therefore, in response to a price increase
by 0.20 demand for soft drinks, energy drinks and cordials will decrease by (0.20 *0.90) =
0.18 that is 18% point.
Net
worth
All
Househ
old
Spending after demand
reduction
Tax payment per
week
Spending
with tax
Tax per
year
Soft
drinks 3.58 2.9356 0.58712 3.52272 30.63445
Energy
drinks 0.52 0.4264 0.08528 0.51168 4.44970
Cordials 0.36 0.2952 0.05904 0.35424 3.08056
Total 4.46 3.66 0.73 4.39 38.16471
The average household will reduce their spending on soft drinks in a week by 3.58-
(3.58*0.18) = 2.9356
The spending inclusive of tax is = 2.9356 + (2.9356*0.20) = 2.9356 + 0.58712 = 3.52272.
The spending in a year = (3.52272 *52.1775) = $30.63445
Answer g
New tax revenue with price elasticity of -0.90 = (38.16471 *9600000) = $366381222
In 2017-8, the tax would raise a revenue of $366381222
Answer 2
Answer a
SSB Price
Price per
lt
Price per
gram
2 litre bottles of soft drink, with 200 grams of sugar $1.00 $0.50 $0.50
2 litre bottles of soft drink, with 200 grams of sugar $3.00 $1.50 $1.50
333⅓ ml cans of soft drink, with 40 grams of sugar $0.50 $1.50 $1.25
333⅓ ml cans of soft drink, with 40 grams of sugar $2.00 $6.00 $5.00
250ml cans of energy drinks, with 25 grams of sugar $2.00 $8.00 $8.00
the tax rate does not alter depending on the level of spending. The rate remains same
irrespective of the taxable amount. Therefore, the tax is proportional.
Answer f
The own price elasticity is given as -0.90. Therefore, in response to a price increase
by 0.20 demand for soft drinks, energy drinks and cordials will decrease by (0.20 *0.90) =
0.18 that is 18% point.
Net
worth
All
Househ
old
Spending after demand
reduction
Tax payment per
week
Spending
with tax
Tax per
year
Soft
drinks 3.58 2.9356 0.58712 3.52272 30.63445
Energy
drinks 0.52 0.4264 0.08528 0.51168 4.44970
Cordials 0.36 0.2952 0.05904 0.35424 3.08056
Total 4.46 3.66 0.73 4.39 38.16471
The average household will reduce their spending on soft drinks in a week by 3.58-
(3.58*0.18) = 2.9356
The spending inclusive of tax is = 2.9356 + (2.9356*0.20) = 2.9356 + 0.58712 = 3.52272.
The spending in a year = (3.52272 *52.1775) = $30.63445
Answer g
New tax revenue with price elasticity of -0.90 = (38.16471 *9600000) = $366381222
In 2017-8, the tax would raise a revenue of $366381222
Answer 2
Answer a
SSB Price
Price per
lt
Price per
gram
2 litre bottles of soft drink, with 200 grams of sugar $1.00 $0.50 $0.50
2 litre bottles of soft drink, with 200 grams of sugar $3.00 $1.50 $1.50
333⅓ ml cans of soft drink, with 40 grams of sugar $0.50 $1.50 $1.25
333⅓ ml cans of soft drink, with 40 grams of sugar $2.00 $6.00 $5.00
250ml cans of energy drinks, with 25 grams of sugar $2.00 $8.00 $8.00
⊘ This is a preview!⊘
Do you want full access?
Subscribe today to unlock all pages.
Trusted by 1+ million students worldwide
6MICROECONOMICS
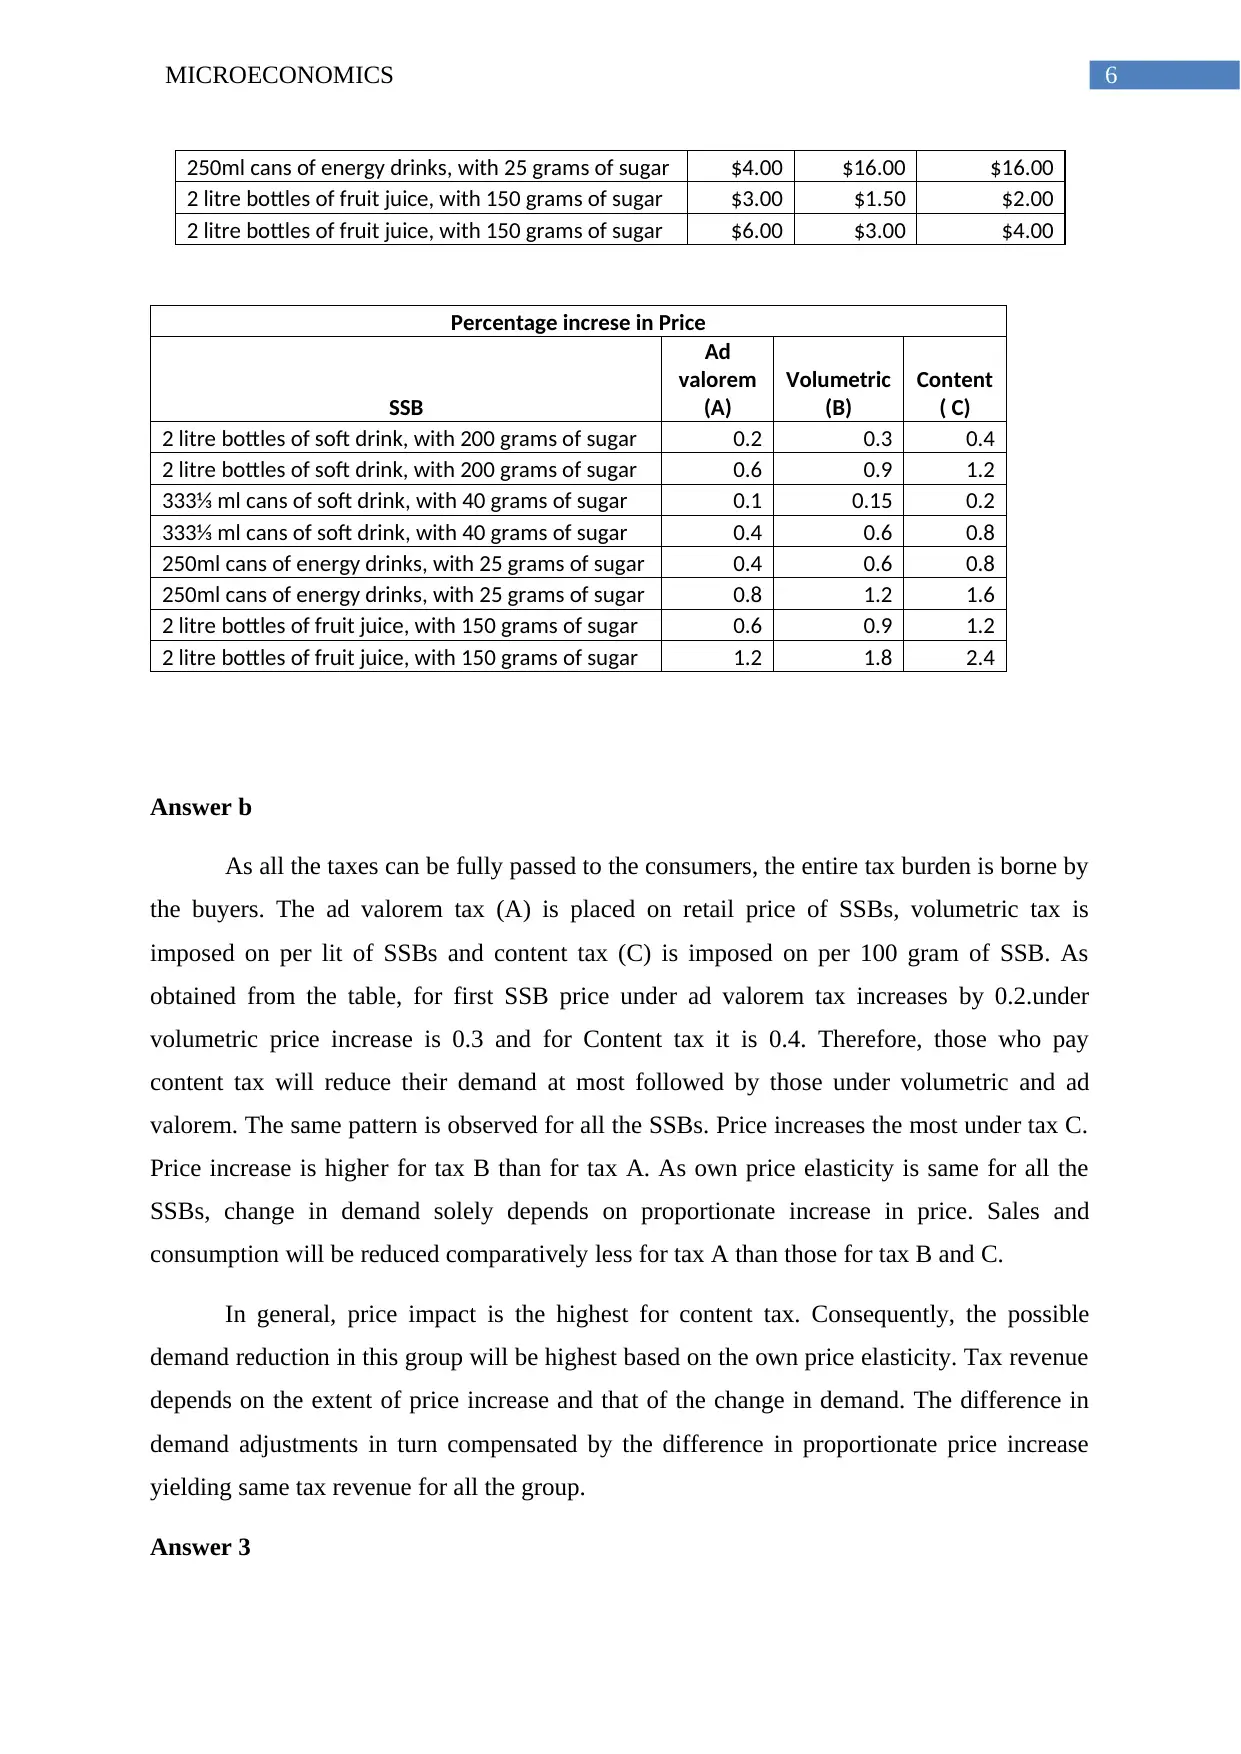
250ml cans of energy drinks, with 25 grams of sugar $4.00 $16.00 $16.00
2 litre bottles of fruit juice, with 150 grams of sugar $3.00 $1.50 $2.00
2 litre bottles of fruit juice, with 150 grams of sugar $6.00 $3.00 $4.00
Percentage increse in Price
SSB
Ad
valorem
(A)
Volumetric
(B)
Content
( C)
2 litre bottles of soft drink, with 200 grams of sugar 0.2 0.3 0.4
2 litre bottles of soft drink, with 200 grams of sugar 0.6 0.9 1.2
333⅓ ml cans of soft drink, with 40 grams of sugar 0.1 0.15 0.2
333⅓ ml cans of soft drink, with 40 grams of sugar 0.4 0.6 0.8
250ml cans of energy drinks, with 25 grams of sugar 0.4 0.6 0.8
250ml cans of energy drinks, with 25 grams of sugar 0.8 1.2 1.6
2 litre bottles of fruit juice, with 150 grams of sugar 0.6 0.9 1.2
2 litre bottles of fruit juice, with 150 grams of sugar 1.2 1.8 2.4
Answer b
As all the taxes can be fully passed to the consumers, the entire tax burden is borne by
the buyers. The ad valorem tax (A) is placed on retail price of SSBs, volumetric tax is
imposed on per lit of SSBs and content tax (C) is imposed on per 100 gram of SSB. As
obtained from the table, for first SSB price under ad valorem tax increases by 0.2.under
volumetric price increase is 0.3 and for Content tax it is 0.4. Therefore, those who pay
content tax will reduce their demand at most followed by those under volumetric and ad
valorem. The same pattern is observed for all the SSBs. Price increases the most under tax C.
Price increase is higher for tax B than for tax A. As own price elasticity is same for all the
SSBs, change in demand solely depends on proportionate increase in price. Sales and
consumption will be reduced comparatively less for tax A than those for tax B and C.
In general, price impact is the highest for content tax. Consequently, the possible
demand reduction in this group will be highest based on the own price elasticity. Tax revenue
depends on the extent of price increase and that of the change in demand. The difference in
demand adjustments in turn compensated by the difference in proportionate price increase
yielding same tax revenue for all the group.
Answer 3
Paraphrase This Document
Need a fresh take? Get an instant paraphrase of this document with our AI Paraphraser
7MICROECONOMICS
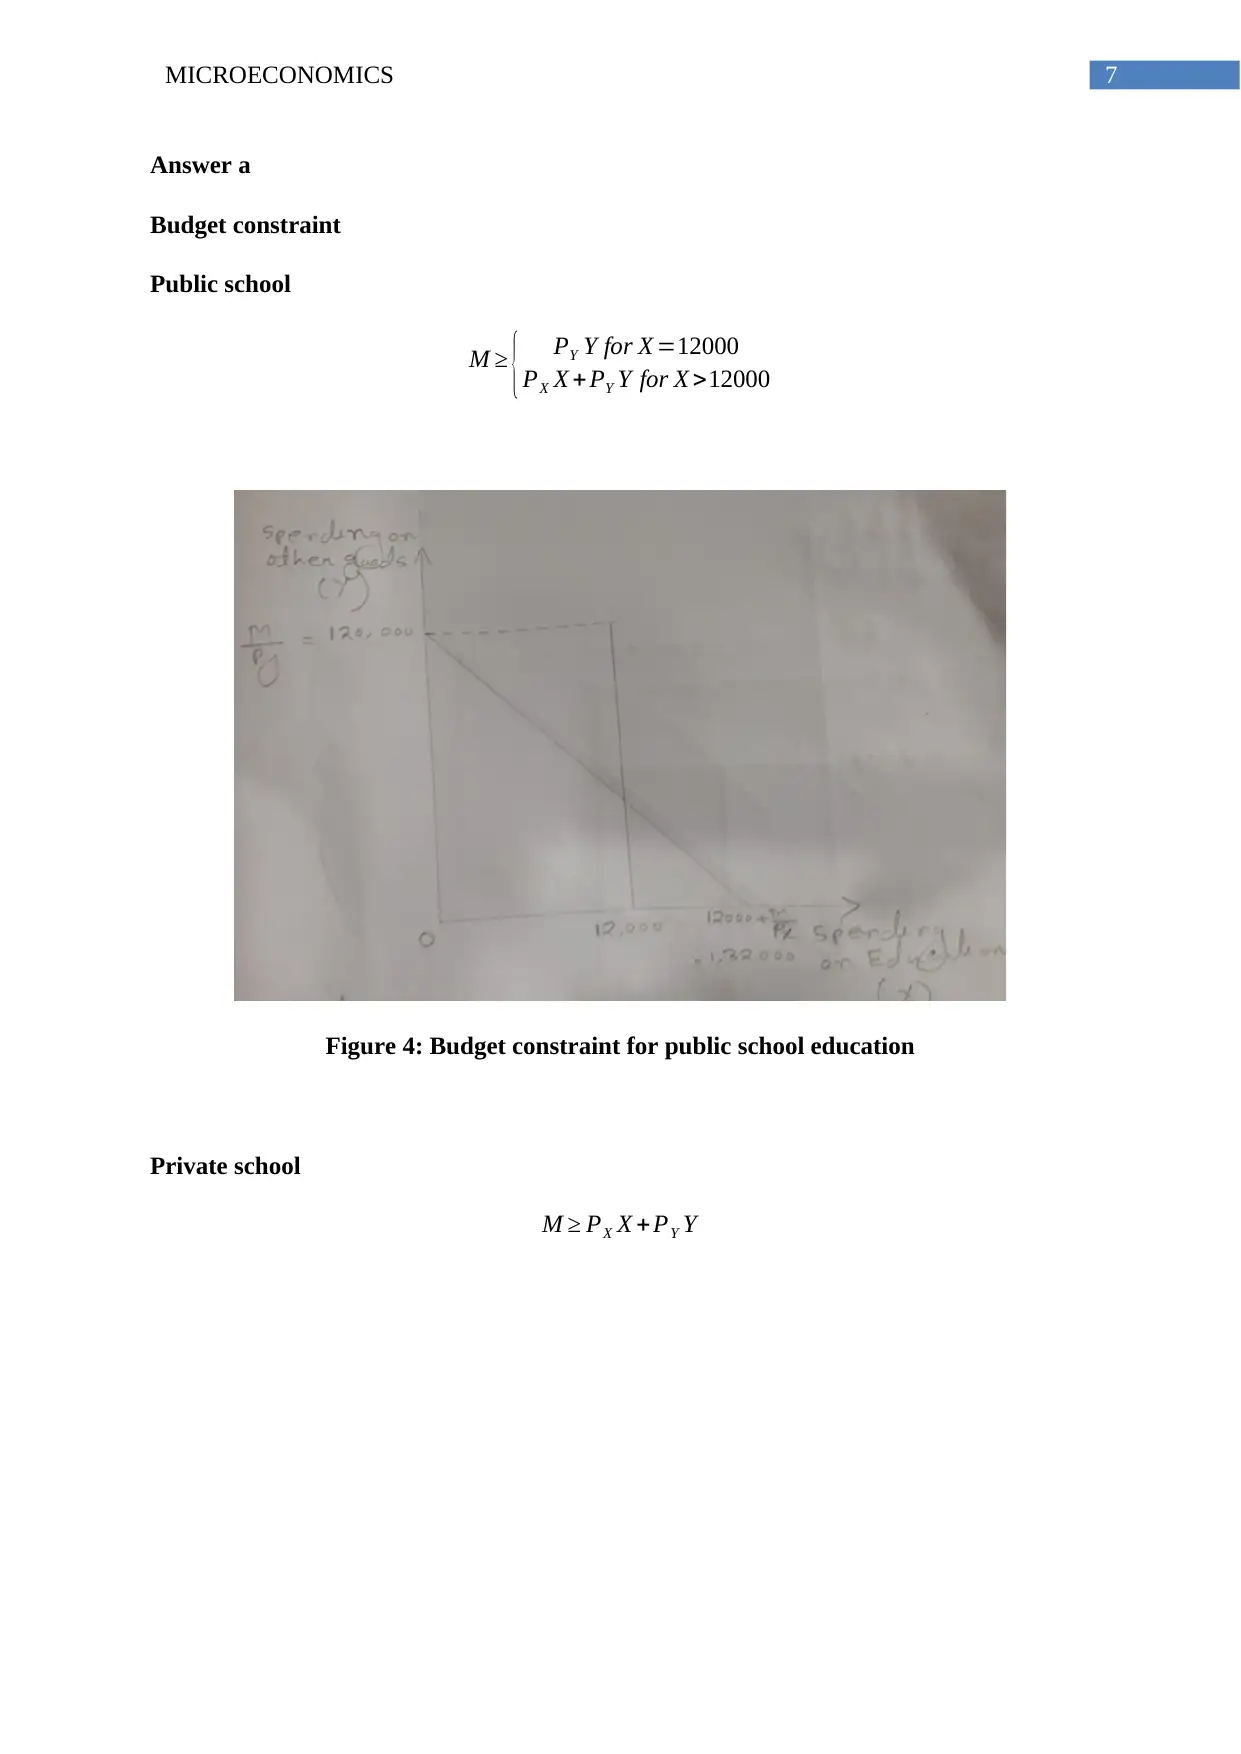
Answer a
Budget constraint
Public school
M ≥ { PY Y for X =12000
PX X + PY Y for X >12000
Figure 4: Budget constraint for public school education
Private school
M ≥ PX X + PY Y
Answer a
Budget constraint
Public school
M ≥ { PY Y for X =12000
PX X + PY Y for X >12000
Figure 4: Budget constraint for public school education
Private school
M ≥ PX X + PY Y

8MICROECONOMICS
Figure 5: Budget constraint with private school education
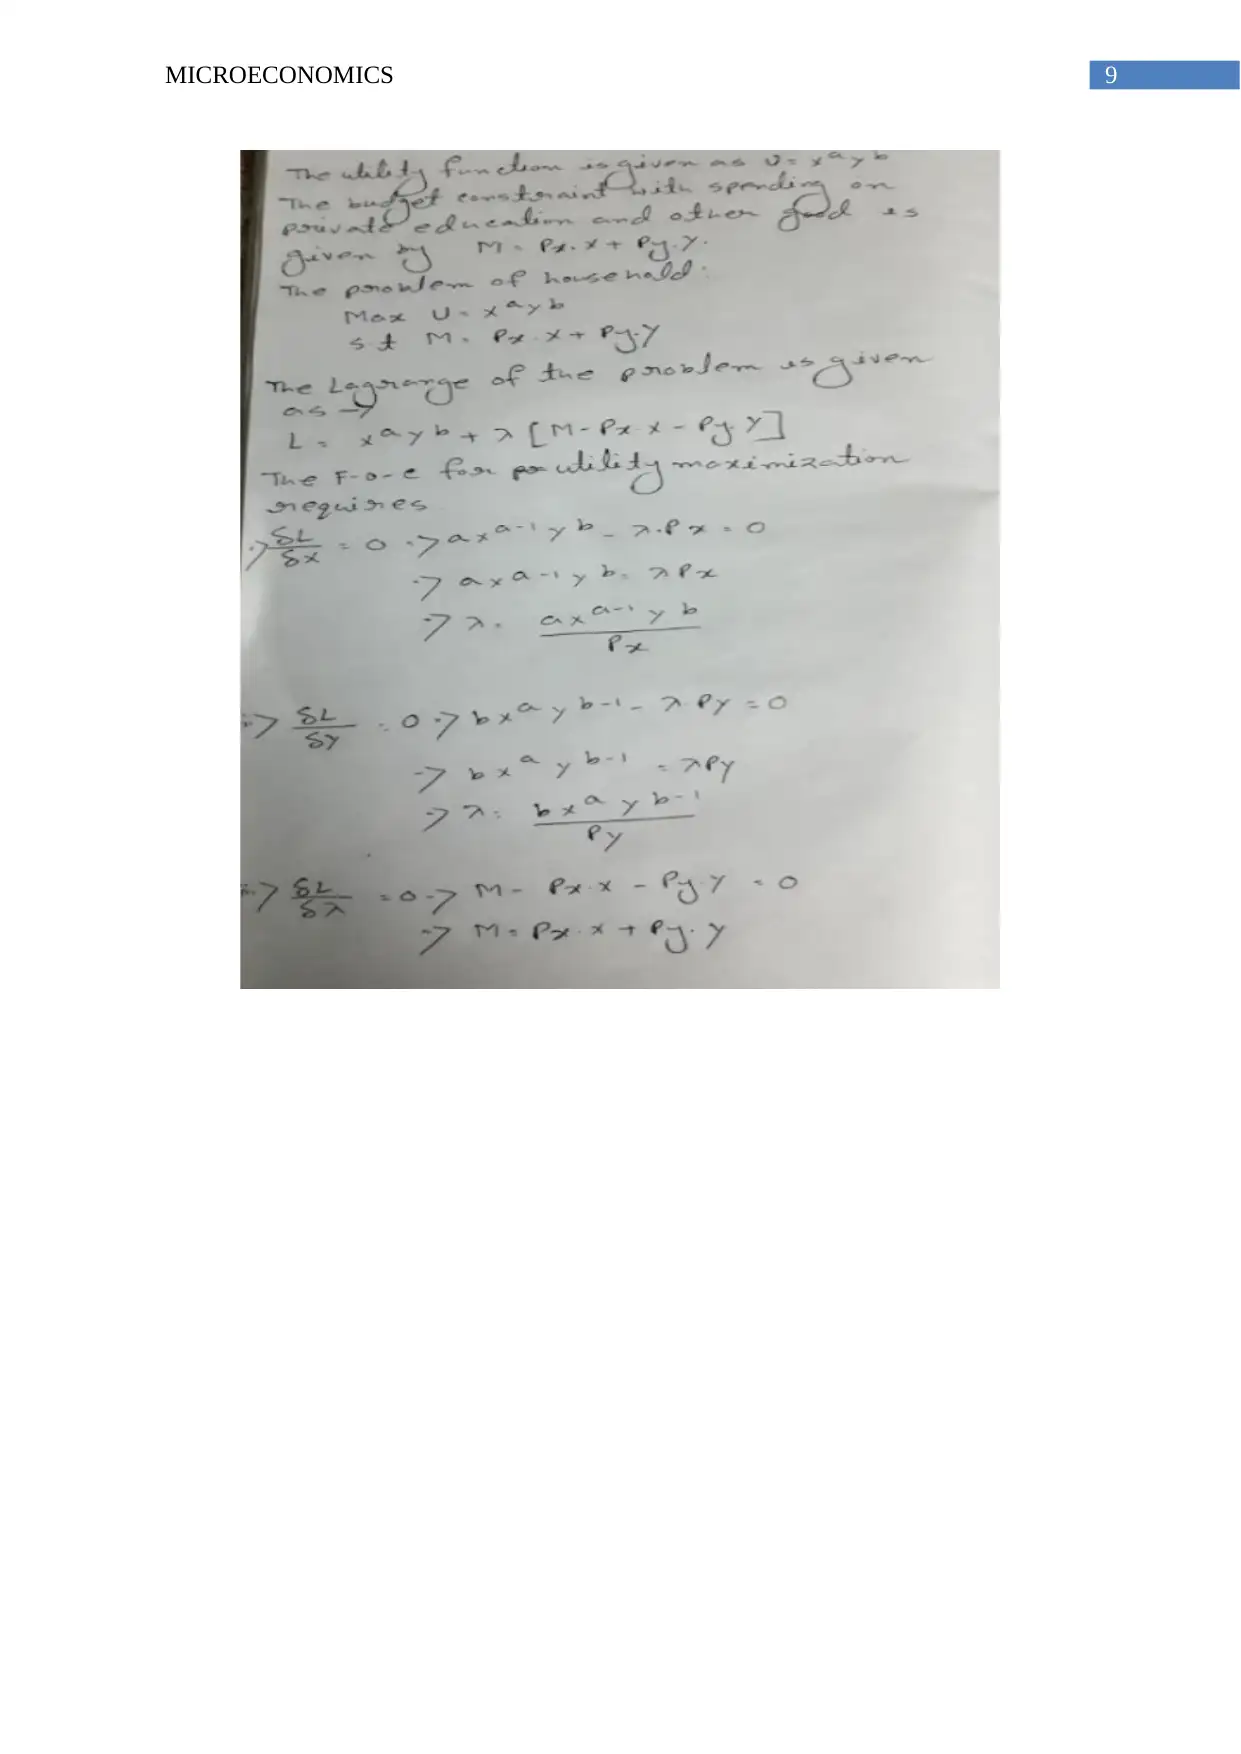
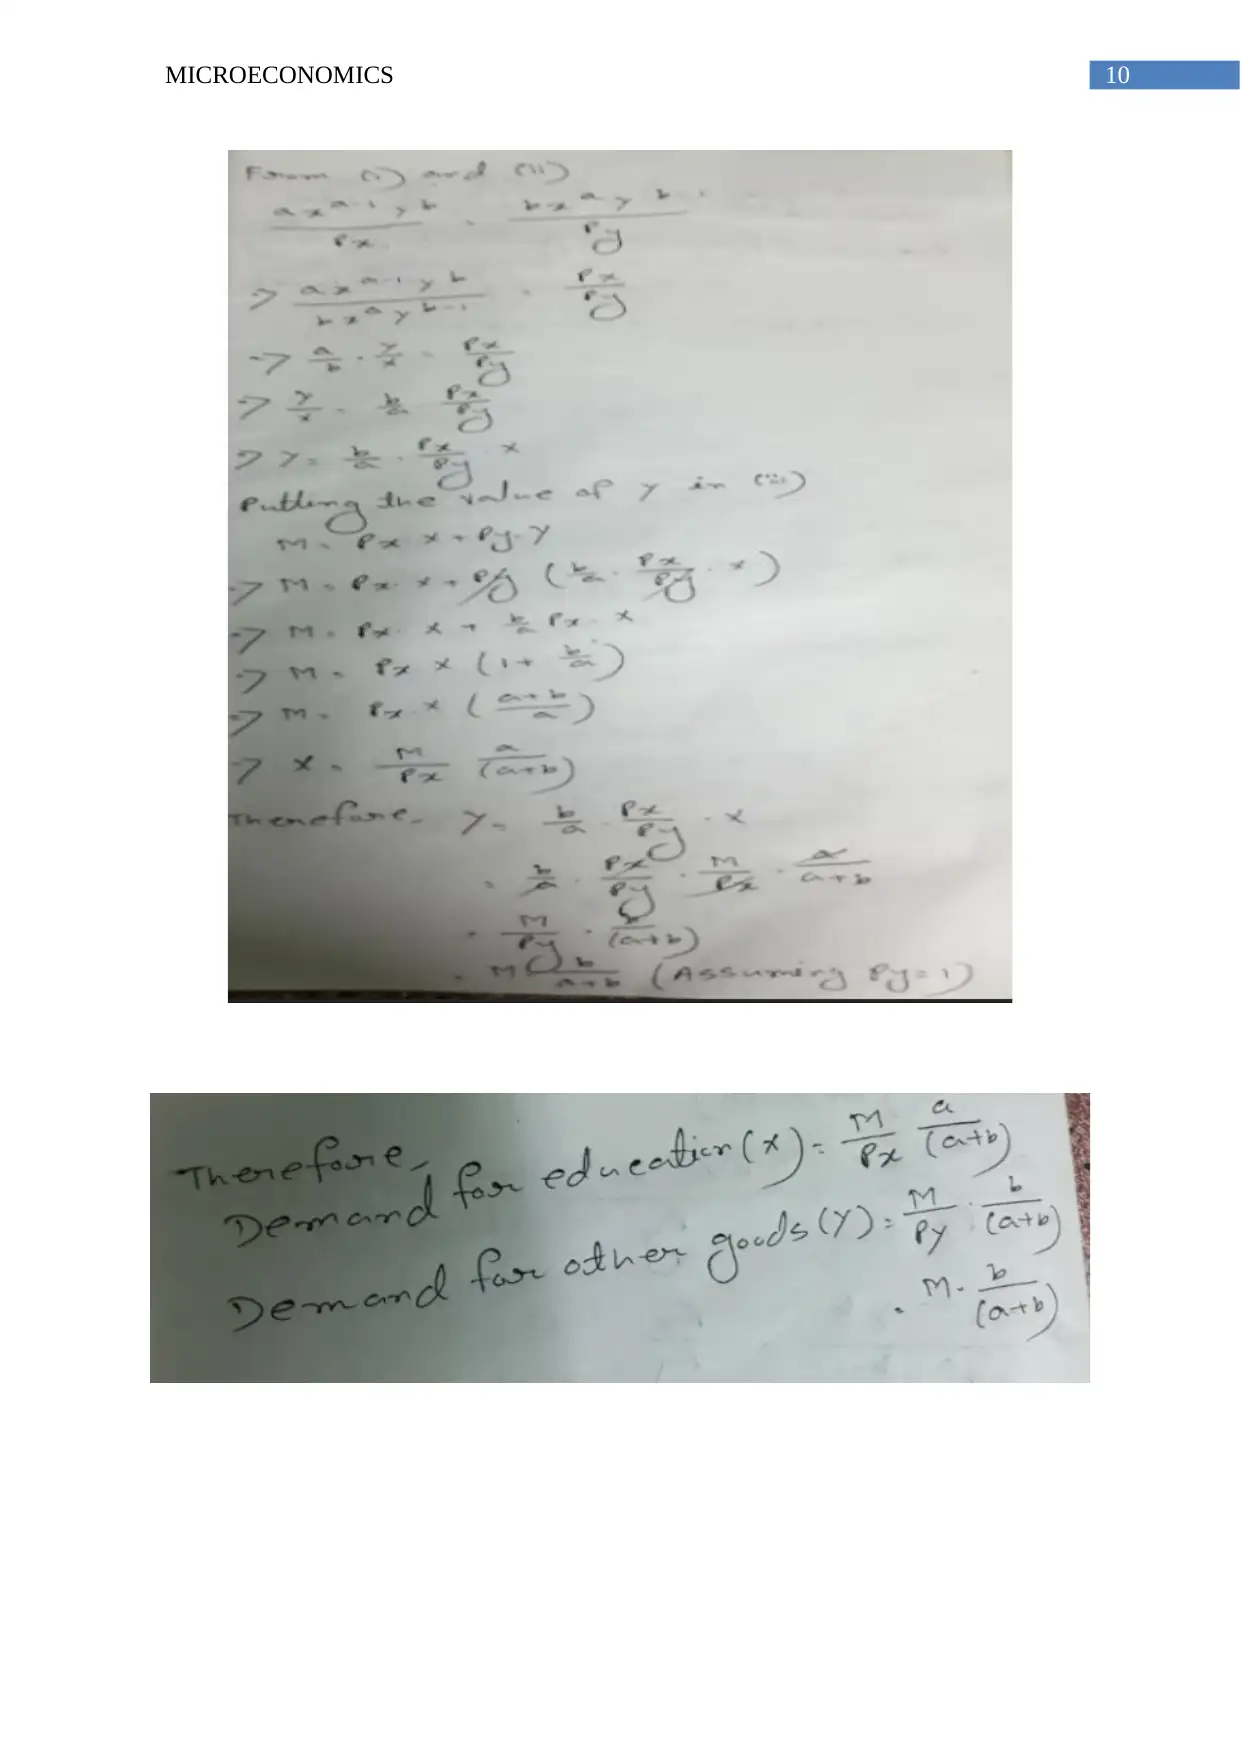
Answer b
Household demand function for private education (X) and other goods (Y)
Figure 5: Budget constraint with private school education
Answer b
Household demand function for private education (X) and other goods (Y)
⊘ This is a preview!⊘
Do you want full access?
Subscribe today to unlock all pages.
Trusted by 1+ million students worldwide
9MICROECONOMICS
Paraphrase This Document
Need a fresh take? Get an instant paraphrase of this document with our AI Paraphraser
10MICROECONOMICS
11MICROECONOMICS
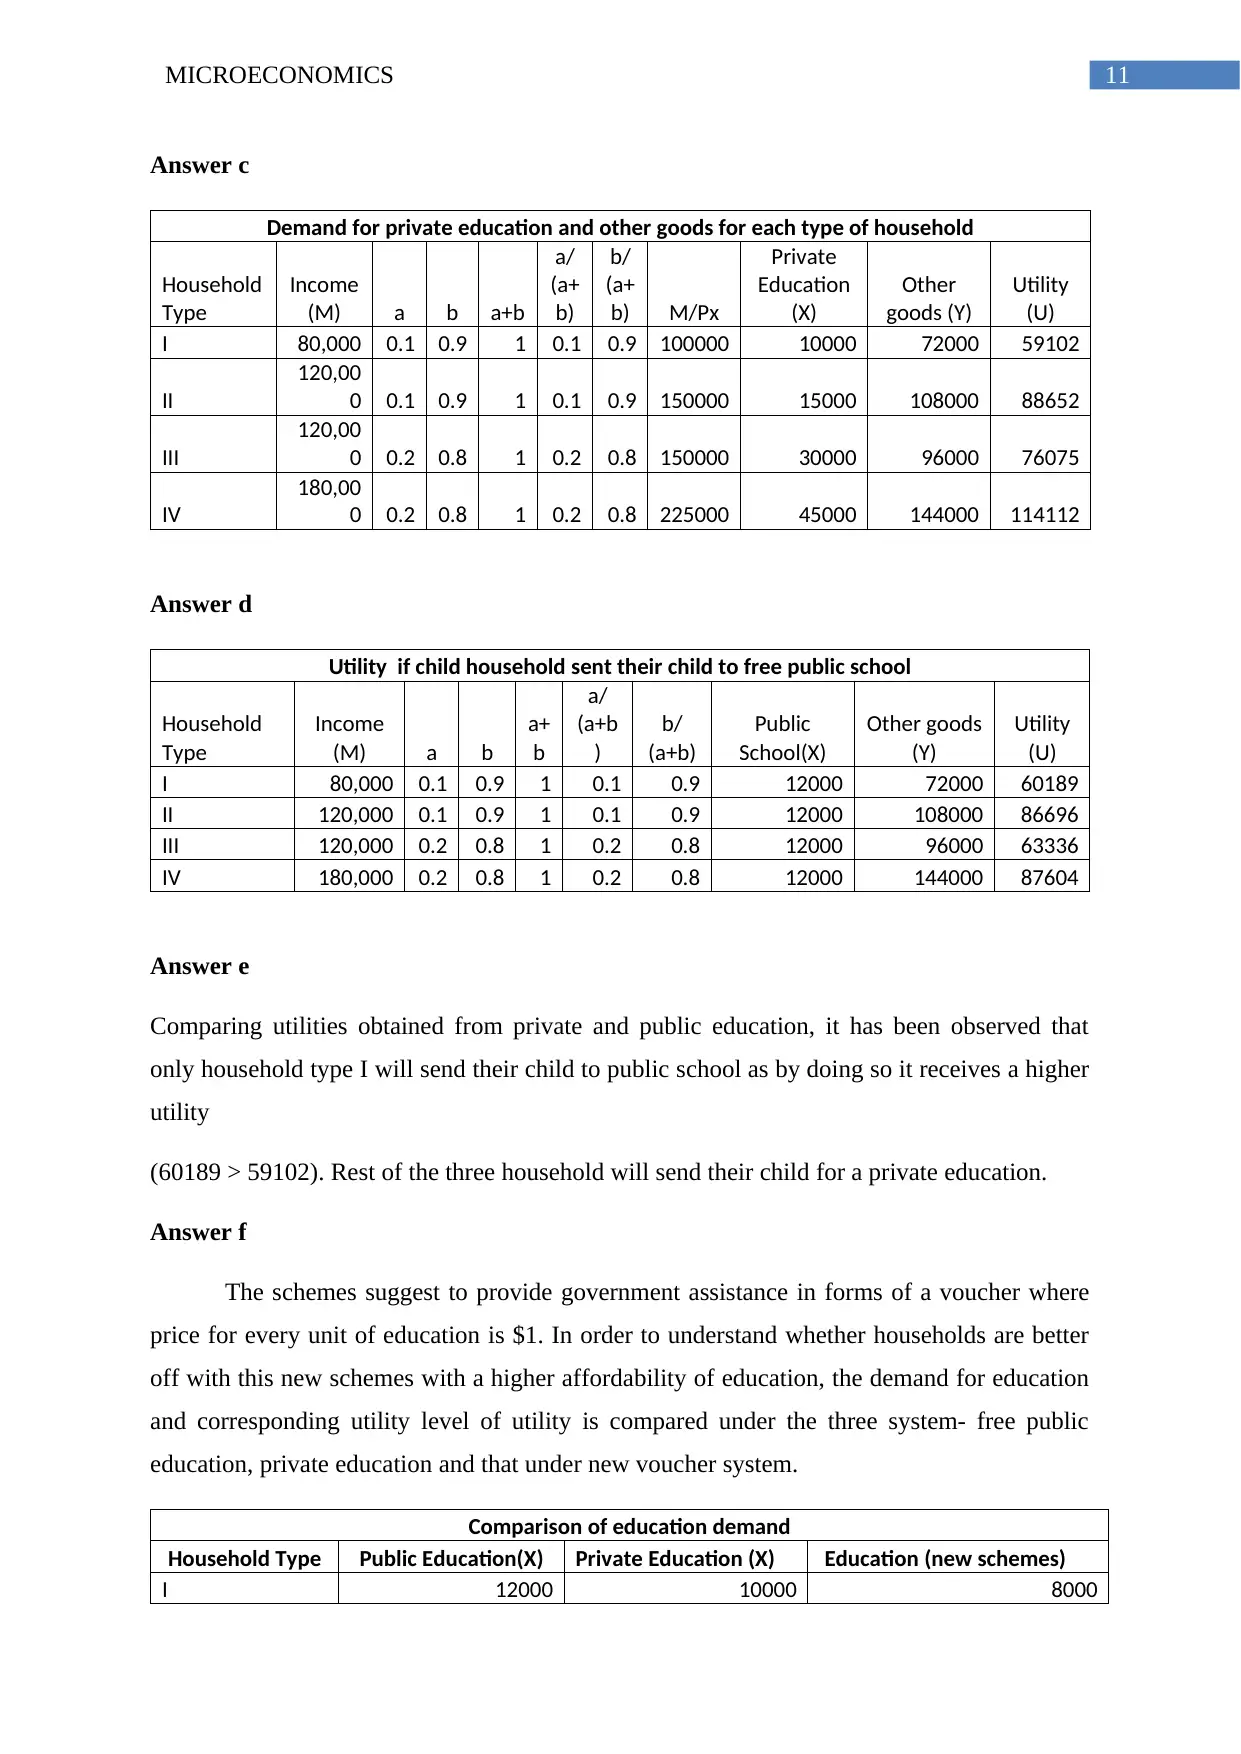
Answer c
Demand for private education and other goods for each type of household
Household
Type
Income
(M) a b a+b
a/
(a+
b)
b/
(a+
b) M/Px
Private
Education
(X)
Other
goods (Y)
Utility
(U)
I 80,000 0.1 0.9 1 0.1 0.9 100000 10000 72000 59102
II
120,00
0 0.1 0.9 1 0.1 0.9 150000 15000 108000 88652
III
120,00
0 0.2 0.8 1 0.2 0.8 150000 30000 96000 76075
IV
180,00
0 0.2 0.8 1 0.2 0.8 225000 45000 144000 114112
Answer d
Utility if child household sent their child to free public school
Household
Type
Income
(M) a b
a+
b
a/
(a+b
)
b/
(a+b)
Public
School(X)
Other goods
(Y)
Utility
(U)
I 80,000 0.1 0.9 1 0.1 0.9 12000 72000 60189
II 120,000 0.1 0.9 1 0.1 0.9 12000 108000 86696
III 120,000 0.2 0.8 1 0.2 0.8 12000 96000 63336
IV 180,000 0.2 0.8 1 0.2 0.8 12000 144000 87604
Answer e
Comparing utilities obtained from private and public education, it has been observed that
only household type I will send their child to public school as by doing so it receives a higher
utility
(60189 > 59102). Rest of the three household will send their child for a private education.
Answer f
The schemes suggest to provide government assistance in forms of a voucher where
price for every unit of education is $1. In order to understand whether households are better
off with this new schemes with a higher affordability of education, the demand for education
and corresponding utility level of utility is compared under the three system- free public
education, private education and that under new voucher system.
Comparison of education demand
Household Type Public Education(X) Private Education (X) Education (new schemes)
I 12000 10000 8000
⊘ This is a preview!⊘
Do you want full access?
Subscribe today to unlock all pages.
Trusted by 1+ million students worldwide
1 out of 22


Your All-in-One AI-Powered Toolkit for Academic Success.
+13062052269
info@desklib.com
Available 24*7 on WhatsApp / Email
![[object Object]](/_next/static/media/star-bottom.7253800d.svg)
Unlock your academic potential
Copyright © 2020–2026 A2Z Services. All Rights Reserved. Developed and managed by ZUCOL.