Business Decision Making Project: Syngenta's Amistar Launch in India
VerifiedAdded on 2020/02/03
|17
|3479
|48
Project
AI Summary
This project delves into the process of business decision-making, using Syngenta's potential launch of Amistar in India as a case study. The project begins with market research, including survey design and sampling frames, to gather primary data on consumer behavior and demand. It then applies various statistical tools, such as mean, mode, median, and measures of dispersion, to analyze the collected data and assess potential expenditures. The analysis extends to correlation coefficients, graphical presentations, and trend line construction to forecast market trends and evaluate sales, costs, and profits. Furthermore, the project incorporates project management techniques, including Gantt charts and network diagrams, to plan and manage the launch of a new warehouse. Finally, the project considers investment appraisal techniques to make informed decisions regarding the expansion, providing a comprehensive approach to business strategy and decision-making.

BUSINESS DECISION
MAKING
MAKING
Paraphrase This Document
Need a fresh take? Get an instant paraphrase of this document with our AI Paraphraser
Table of Contents
INTRODUCTION......................................................................................................................3
TASK 1......................................................................................................................................3
Q.1. Launching of Amistar as well as data collection through survey methodology and
sampling frame..................................................................................................................3
Q.2. Market design survey questionnaire.........................................................................4
TASK 2......................................................................................................................................5
Q.1. Mean, Mode and Median..........................................................................................5
Q.2. Measurement of dispersion.......................................................................................6
Q. 3. Quartile, percentile and correlation coefficient........................................................7
TASK 3......................................................................................................................................8
Q.1. Graphical presentation..............................................................................................8
Q. 2. Constructing trend lines with regression equation.................................................10
TASK 4....................................................................................................................................11
Q.1Preparing a Gantt chart and stating its benefits.........................................................11
Q.2 Network diagram stating the critical path................................................................13
Q.3 Taking appropriate decisions by considering various investment appraisal techniques
.........................................................................................................................................14
CONCLUSION........................................................................................................................16
REFERENCES.........................................................................................................................17
INTRODUCTION
Business decisions making is the process of gathering required data and evaluating
that information through various statistical and financial tools in order to take strategic
decisions (Black, 2011). Syngenta is a world's leading company operating in around 90
countries with the availability of 28000 workers. Its purpose is bringing plant potential to life.
In the present report, importance of business decision making will be discussed in the respect
of Syngenta's success.
TASK 1
Q.1. Launching of Amistar as well as data collection through survey methodology and
sampling frame
Amistar is a fungicide product that makes huge contribution in the integrated pest
management. Currently, Syngenta's director decides to launch Amistar in a new market.
Therefore, India will be an appropriate country for such expansion. It is because that almost
70 percentage of Indian population is engaged in agriculture sector (Bazerman and Moore,
2012).Due to this, there is a great demand of fungicide products for the protection of crops.
Data collection: It is the primary need of decision making process in which researcher
requires to collect both the primary and secondary information. Primary data is also called as
raw data because it is collected by the investigation for the first time and every researcher
needs to collect primary information for their specific objectives. It can be collected through
personal investigation, surveys and other related methods. However, secondary information is
available directly, so investigator does not need to collect it from the market surveys
(Sutherland, 2010). Previous records, articles, trade reports, economic reports, published
government reports, internet, newspaper, books and magazines are the types of secondary
data collection sources.
Survey methodology: It is a way of primary data collection in which investigator of
Syngenta can conduct market surveys in order to gather required information. It is the best
way of collecting information about consumer behaviour, their preferences and future
demand of Amistar in India (Kline, 2010). Questionnaire is an effective tool in which
researcher can design various open and close ended questions for collecting necessary data as
well as information.
Sampling frame: It is not possible for Syngenta's manager to study the whole Indian
market. Hence, he can use sampling frame in which investigator can construct an adequate
⊘ This is a preview!⊘
Do you want full access?
Subscribe today to unlock all pages.
Trusted by 1+ million students worldwide
size of sample through combining all the characteristics of universe. Thereafter, information
can be collected by communicating with respondents who are considered as a sample for the
study. Thus, it minimizes the cost of data collection and saves time.
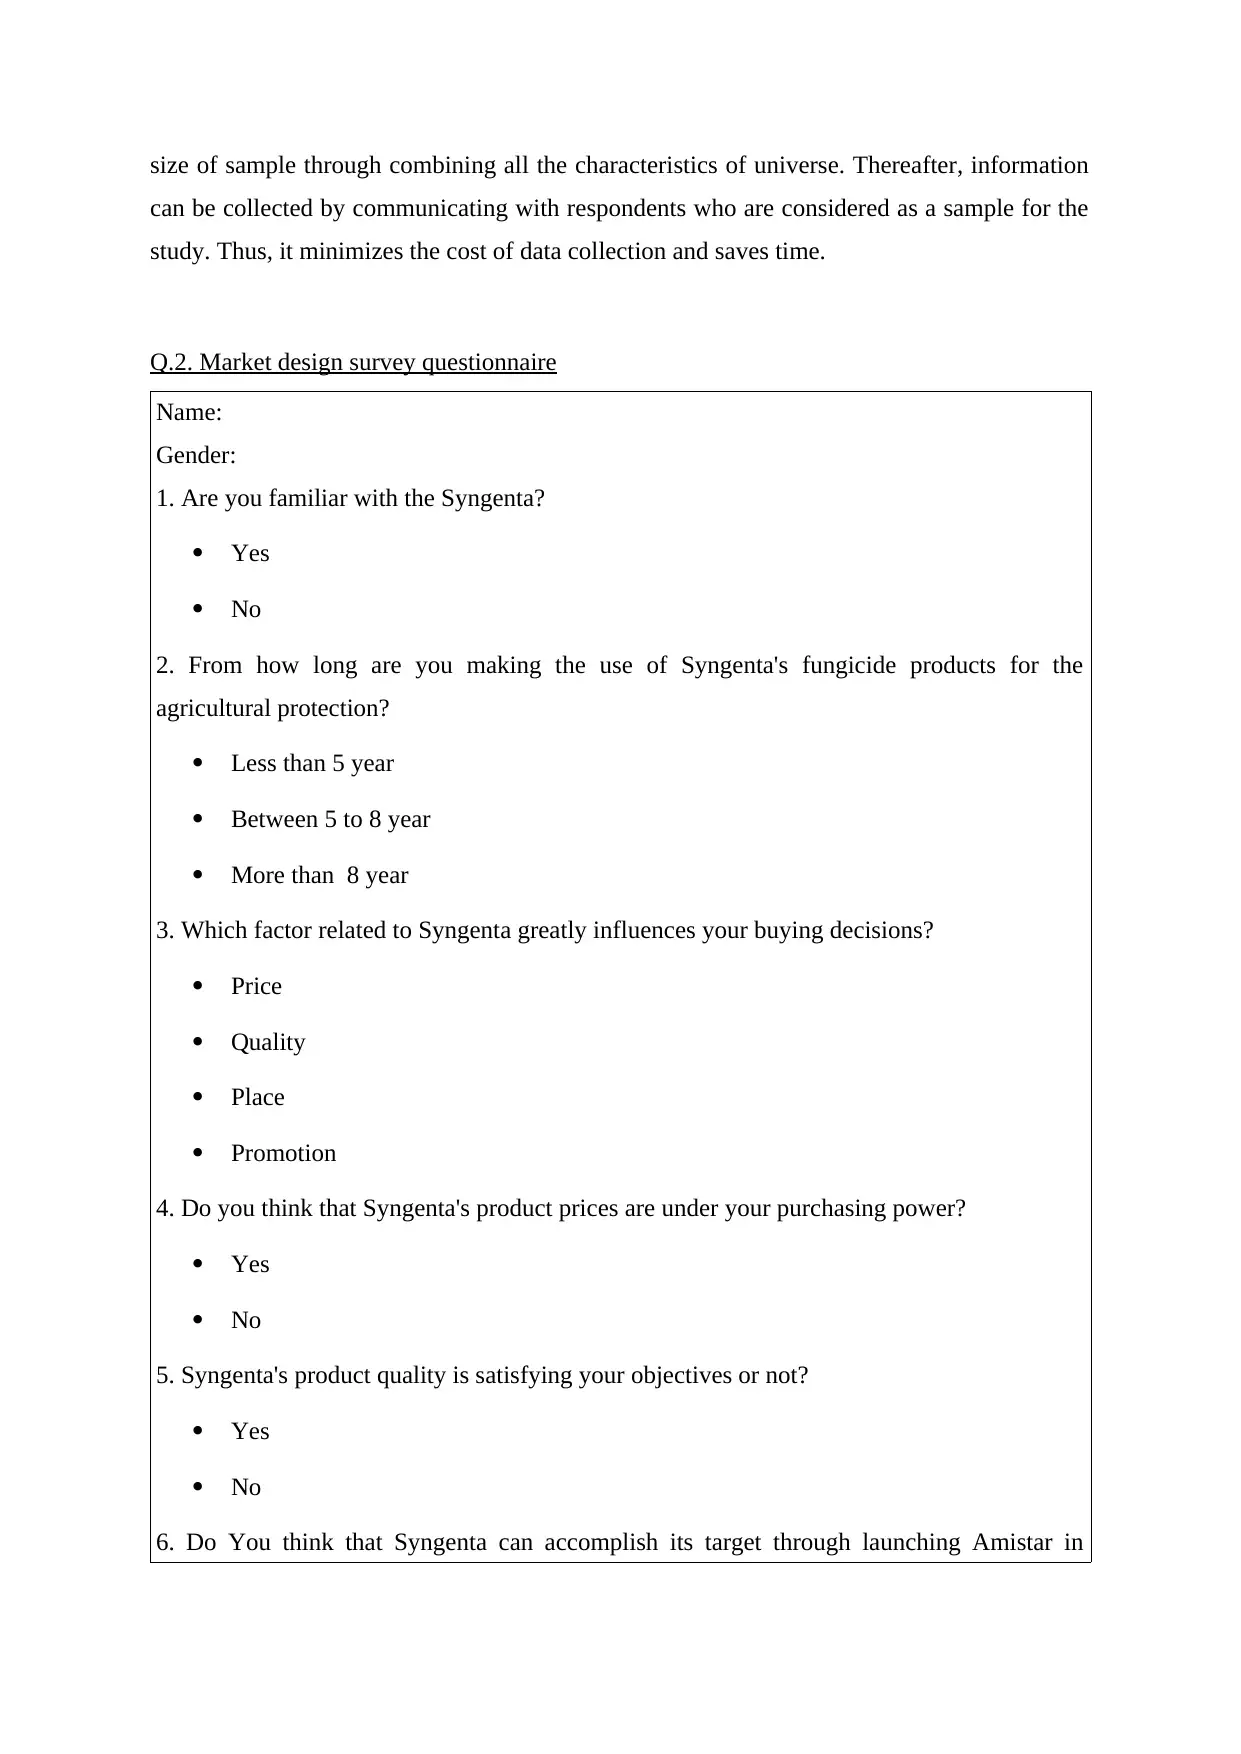
Q.2. Market design survey questionnaire
Name:
Gender:
1. Are you familiar with the Syngenta?
Yes
No
2. From how long are you making the use of Syngenta's fungicide products for the
agricultural protection?
Less than 5 year
Between 5 to 8 year
More than 8 year
3. Which factor related to Syngenta greatly influences your buying decisions?
Price
Quality
Place
Promotion
4. Do you think that Syngenta's product prices are under your purchasing power?
Yes
No
5. Syngenta's product quality is satisfying your objectives or not?
Yes
No
6. Do You think that Syngenta can accomplish its target through launching Amistar in
can be collected by communicating with respondents who are considered as a sample for the
study. Thus, it minimizes the cost of data collection and saves time.
Q.2. Market design survey questionnaire
Name:
Gender:
1. Are you familiar with the Syngenta?
Yes
No
2. From how long are you making the use of Syngenta's fungicide products for the
agricultural protection?
Less than 5 year
Between 5 to 8 year
More than 8 year
3. Which factor related to Syngenta greatly influences your buying decisions?
Price
Quality
Place
Promotion
4. Do you think that Syngenta's product prices are under your purchasing power?
Yes
No
5. Syngenta's product quality is satisfying your objectives or not?
Yes
No
6. Do You think that Syngenta can accomplish its target through launching Amistar in
Paraphrase This Document
Need a fresh take? Get an instant paraphrase of this document with our AI Paraphraser
India?
Yes
No
7. Do you want to give any suggestion or recommendation for improving the performance of
business?
Please specify_______________________________________________________
TASK 2
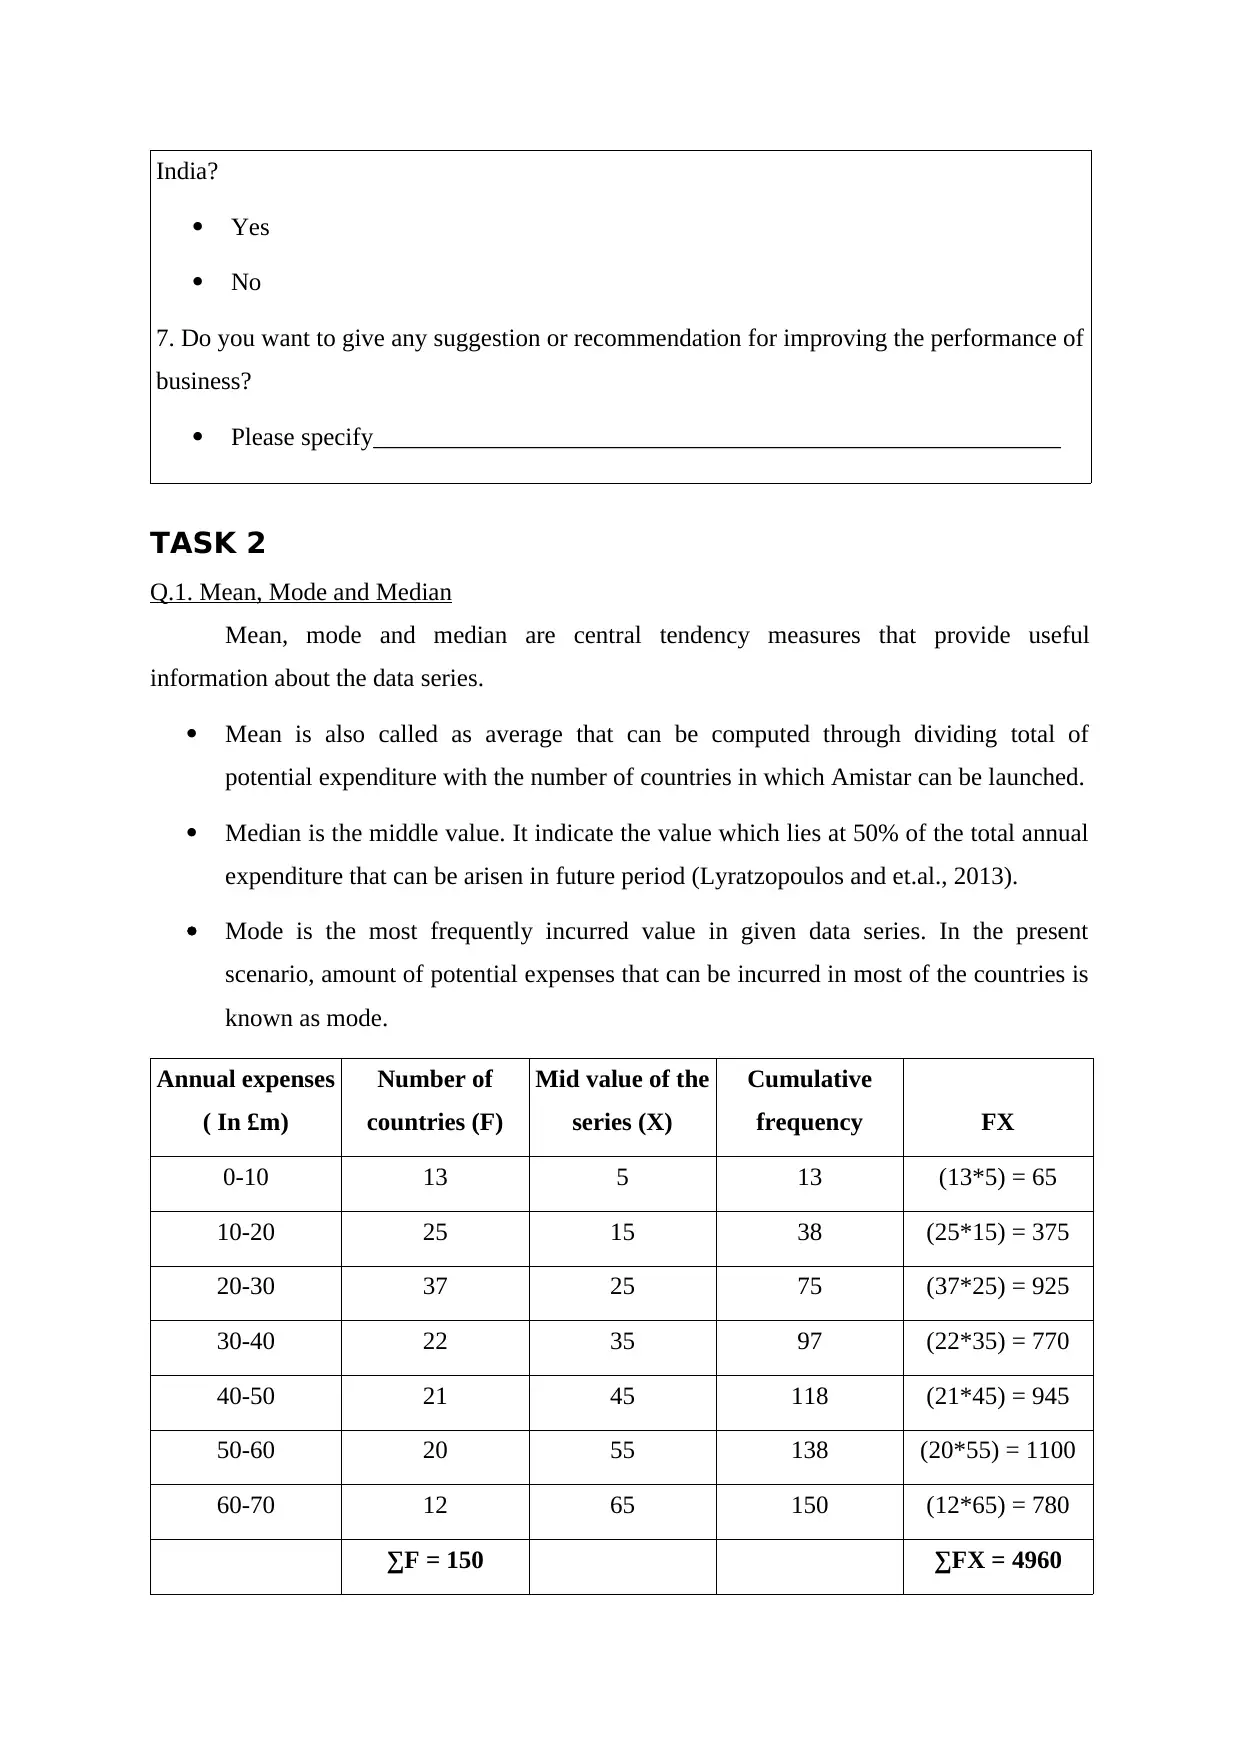
Q.1. Mean, Mode and Median
Mean, mode and median are central tendency measures that provide useful
information about the data series.
Mean is also called as average that can be computed through dividing total of
potential expenditure with the number of countries in which Amistar can be launched.
Median is the middle value. It indicate the value which lies at 50% of the total annual
expenditure that can be arisen in future period (Lyratzopoulos and et.al., 2013).
Mode is the most frequently incurred value in given data series. In the present
scenario, amount of potential expenses that can be incurred in most of the countries is
known as mode.
Annual expenses
( In £m)
Number of
countries (F)
Mid value of the
series (X)
Cumulative
frequency FX
0-10 13 5 13 (13*5) = 65
10-20 25 15 38 (25*15) = 375
20-30 37 25 75 (37*25) = 925
30-40 22 35 97 (22*35) = 770
40-50 21 45 118 (21*45) = 945
50-60 20 55 138 (20*55) = 1100
60-70 12 65 150 (12*65) = 780
∑F = 150 ∑FX = 4960
Yes
No
7. Do you want to give any suggestion or recommendation for improving the performance of
business?
Please specify_______________________________________________________
TASK 2
Q.1. Mean, Mode and Median
Mean, mode and median are central tendency measures that provide useful
information about the data series.
Mean is also called as average that can be computed through dividing total of
potential expenditure with the number of countries in which Amistar can be launched.
Median is the middle value. It indicate the value which lies at 50% of the total annual
expenditure that can be arisen in future period (Lyratzopoulos and et.al., 2013).
Mode is the most frequently incurred value in given data series. In the present
scenario, amount of potential expenses that can be incurred in most of the countries is
known as mode.
Annual expenses
( In £m)
Number of
countries (F)
Mid value of the
series (X)
Cumulative
frequency FX
0-10 13 5 13 (13*5) = 65
10-20 25 15 38 (25*15) = 375
20-30 37 25 75 (37*25) = 925
30-40 22 35 97 (22*35) = 770
40-50 21 45 118 (21*45) = 945
50-60 20 55 138 (20*55) = 1100
60-70 12 65 150 (12*65) = 780
∑F = 150 ∑FX = 4960
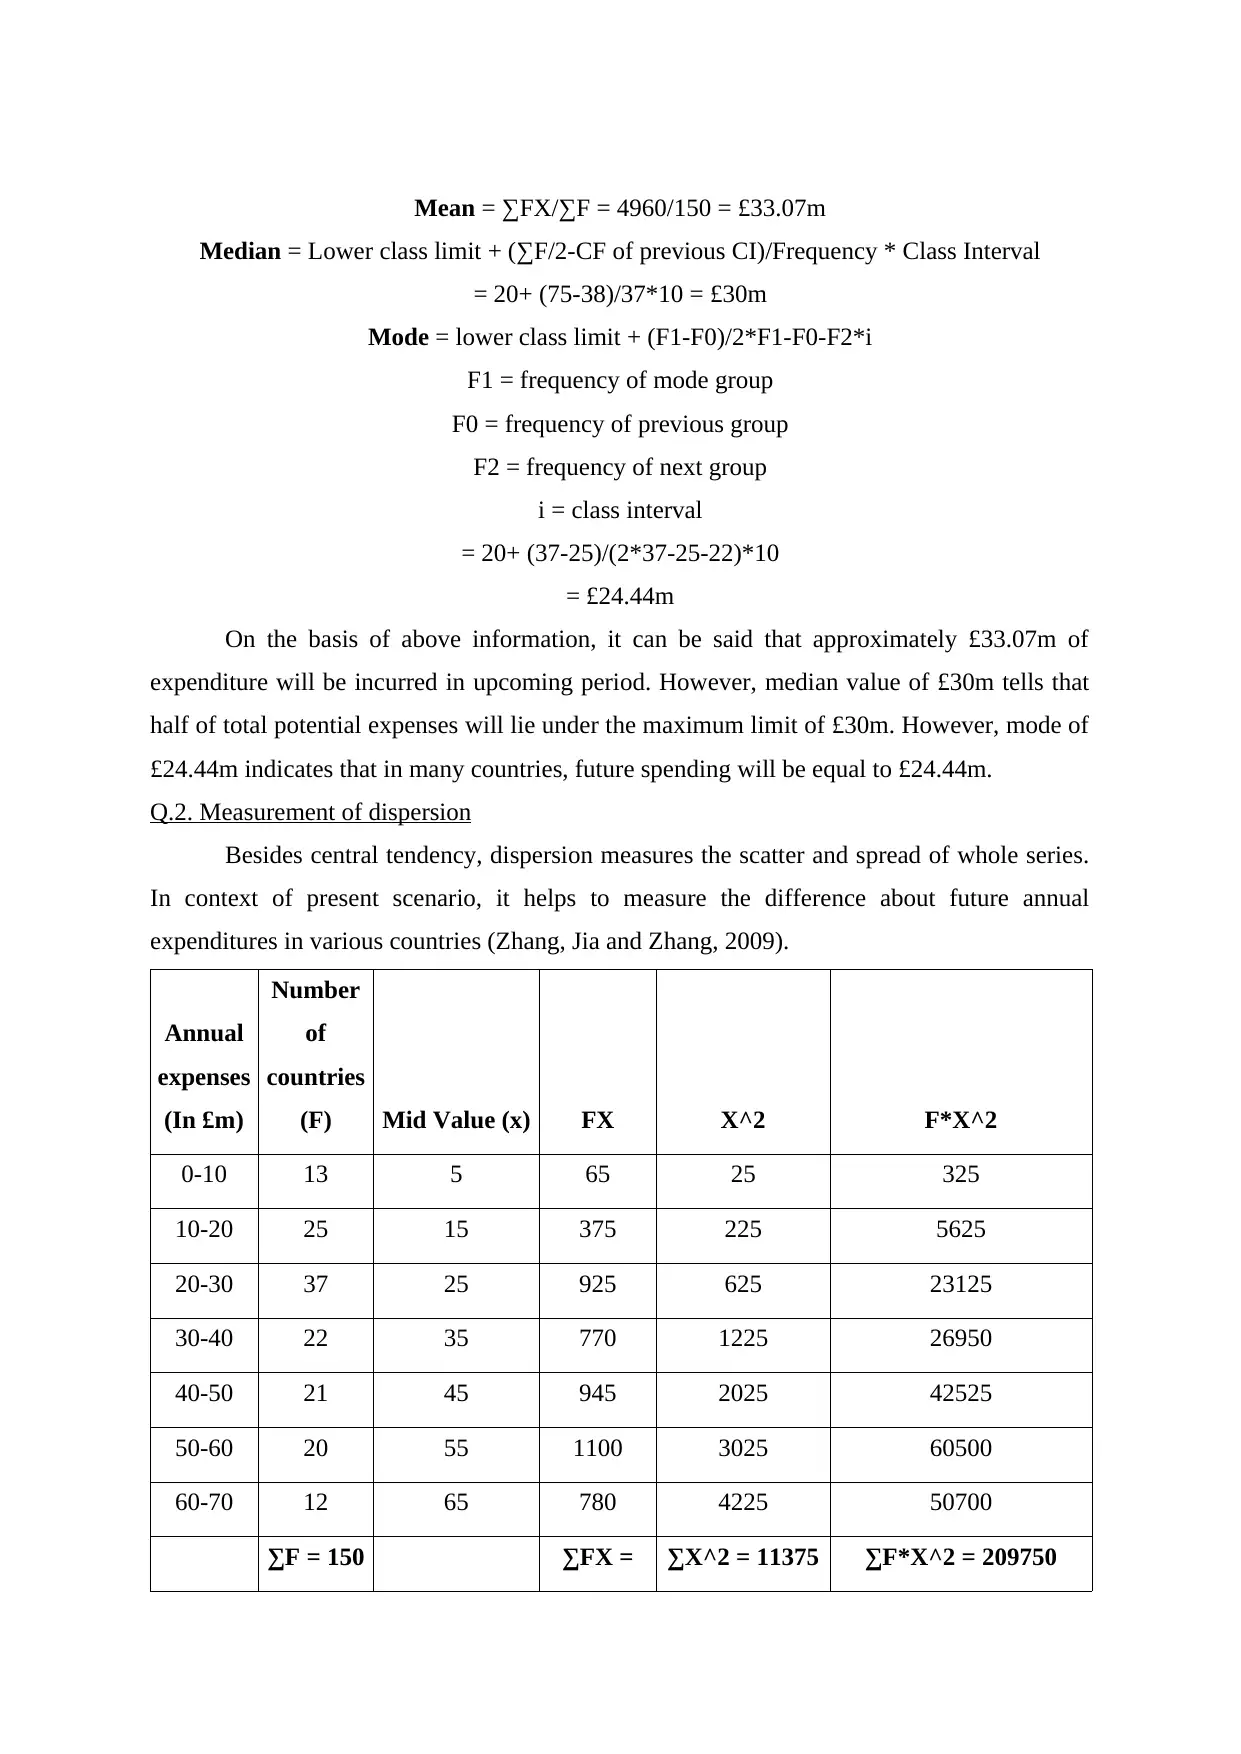
Mean = ∑FX/∑F = 4960/150 = £33.07m
Median = Lower class limit + (∑F/2-CF of previous CI)/Frequency * Class Interval
= 20+ (75-38)/37*10 = £30m
Mode = lower class limit + (F1-F0)/2*F1-F0-F2*i
F1 = frequency of mode group
F0 = frequency of previous group
F2 = frequency of next group
i = class interval
= 20+ (37-25)/(2*37-25-22)*10
= £24.44m
On the basis of above information, it can be said that approximately £33.07m of
expenditure will be incurred in upcoming period. However, median value of £30m tells that
half of total potential expenses will lie under the maximum limit of £30m. However, mode of
£24.44m indicates that in many countries, future spending will be equal to £24.44m.
Q.2. Measurement of dispersion
Besides central tendency, dispersion measures the scatter and spread of whole series.
In context of present scenario, it helps to measure the difference about future annual
expenditures in various countries (Zhang, Jia and Zhang, 2009).
Annual
expenses
(In £m)
Number
of
countries
(F) Mid Value (x) FX X^2 F*X^2
0-10 13 5 65 25 325
10-20 25 15 375 225 5625
20-30 37 25 925 625 23125
30-40 22 35 770 1225 26950
40-50 21 45 945 2025 42525
50-60 20 55 1100 3025 60500
60-70 12 65 780 4225 50700
∑F = 150 ∑FX = ∑X^2 = 11375 ∑F*X^2 = 209750
⊘ This is a preview!⊘
Do you want full access?
Subscribe today to unlock all pages.
Trusted by 1+ million students worldwide
4960
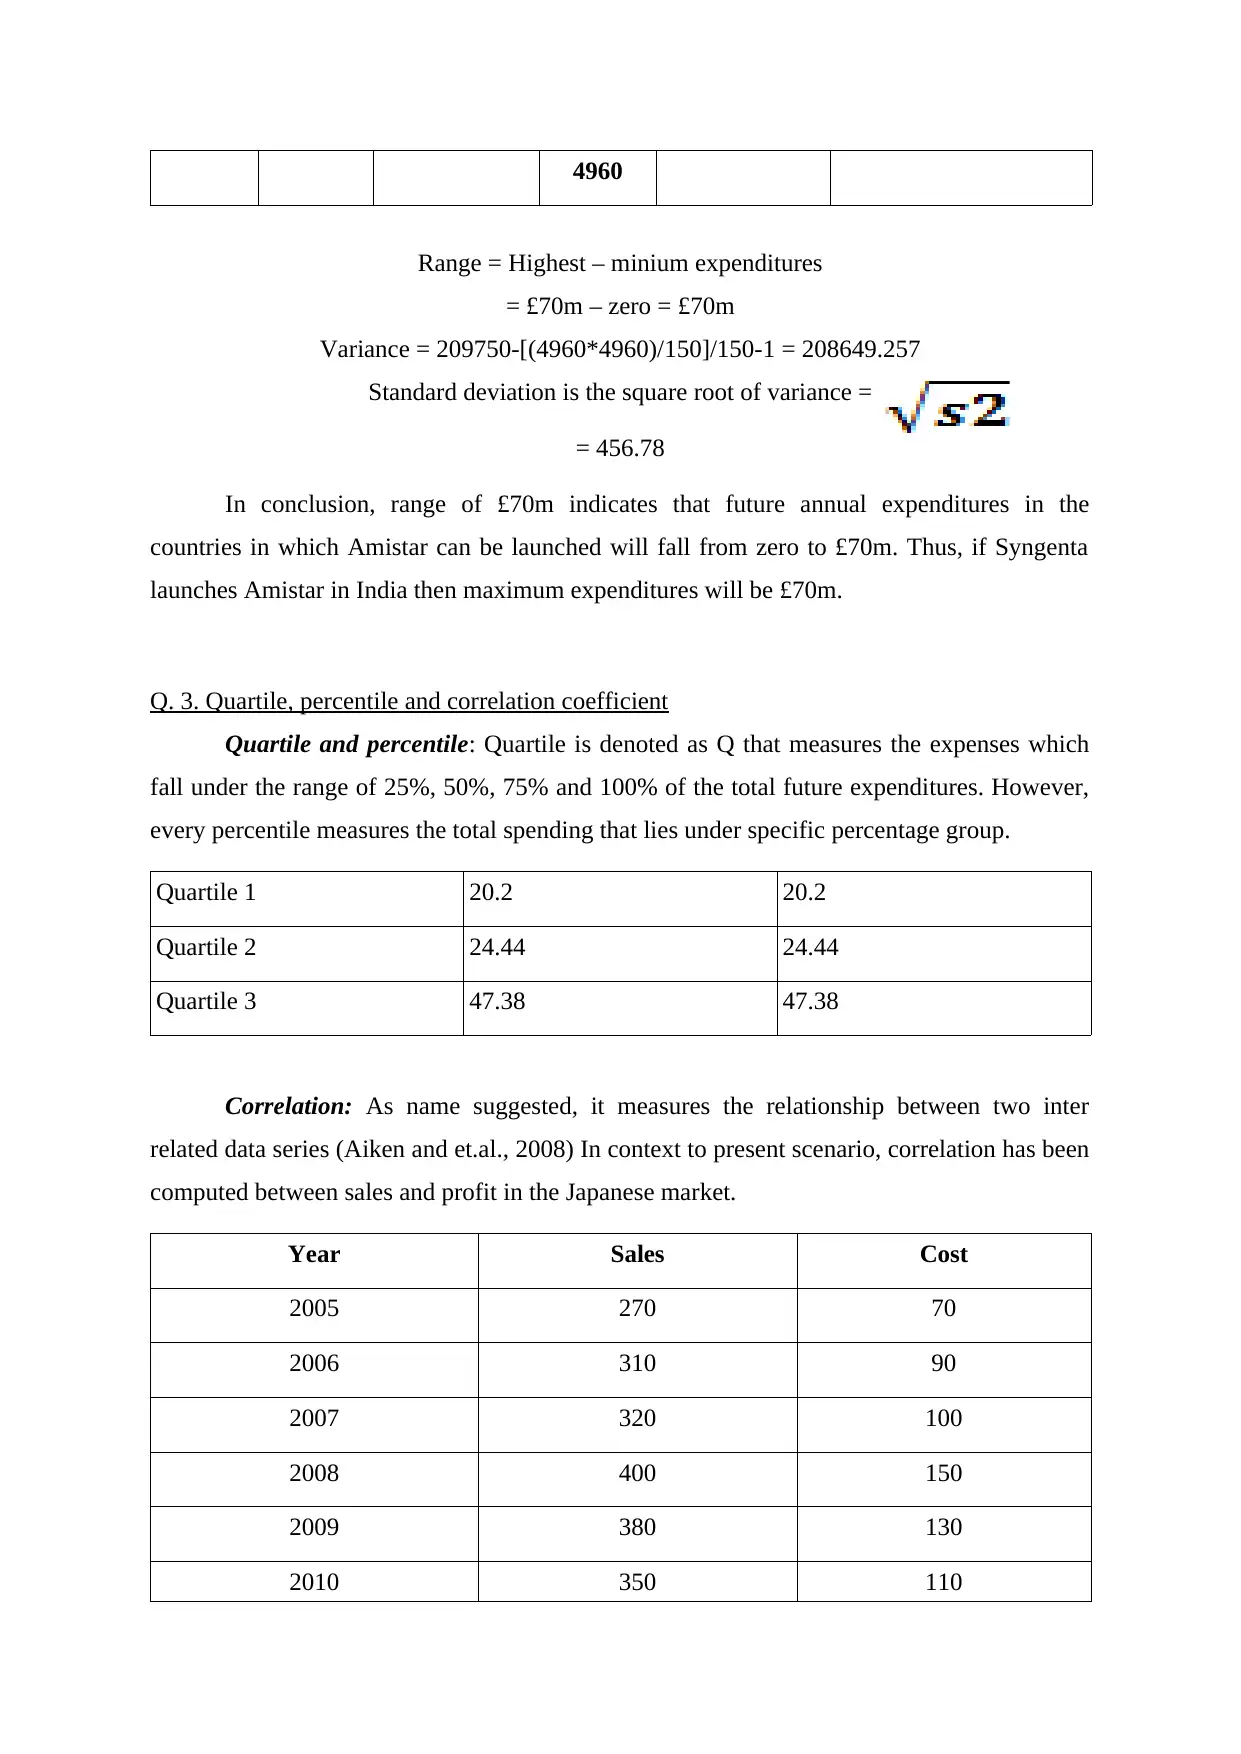
Range = Highest – minium expenditures
= £70m – zero = £70m
Variance = 209750-[(4960*4960)/150]/150-1 = 208649.257
Standard deviation is the square root of variance =
= 456.78
In conclusion, range of £70m indicates that future annual expenditures in the
countries in which Amistar can be launched will fall from zero to £70m. Thus, if Syngenta
launches Amistar in India then maximum expenditures will be £70m.
Q. 3. Quartile, percentile and correlation coefficient
Quartile and percentile: Quartile is denoted as Q that measures the expenses which
fall under the range of 25%, 50%, 75% and 100% of the total future expenditures. However,
every percentile measures the total spending that lies under specific percentage group.
Quartile 1 20.2 20.2
Quartile 2 24.44 24.44
Quartile 3 47.38 47.38
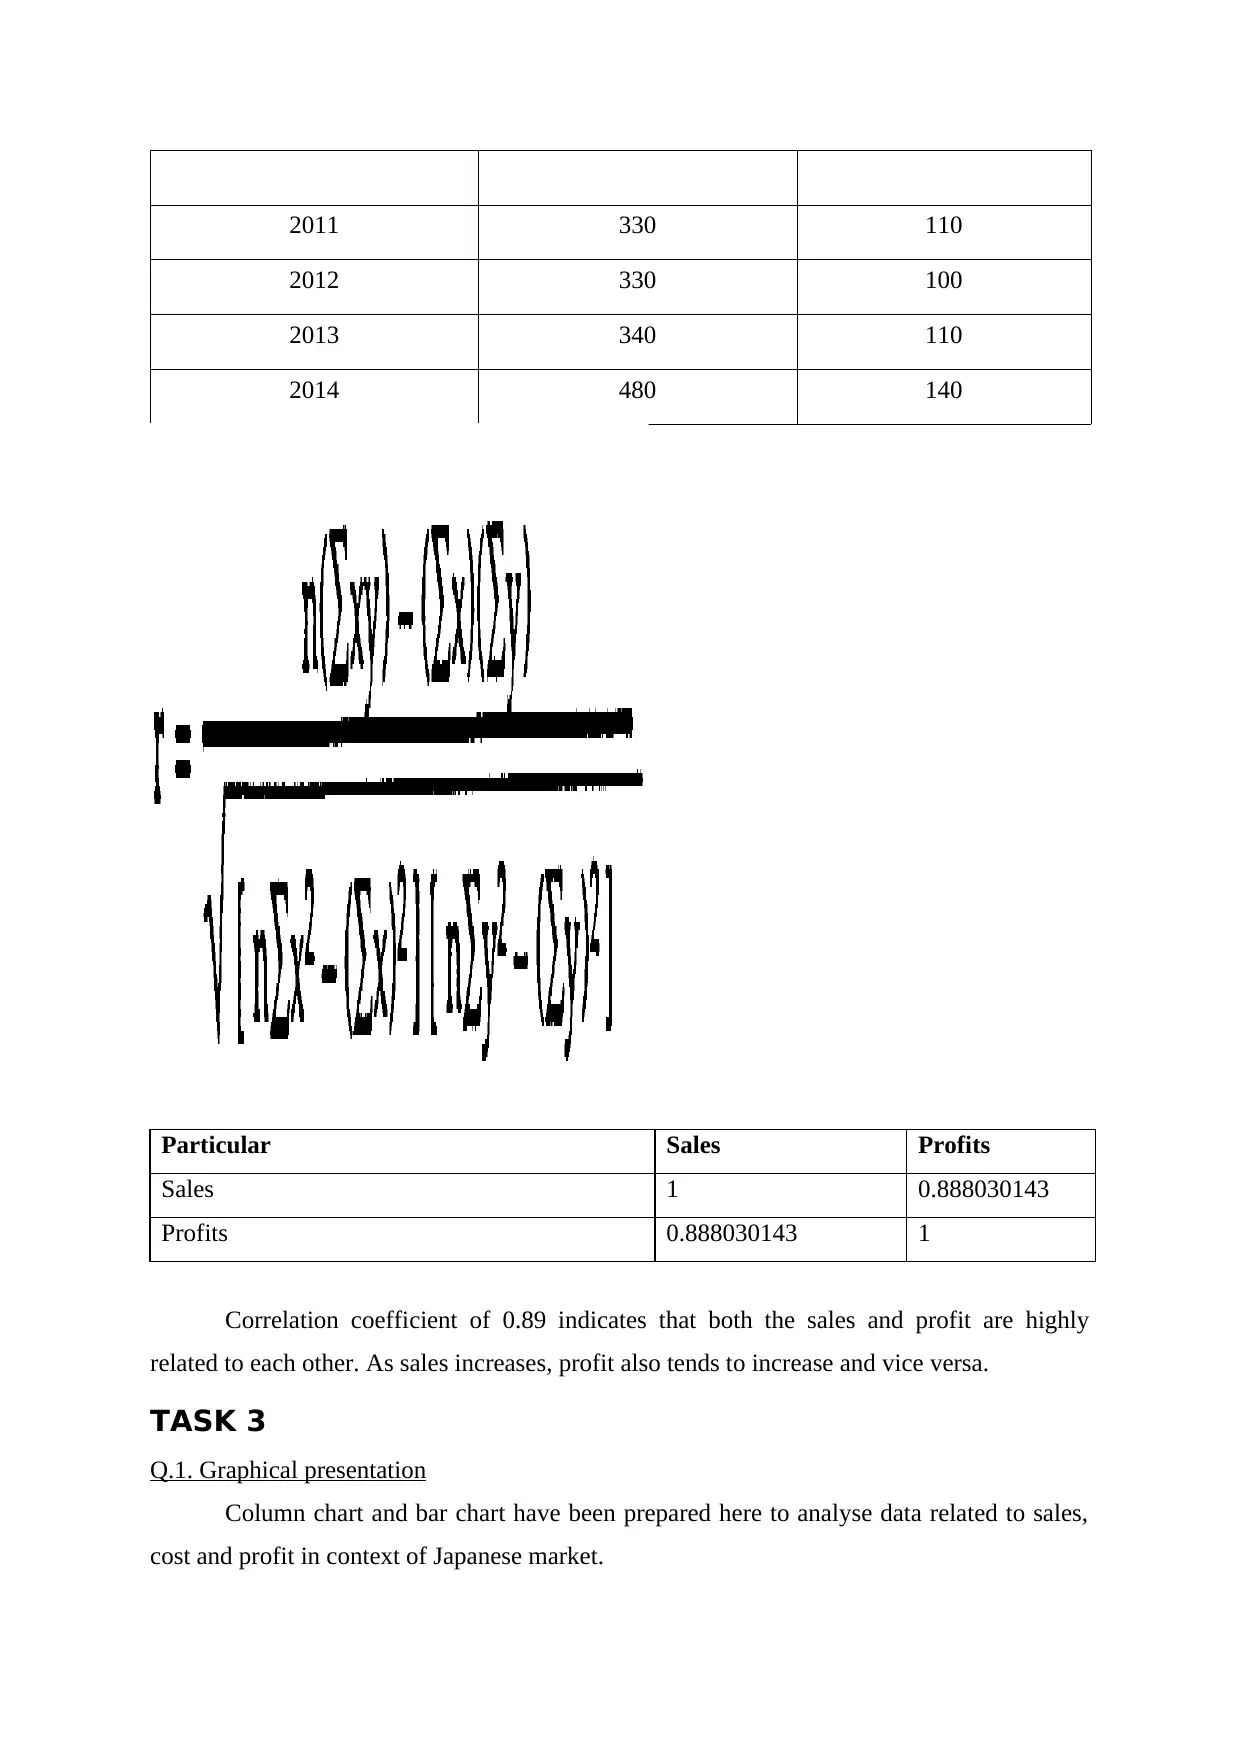
Correlation: As name suggested, it measures the relationship between two inter
related data series (Aiken and et.al., 2008) In context to present scenario, correlation has been
computed between sales and profit in the Japanese market.
Year Sales Cost
2005 270 70
2006 310 90
2007 320 100
2008 400 150
2009 380 130
2010 350 110
Range = Highest – minium expenditures
= £70m – zero = £70m
Variance = 209750-[(4960*4960)/150]/150-1 = 208649.257
Standard deviation is the square root of variance =
= 456.78
In conclusion, range of £70m indicates that future annual expenditures in the
countries in which Amistar can be launched will fall from zero to £70m. Thus, if Syngenta
launches Amistar in India then maximum expenditures will be £70m.
Q. 3. Quartile, percentile and correlation coefficient
Quartile and percentile: Quartile is denoted as Q that measures the expenses which
fall under the range of 25%, 50%, 75% and 100% of the total future expenditures. However,
every percentile measures the total spending that lies under specific percentage group.
Quartile 1 20.2 20.2
Quartile 2 24.44 24.44
Quartile 3 47.38 47.38
Correlation: As name suggested, it measures the relationship between two inter
related data series (Aiken and et.al., 2008) In context to present scenario, correlation has been
computed between sales and profit in the Japanese market.
Year Sales Cost
2005 270 70
2006 310 90
2007 320 100
2008 400 150
2009 380 130
2010 350 110
Paraphrase This Document
Need a fresh take? Get an instant paraphrase of this document with our AI Paraphraser
2011 330 110
2012 330 100
2013 340 110
2014 480 140
Particular Sales Profits
Sales 1 0.888030143
Profits 0.888030143 1
Correlation coefficient of 0.89 indicates that both the sales and profit are highly
related to each other. As sales increases, profit also tends to increase and vice versa.
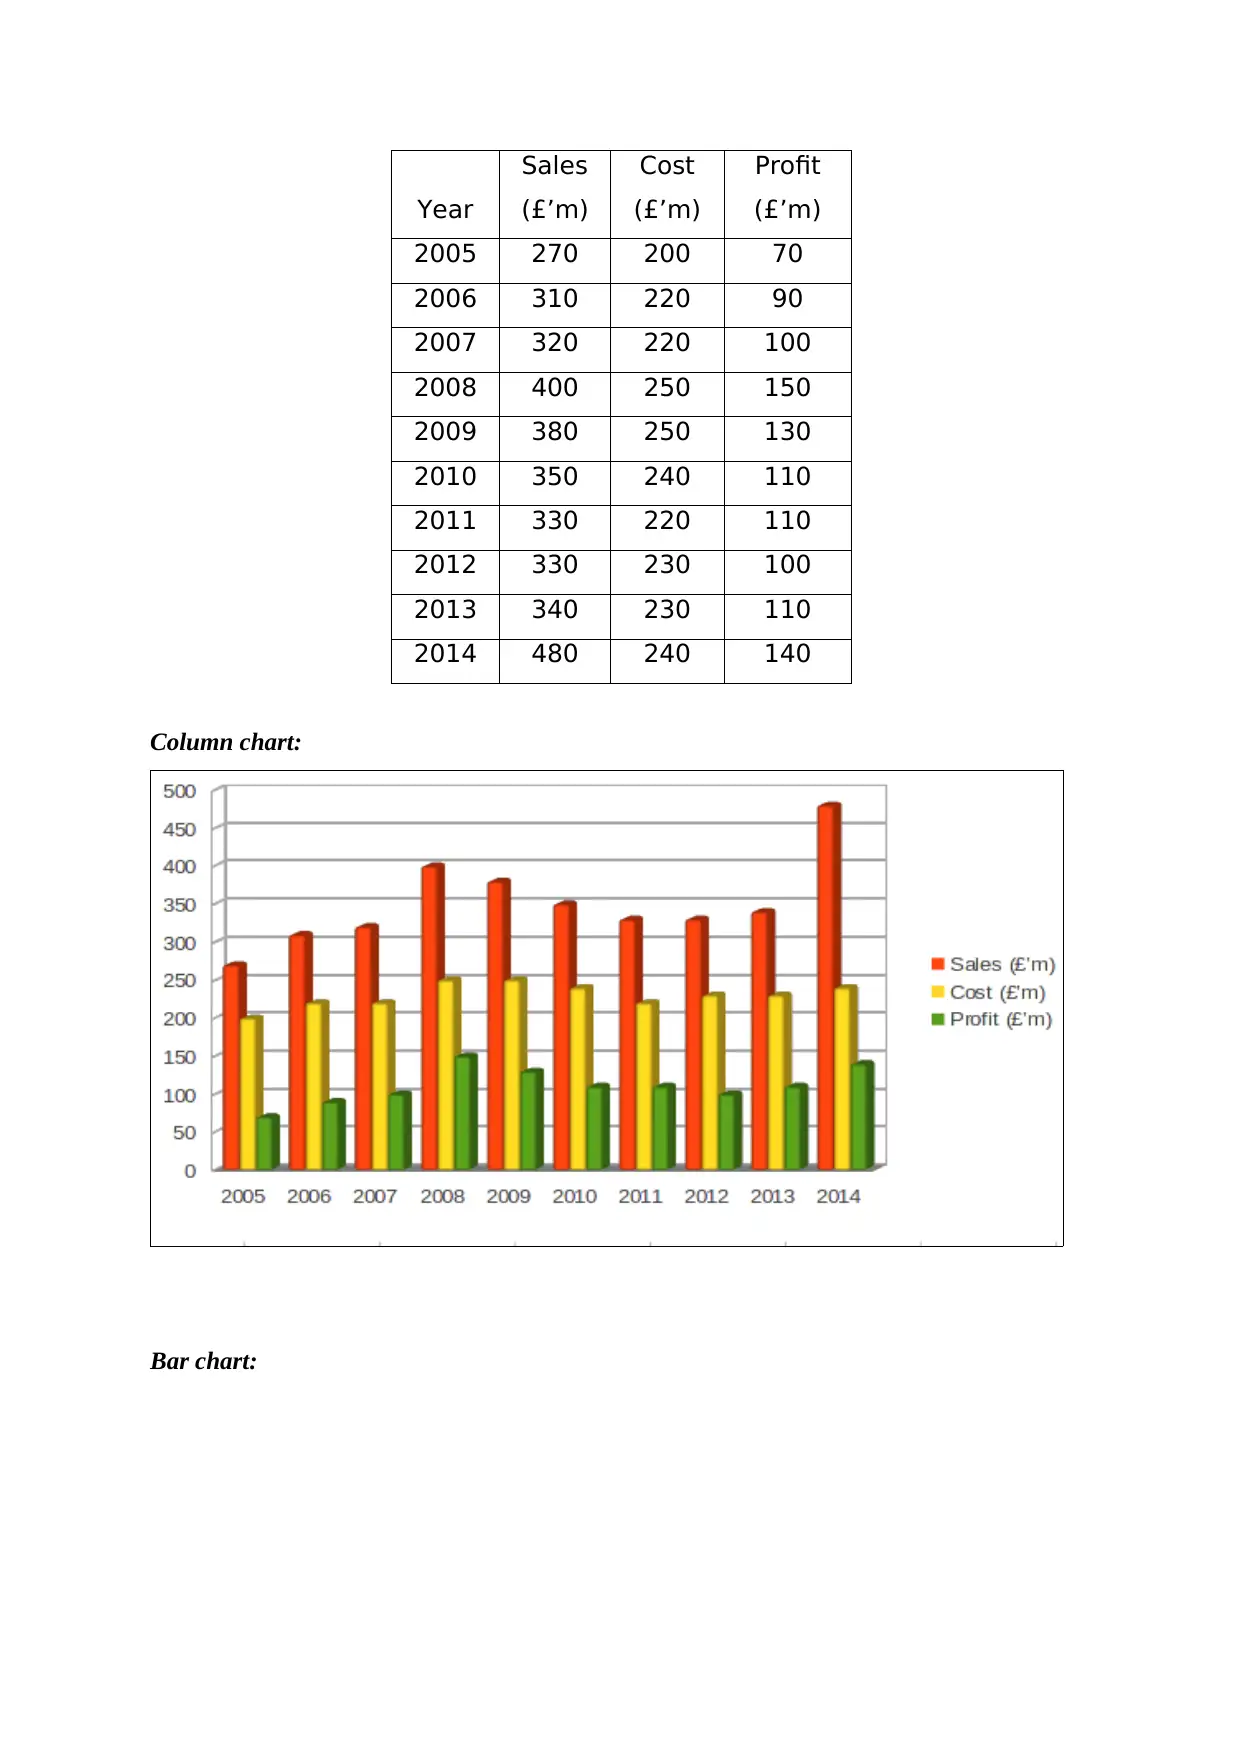
TASK 3
Q.1. Graphical presentation
Column chart and bar chart have been prepared here to analyse data related to sales,
cost and profit in context of Japanese market.
2012 330 100
2013 340 110
2014 480 140
Particular Sales Profits
Sales 1 0.888030143
Profits 0.888030143 1
Correlation coefficient of 0.89 indicates that both the sales and profit are highly
related to each other. As sales increases, profit also tends to increase and vice versa.
TASK 3
Q.1. Graphical presentation
Column chart and bar chart have been prepared here to analyse data related to sales,
cost and profit in context of Japanese market.
Year
Sales
(£’m)
Cost
(£’m)
Profit
(£’m)
2005 270 200 70
2006 310 220 90
2007 320 220 100
2008 400 250 150
2009 380 250 130
2010 350 240 110
2011 330 220 110
2012 330 230 100
2013 340 230 110
2014 480 240 140
Column chart:
Bar chart:
Sales
(£’m)
Cost
(£’m)
Profit
(£’m)
2005 270 200 70
2006 310 220 90
2007 320 220 100
2008 400 250 150
2009 380 250 130
2010 350 240 110
2011 330 220 110
2012 330 230 100
2013 340 230 110
2014 480 240 140
Column chart:
Bar chart:
⊘ This is a preview!⊘
Do you want full access?
Subscribe today to unlock all pages.
Trusted by 1+ million students worldwide
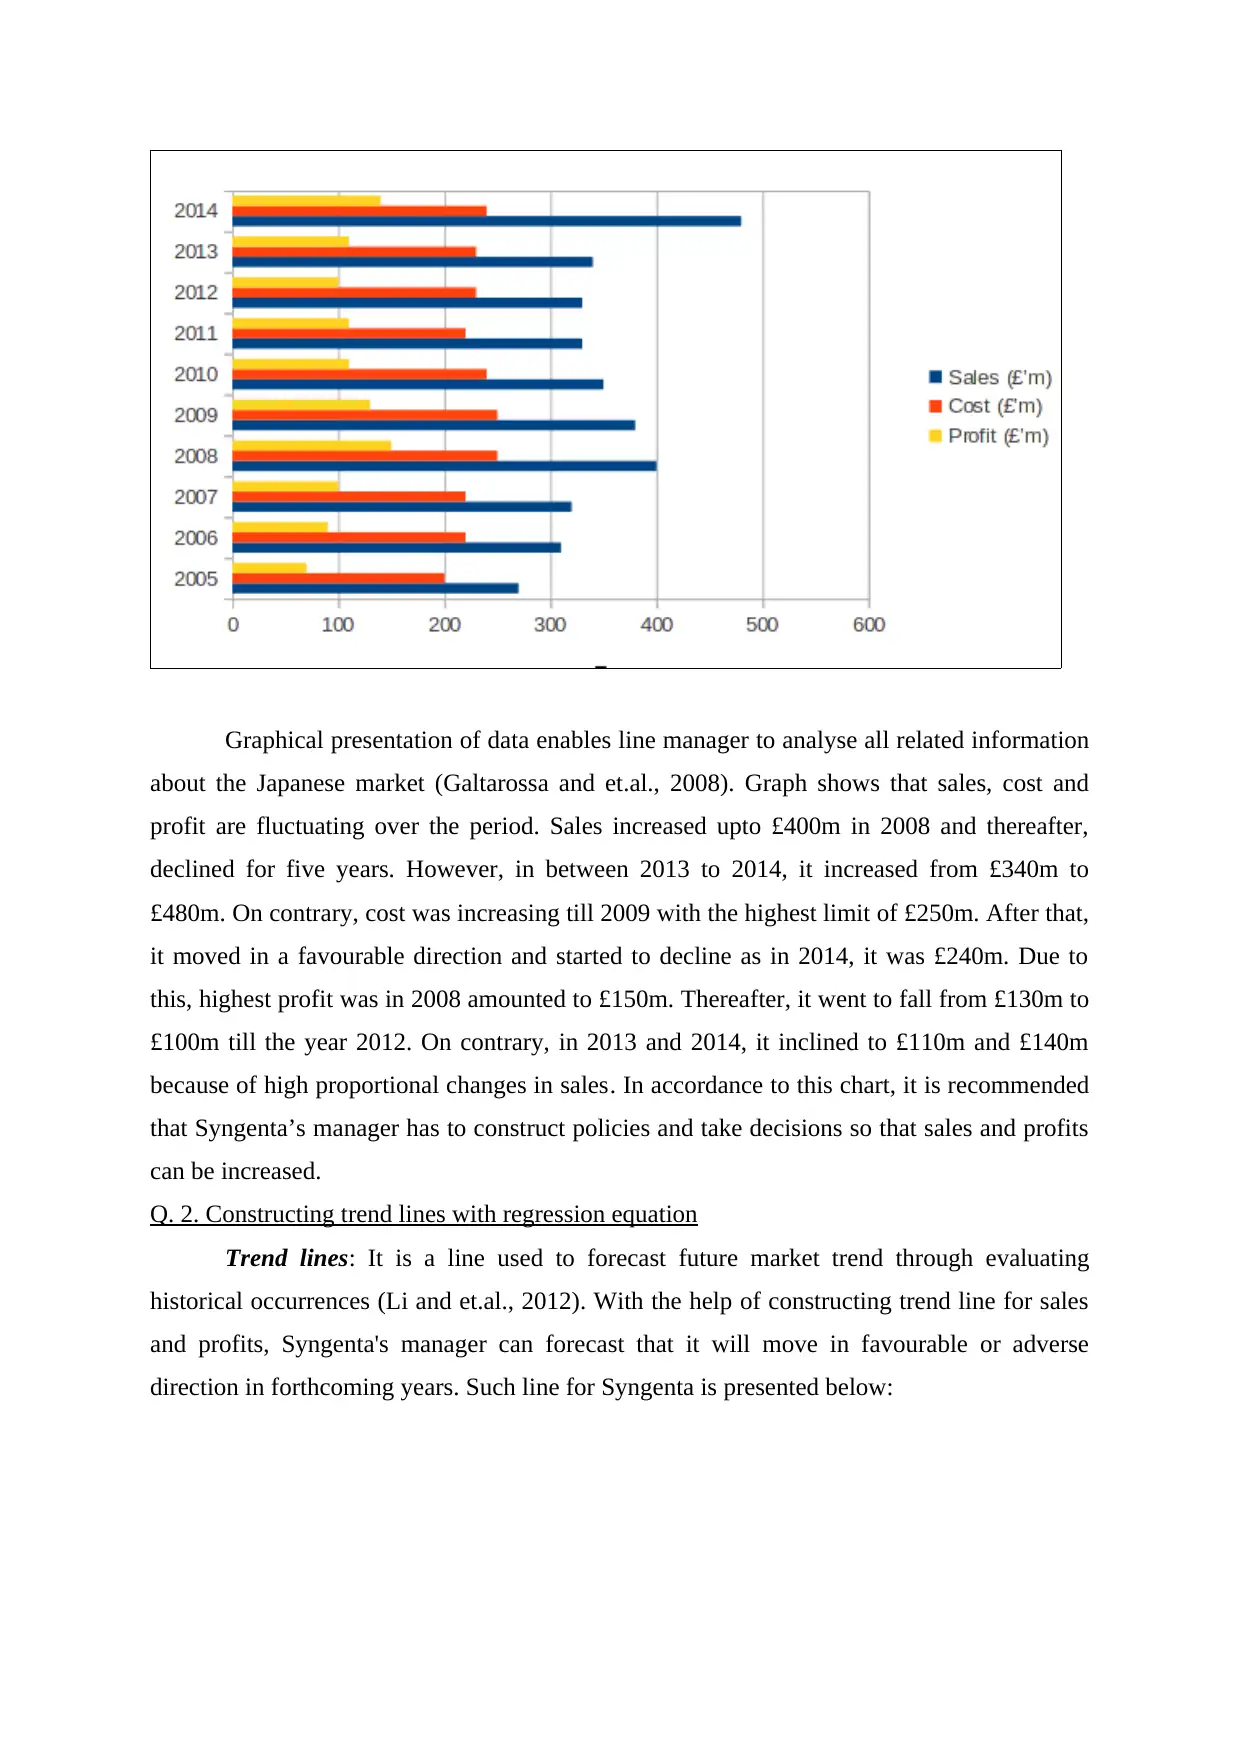
Graphical presentation of data enables line manager to analyse all related information
about the Japanese market (Galtarossa and et.al., 2008). Graph shows that sales, cost and
profit are fluctuating over the period. Sales increased upto £400m in 2008 and thereafter,
declined for five years. However, in between 2013 to 2014, it increased from £340m to
£480m. On contrary, cost was increasing till 2009 with the highest limit of £250m. After that,
it moved in a favourable direction and started to decline as in 2014, it was £240m. Due to
this, highest profit was in 2008 amounted to £150m. Thereafter, it went to fall from £130m to
£100m till the year 2012. On contrary, in 2013 and 2014, it inclined to £110m and £140m
because of high proportional changes in sales. In accordance to this chart, it is recommended
that Syngenta’s manager has to construct policies and take decisions so that sales and profits
can be increased.
Q. 2. Constructing trend lines with regression equation
Trend lines: It is a line used to forecast future market trend through evaluating
historical occurrences (Li and et.al., 2012). With the help of constructing trend line for sales
and profits, Syngenta's manager can forecast that it will move in favourable or adverse
direction in forthcoming years. Such line for Syngenta is presented below:
Paraphrase This Document
Need a fresh take? Get an instant paraphrase of this document with our AI Paraphraser
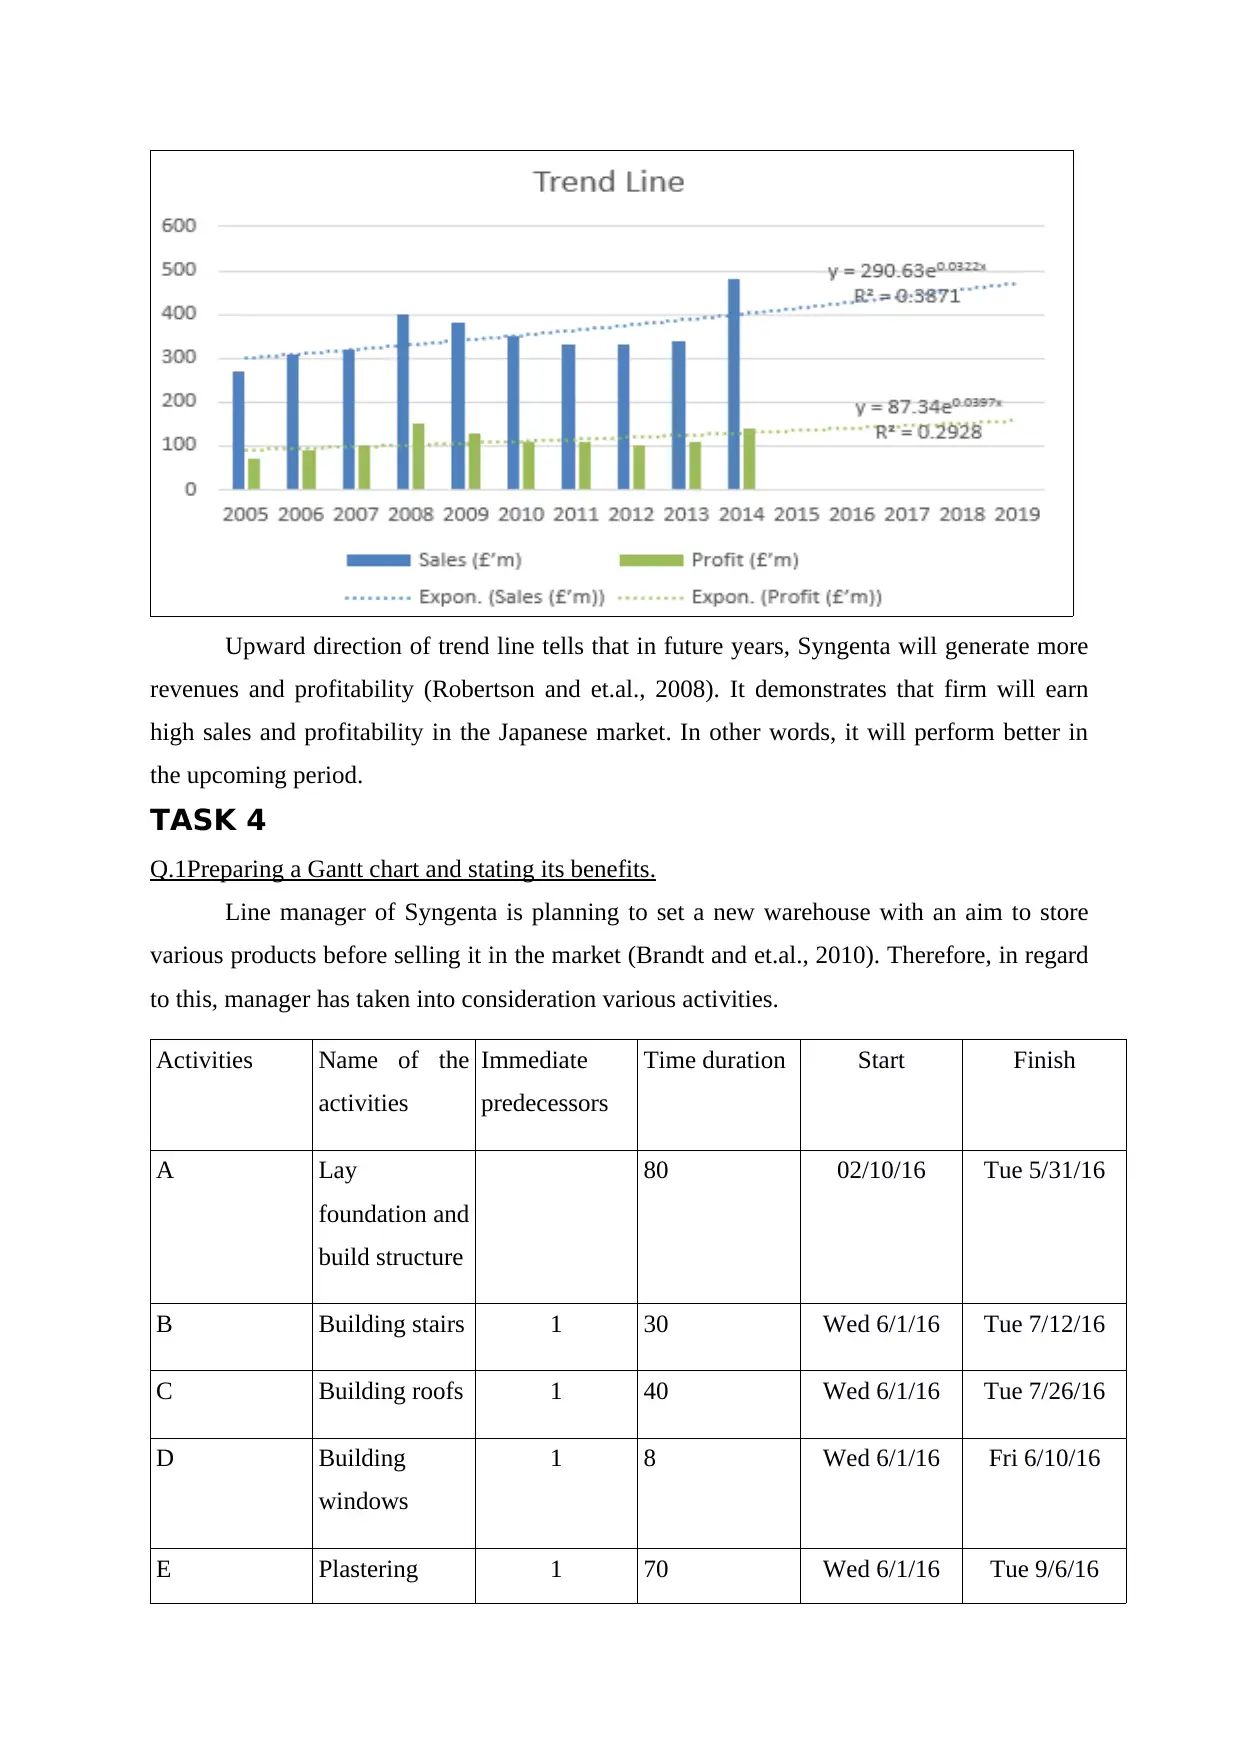
Upward direction of trend line tells that in future years, Syngenta will generate more
revenues and profitability (Robertson and et.al., 2008). It demonstrates that firm will earn
high sales and profitability in the Japanese market. In other words, it will perform better in
the upcoming period.
TASK 4
Q.1Preparing a Gantt chart and stating its benefits.
Line manager of Syngenta is planning to set a new warehouse with an aim to store
various products before selling it in the market (Brandt and et.al., 2010). Therefore, in regard
to this, manager has taken into consideration various activities.
Activities Name of the
activities
Immediate
predecessors
Time duration Start Finish
A Lay
foundation and
build structure
80 02/10/16 Tue 5/31/16
B Building stairs 1 30 Wed 6/1/16 Tue 7/12/16
C Building roofs 1 40 Wed 6/1/16 Tue 7/26/16
D Building
windows
1 8 Wed 6/1/16 Fri 6/10/16
E Plastering 1 70 Wed 6/1/16 Tue 9/6/16
F Carpenter
work
2,3,4,5 70 Wed 9/7/16 Tue 12/13/16
G Electrical
work
2,3,4,5 84 Wed 9/7/16 Mon 1/2/17
H Heating 2,3,4,5 70 Wed 9/7/16 Tue 12/13/16
I Plumbing 2,3,4,5 63 Wed 9/7/16 Fri 12/2/16
J Floor covering 6,7,8,9 28 Tue 1/3/17 Thu 2/9/17
K Decoration 6,7,8,9,10 35 Fri 2/10/17 Thu 3/30/17
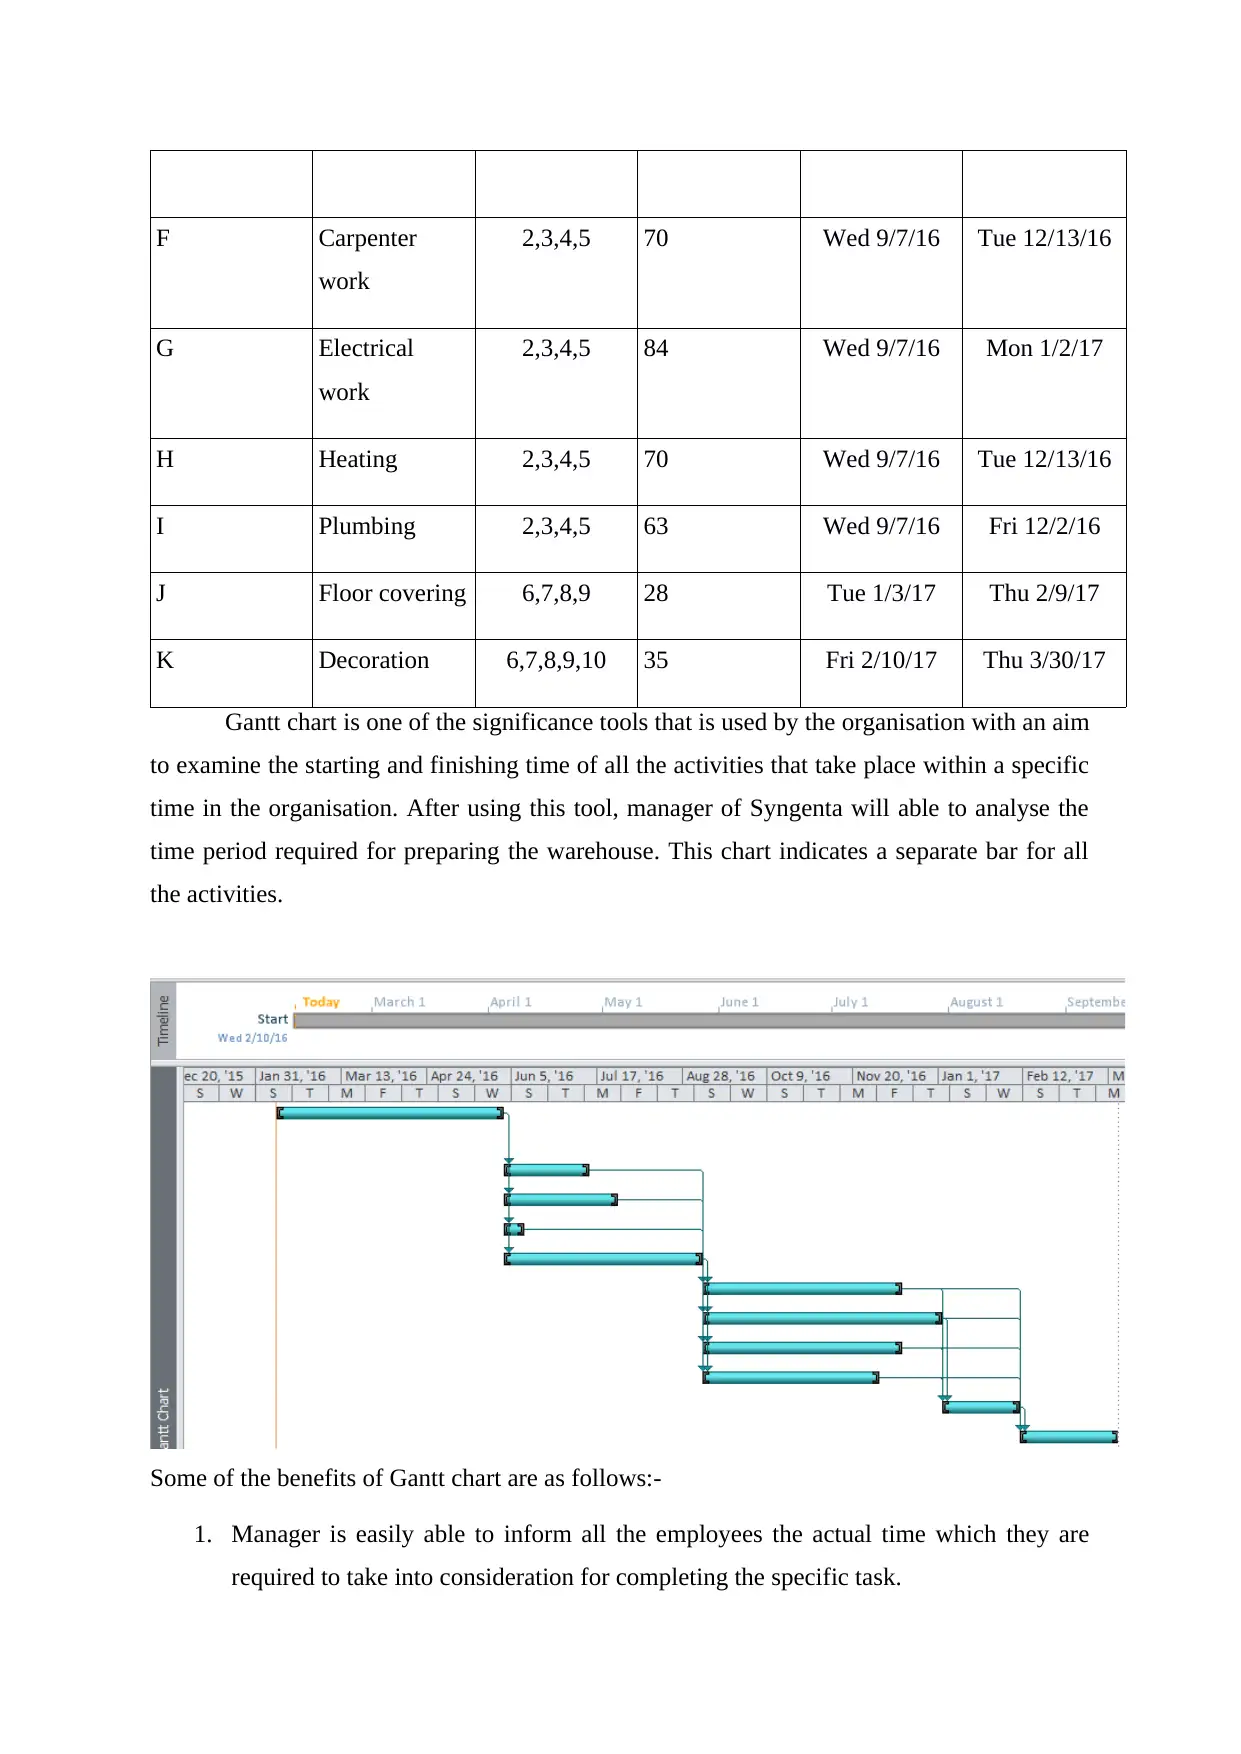
Gantt chart is one of the significance tools that is used by the organisation with an aim
to examine the starting and finishing time of all the activities that take place within a specific
time in the organisation. After using this tool, manager of Syngenta will able to analyse the
time period required for preparing the warehouse. This chart indicates a separate bar for all
the activities.
Some of the benefits of Gantt chart are as follows:-
1. Manager is easily able to inform all the employees the actual time which they are
required to take into consideration for completing the specific task.
work
2,3,4,5 70 Wed 9/7/16 Tue 12/13/16
G Electrical
work
2,3,4,5 84 Wed 9/7/16 Mon 1/2/17
H Heating 2,3,4,5 70 Wed 9/7/16 Tue 12/13/16
I Plumbing 2,3,4,5 63 Wed 9/7/16 Fri 12/2/16
J Floor covering 6,7,8,9 28 Tue 1/3/17 Thu 2/9/17
K Decoration 6,7,8,9,10 35 Fri 2/10/17 Thu 3/30/17
Gantt chart is one of the significance tools that is used by the organisation with an aim
to examine the starting and finishing time of all the activities that take place within a specific
time in the organisation. After using this tool, manager of Syngenta will able to analyse the
time period required for preparing the warehouse. This chart indicates a separate bar for all
the activities.
Some of the benefits of Gantt chart are as follows:-
1. Manager is easily able to inform all the employees the actual time which they are
required to take into consideration for completing the specific task.
⊘ This is a preview!⊘
Do you want full access?
Subscribe today to unlock all pages.
Trusted by 1+ million students worldwide
1 out of 17
Related Documents


Your All-in-One AI-Powered Toolkit for Academic Success.
+13062052269
info@desklib.com
Available 24*7 on WhatsApp / Email
![[object Object]](/_next/static/media/star-bottom.7253800d.svg)
Unlock your academic potential
Copyright © 2020–2026 A2Z Services. All Rights Reserved. Developed and managed by ZUCOL.