Economics Assignment: Impact of Policies on Yalumba Company

Verified

Added on  2020/02/24

|5
|654
|196
Report
AI Summary
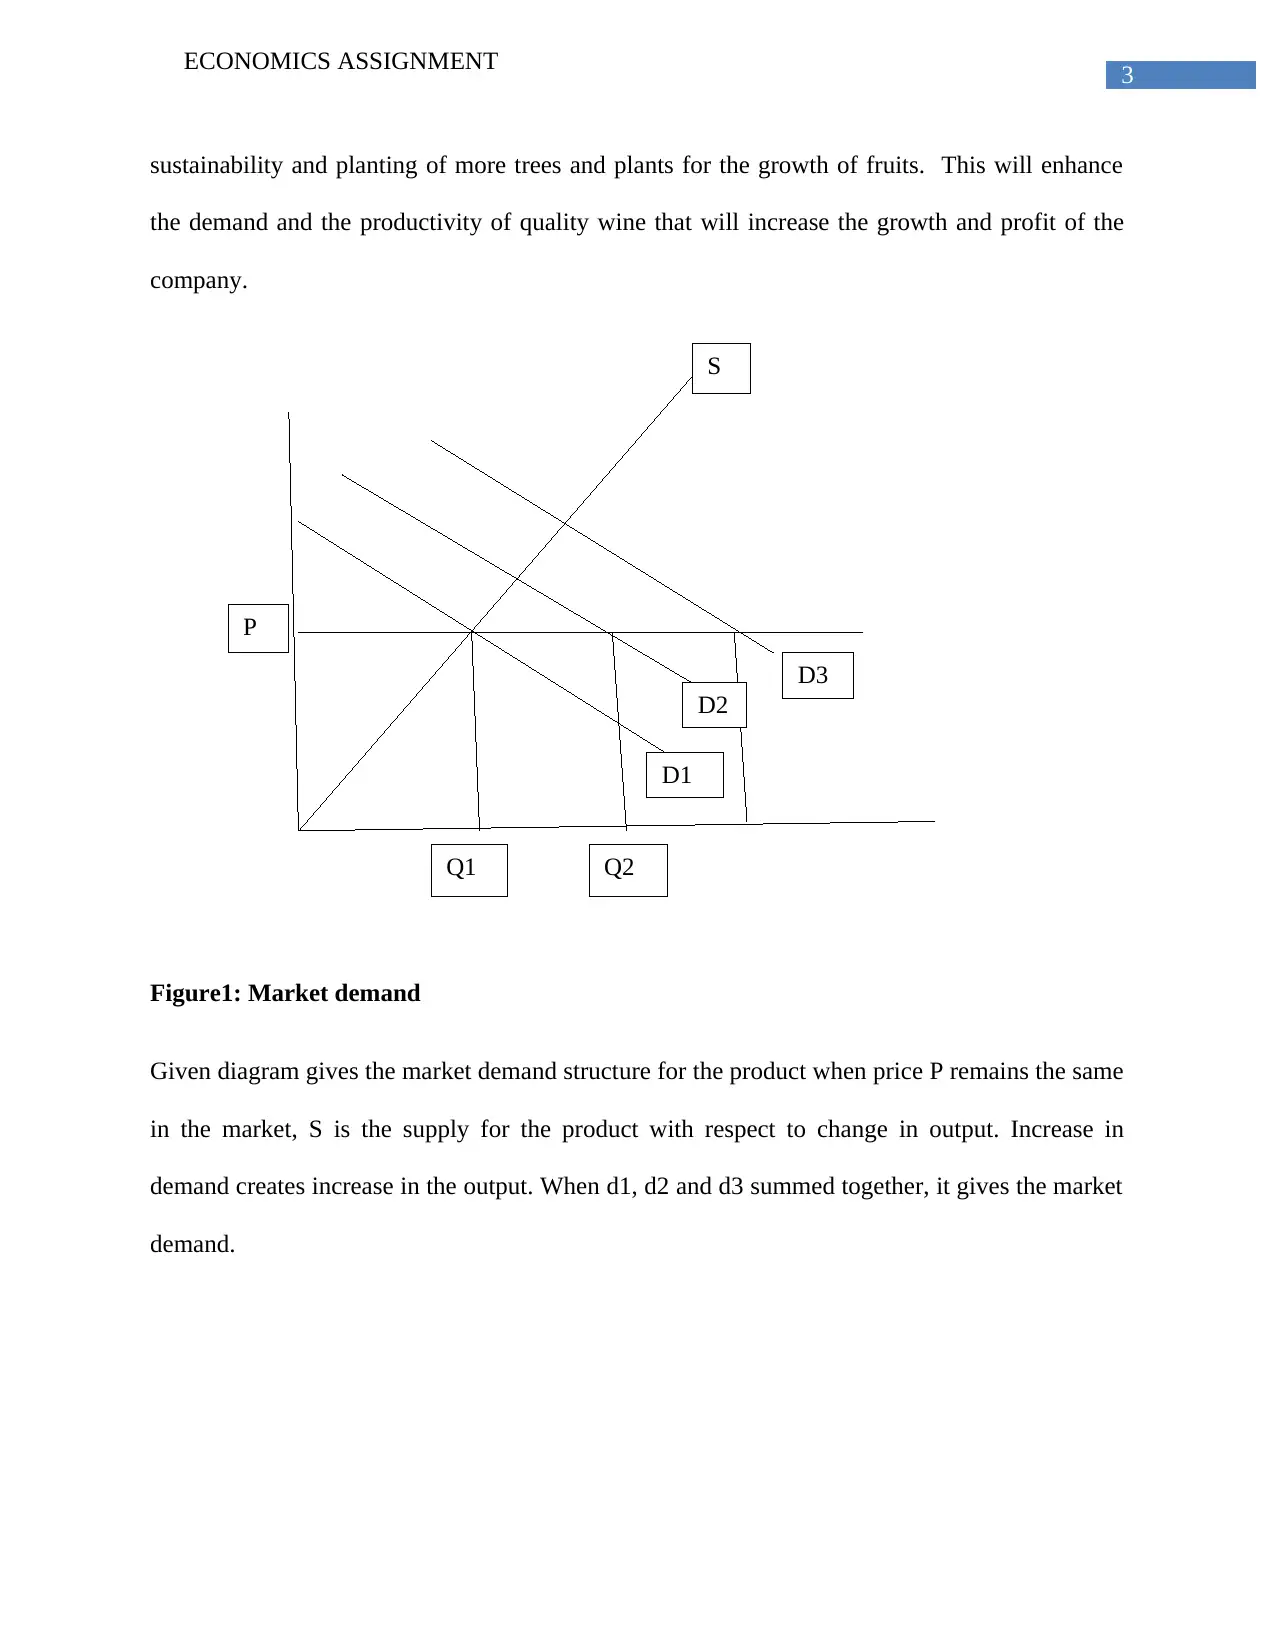
This economics assignment explores the concepts of demand, market demand, and price elasticity, providing a foundational understanding of these principles. The report then delves into the market demand for the Yalumba Company's wine, examining how government policies influence the wine industry. The analysis includes a market demand structure diagram and emphasizes the importance of environmentally friendly production. The assignment highlights that government policies promoting sustainability and quality materials can increase market demand, leading to company growth and profitability. The report also references the impact of income and consumer preferences on demand, providing a comprehensive overview of the factors affecting market dynamics. The report refers to the work of Goncharuk (2017) and Kattuman, Ibragimov & Ibragimov (2017) to support the analysis.
Document Page
Running head: ECONOMICS ASSIGNMENT
ECONOMICS ASSIGNMENT
Name of the student
Name of the university
Author note
tabler-icon-diamond-filled.svg

Paraphrase This Document

Need a fresh take? Get an instant paraphrase of this document with our AI Paraphraser
Document Page
1
ECONOMICS ASSIGNMENT
Part A-
Introduction
Concept of demand-
Demand is the willingness or the wants and necessities made by the consumers or the customers.
It means the willingness to purchase a commodity in exchange of money at a place called
market. It includes the factors of price and quantity. Law of demand says that with the rise in
price creates less demand, on the other side fall in price will create more demand and purchasing
power for the product. Demand is downward negatively sloping curve, movements in demand is
dependent on other economic variables like price, income (
Market demand-
Market demand includes the summation of or addition of all the individual demands of the
consumers. Adding the collection of individual demands gives the market demand. When the
market demand is in table format, it is market demand schedule.
Elasticity of demand-
Price Elasticity of demand on the other hand states the relation between price and the quantity
demanded that is demand varies with respect to a change in prices. In order to calculate price
elasticity mathematically, it is the ratio between percentage changes in quantity demand with
respect to change in price. There are five types of demand elasticity and they are perfect elastic,
perfect inelastic, relative elastic, and relative inelastic and unit elastic (Kattuman, Ibragimov &
Ibragimov 2017).
Document Page
2
ECONOMICS ASSIGNMENT
Summary
Factors affecting demand-
Various factors create fluctuations in the movement in the demand curve.
Income of the consumers or customers- demand for the product directly depends on consumer
daily living standards and income. High income creates strong demand for the product whereas
average or low income discourages buyers for the demand of products.
Price of a product- High price creates low demand for the purchase of the product, whereas
reasonable rates create high demand for the product. It also depends on product substitution
effect.
Tastes and preferences- Taste and preferences for the product includes customs, daily habits and
way of living , individual preferences gives the response on the demand for the product.
Quality and production- Standard quality product with updated technology and modern
utilization of resources in the production of the products creates more demand.
Part B-
Market demand of Yalumba Company and impact of a change in government policy on the
chosen firm/industry (200)
The demand on the consumption of the wine of Yalumba Company depends on government
plans and policies. There is more encouragement in the environment friendly production of
wines therefore with good quality materials in the production of wine will create more market
demand (Goncharuk 2017). Government policy must include those policies that include
Document Page
3
ECONOMICS ASSIGNMENT
D1
D2
S
P
Q1 Q2
D3
sustainability and planting of more trees and plants for the growth of fruits. This will enhance
the demand and the productivity of quality wine that will increase the growth and profit of the
company.
Figure1: Market demand
Given diagram gives the market demand structure for the product when price P remains the same
in the market, S is the supply for the product with respect to change in output. Increase in
demand creates increase in the output. When d1, d2 and d3 summed together, it gives the market
demand.
tabler-icon-diamond-filled.svg

Paraphrase This Document

Need a fresh take? Get an instant paraphrase of this document with our AI Paraphraser
Document Page
4
ECONOMICS ASSIGNMENT
References
Goncharuk, A.G., 2017. Wine Value Chains: Challenges and Prospects. Journal of Applied
Management and Investments, 6(1), pp.11-27.
Kattuman, P., Ibragimov, R., Ma, J., & Ibragimov, M. (2017). Income inequality and price
elasticity of market demand: the case of crossing Lorenz curves.
chevron_up_icon
1 out of 5
circle_padding
hide_on_mobile
zoom_out_icon
[object Object]