Market Research Report: Call Time, Staff, and Complaints Analysis
VerifiedAdded on 2022/08/20
|11
|2078
|11
Report
AI Summary
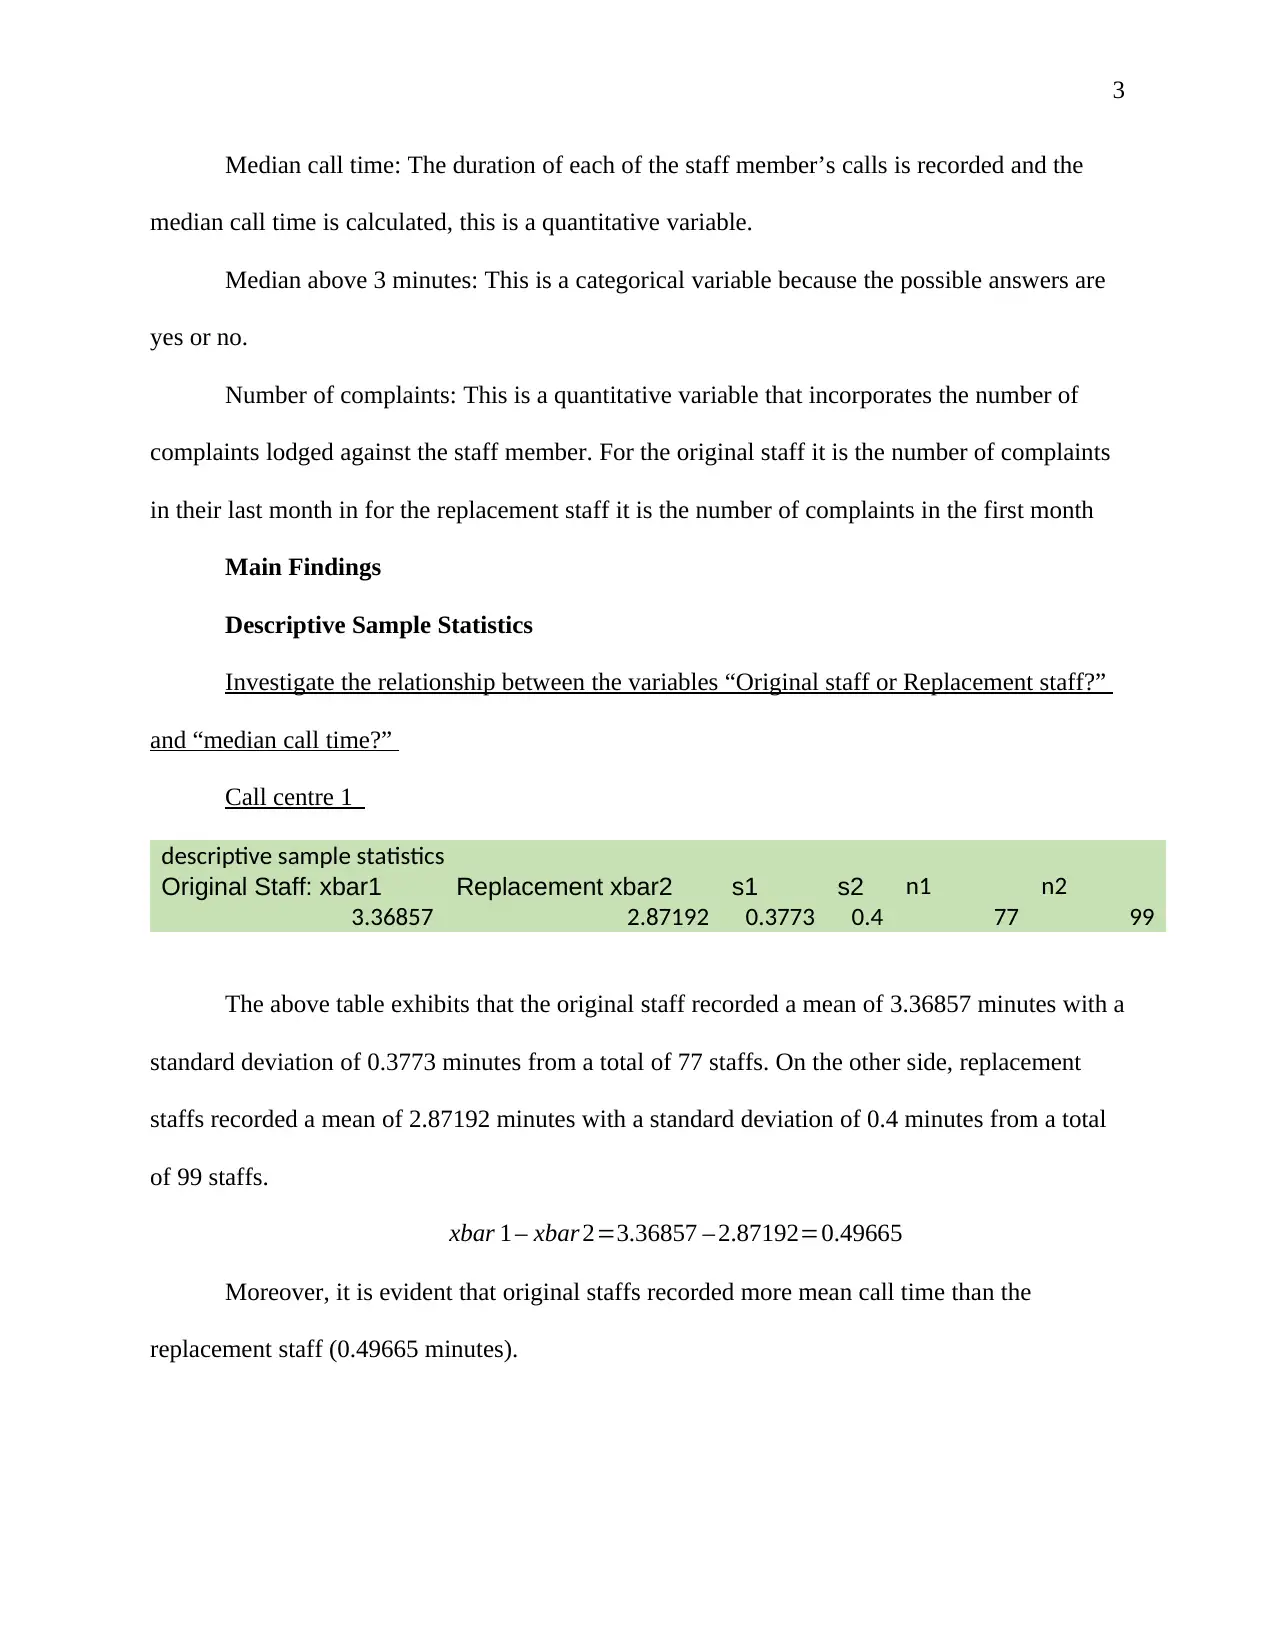
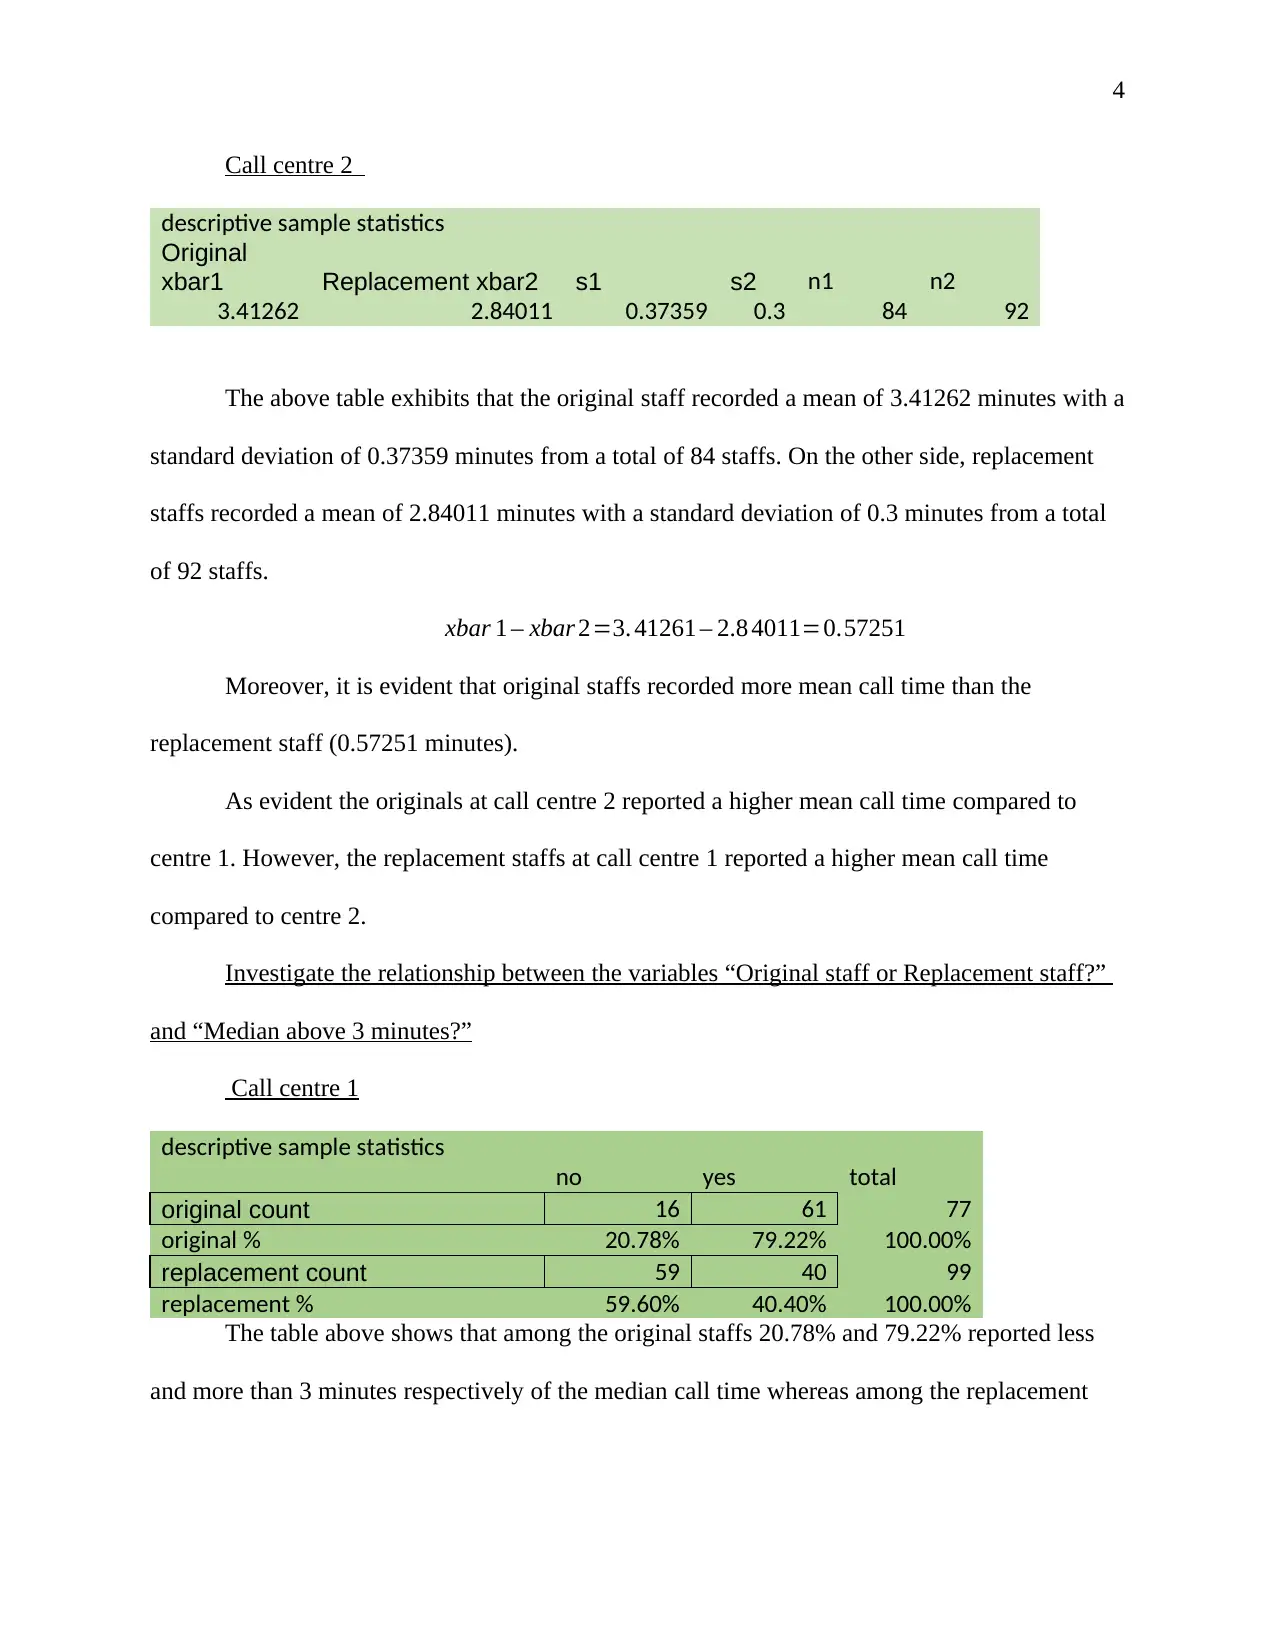
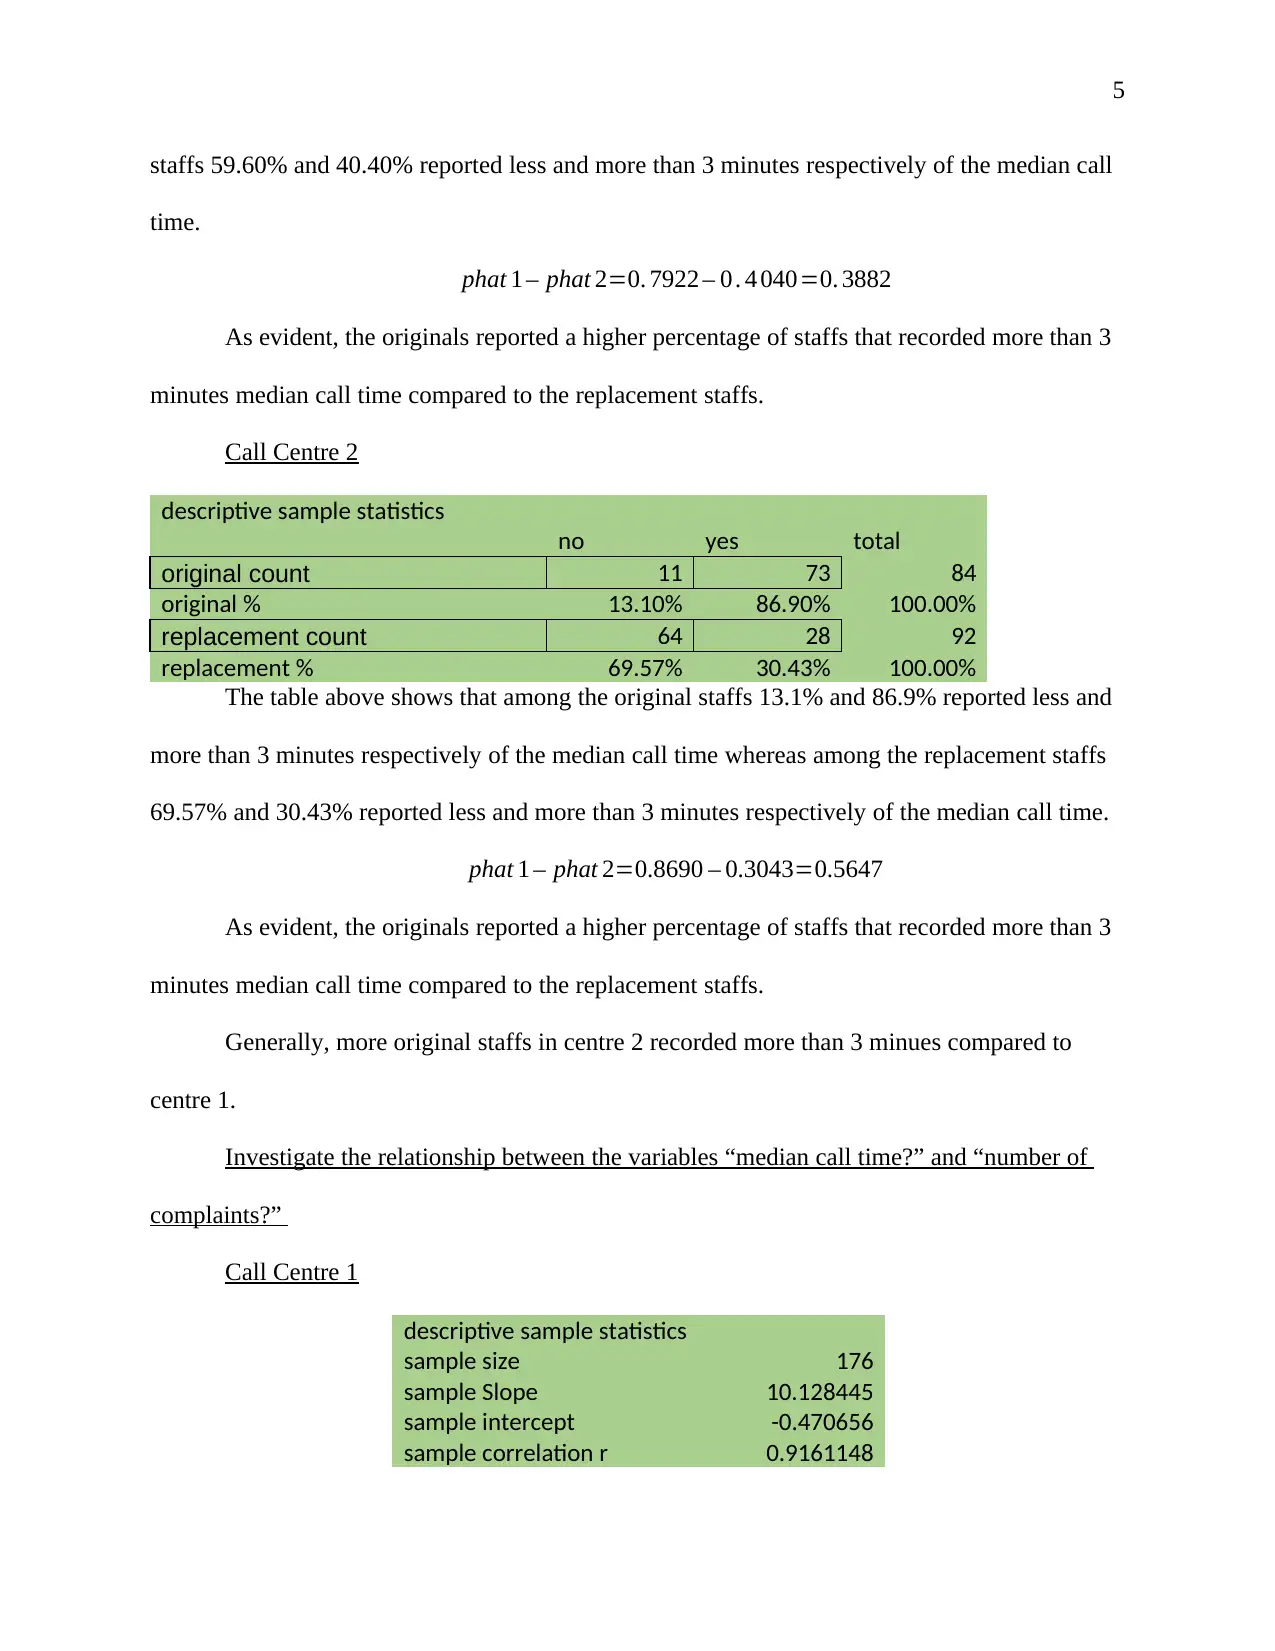
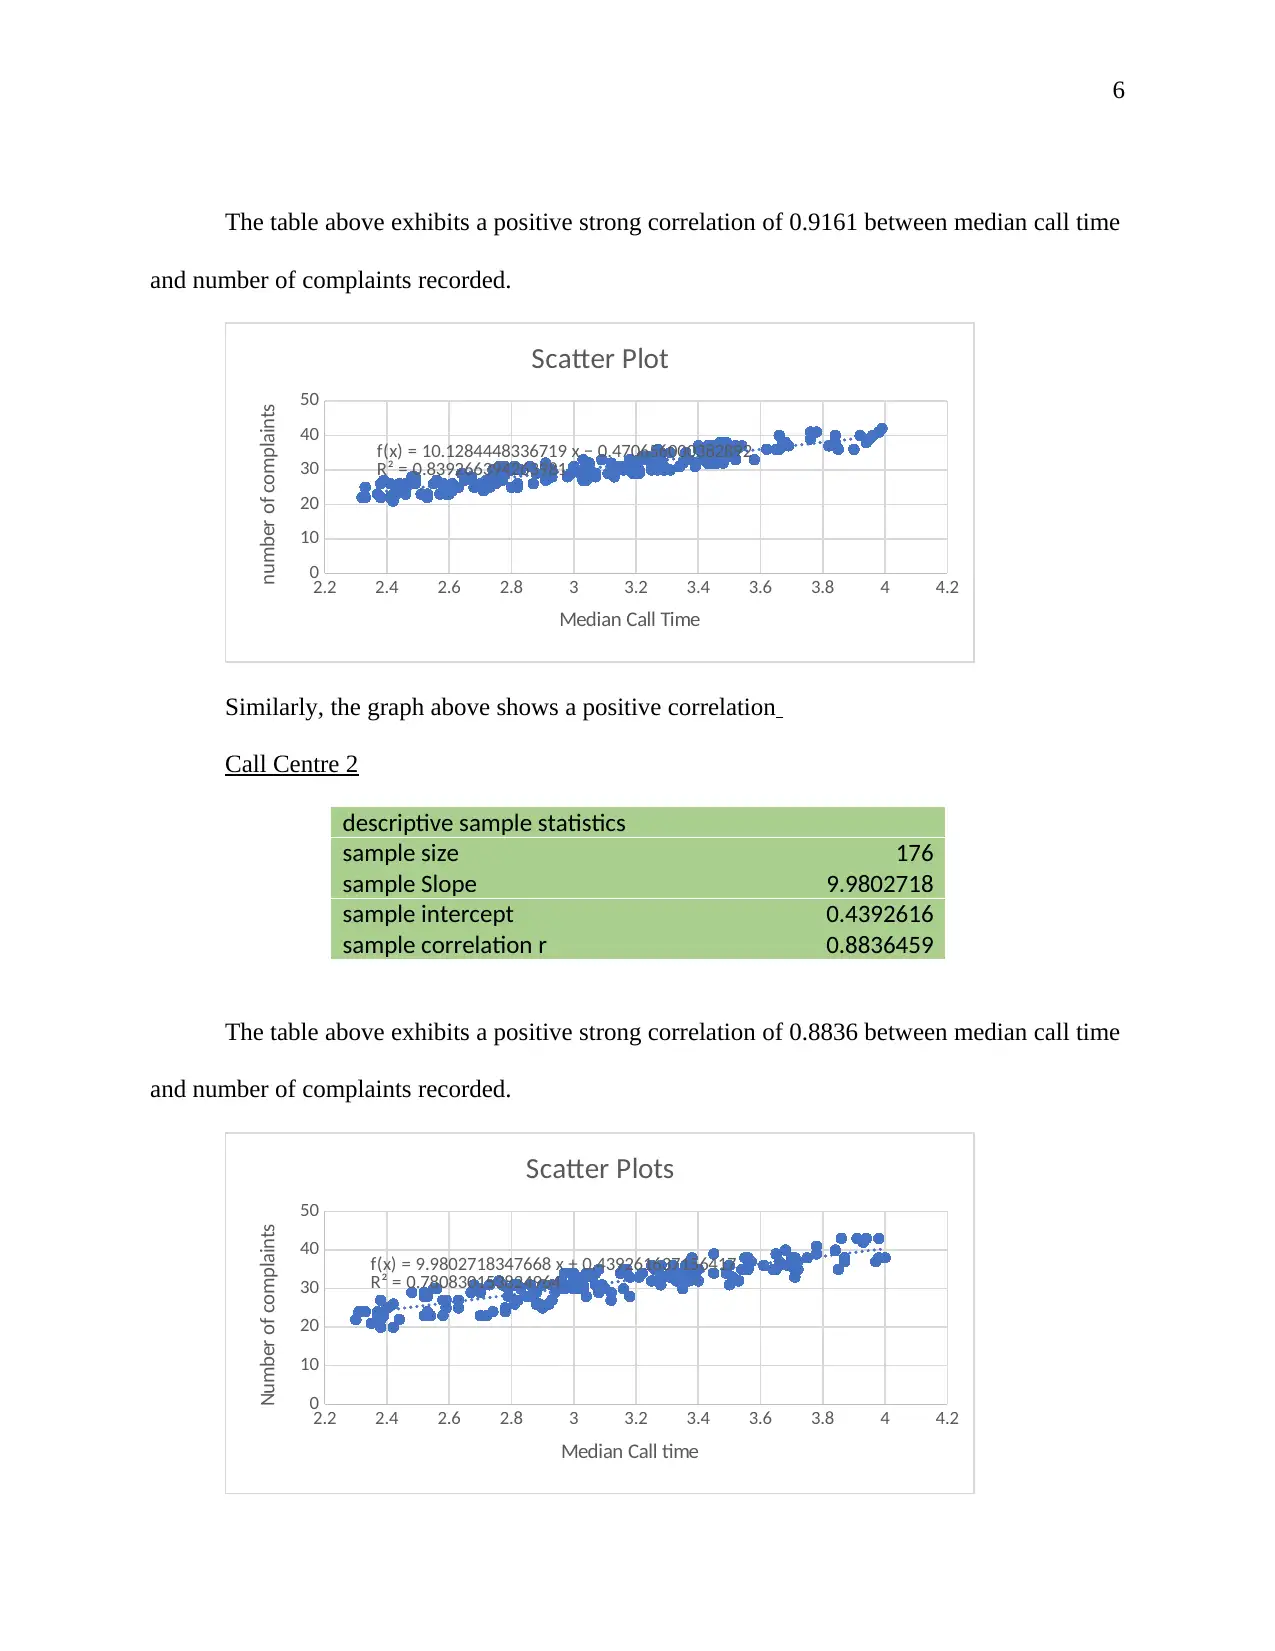
This report presents a market research analysis of call center data, focusing on the median call times of original and replacement staff members and the relationship between call duration and customer complaints. The study utilizes two datasets from different call centers, examining variables such as staff type, median call time, instances of calls exceeding three minutes, and the number of complaints received. Descriptive statistics, including mean call times and standard deviations, are calculated for both staff groups in each call center. The report also investigates the proportion of calls exceeding three minutes and analyzes the correlation between call time and complaint numbers using statistical methods such as z-scores, confidence intervals, and inferential statistics. Key findings indicate that original staff tend to have longer median call times and a higher number of complaints compared to replacement staff. The report concludes with a discussion of the implications of these findings and suggests further investigation into the factors contributing to the observed differences between call centers.

1
Market Research Assessing Difference in Median Call Time used by the Original or
Replacement Staff.
Name:
Institution:
Market Research Assessing Difference in Median Call Time used by the Original or
Replacement Staff.
Name:
Institution:
Paraphrase This Document
Need a fresh take? Get an instant paraphrase of this document with our AI Paraphraser

2
Introduction
There are no doubts business tend to serve clients across a wide geographical region.
Consequently, there are clients that tend to seek clarification, instructions, or questions
concerning the products, services, and employees related to the company. As a result, the various
ways used the companies used the tackle the above factor, which include face to face interviews,
electronic mails, letters, and telephone calls, among others. Among the above methods,
telephone interviews or calls are faster and tend to have the quickest response. Notably,
clarifications tend to differ from one client to another thus the time used to tackle the issues also
vary. Moreover, some customers may not be satisfied about the staff’s aid, resolution, or
response thus they may be prompted to launch a complain. Therefore, the following study seeks
to exhibits the median time used by the original or replacement staffs; besides, the study will
assess the staffs the use more than 3 minutes over the call. Consequently, it is essential to not
only the exhibit the number of complaints launched towards an employee but also assess the
relationship between median call time and number of complaints launched.
Description of the Dataset
The study will use two data sets, which include call centre 1 and centre 2, which contains
the information about each staff member. Notably, the data was sorted using 11900004, which
resulted in 176 observations (staffs). Consequently, each of the datasets consists of the following
variables, original staff or replacement staff, median call time, median above 3 minutes, and
number of complaints.
Original staff or replacement staff: Incorporates the staff member one of the original
staff or replacement staff, this is a categorical variable.

3
Median call time: The duration of each of the staff member’s calls is recorded and the
median call time is calculated, this is a quantitative variable.
Median above 3 minutes: This is a categorical variable because the possible answers are
yes or no.
Number of complaints: This is a quantitative variable that incorporates the number of
complaints lodged against the staff member. For the original staff it is the number of complaints
in their last month in for the replacement staff it is the number of complaints in the first month
Main Findings
Descriptive Sample Statistics
Investigate the relationship between the variables “Original staff or Replacement staff?”
and “median call time?”
Call centre 1
descriptive sample statistics
Original Staff: xbar1 Replacement xbar2 s1 s2 n1 n2
3.36857 2.87192 0.3773 0.4 77 99
The above table exhibits that the original staff recorded a mean of 3.36857 minutes with a
standard deviation of 0.3773 minutes from a total of 77 staffs. On the other side, replacement
staffs recorded a mean of 2.87192 minutes with a standard deviation of 0.4 minutes from a total
of 99 staffs.
xbar 1 – xbar 2=3.36857 – 2.87192=0.49665
Moreover, it is evident that original staffs recorded more mean call time than the
replacement staff (0.49665 minutes).
⊘ This is a preview!⊘
Do you want full access?
Subscribe today to unlock all pages.

Trusted by 1+ million students worldwide

4
Call centre 2
descriptive sample statistics
Original
xbar1 Replacement xbar2 s1 s2 n1 n2
3.41262 2.84011 0.37359 0.3 84 92
The above table exhibits that the original staff recorded a mean of 3.41262 minutes with a
standard deviation of 0.37359 minutes from a total of 84 staffs. On the other side, replacement
staffs recorded a mean of 2.84011 minutes with a standard deviation of 0.3 minutes from a total
of 92 staffs.
xbar 1 – xbar 2=3. 41261 – 2.8 4011=0.57251
Moreover, it is evident that original staffs recorded more mean call time than the
replacement staff (0.57251 minutes).
As evident the originals at call centre 2 reported a higher mean call time compared to
centre 1. However, the replacement staffs at call centre 1 reported a higher mean call time
compared to centre 2.
Investigate the relationship between the variables “Original staff or Replacement staff?”
and “Median above 3 minutes?”
Call centre 1
descriptive sample statistics
no yes total
original count 16 61 77
original % 20.78% 79.22% 100.00%
replacement count 59 40 99
replacement % 59.60% 40.40% 100.00%
The table above shows that among the original staffs 20.78% and 79.22% reported less
and more than 3 minutes respectively of the median call time whereas among the replacement
Paraphrase This Document
Need a fresh take? Get an instant paraphrase of this document with our AI Paraphraser

5
staffs 59.60% and 40.40% reported less and more than 3 minutes respectively of the median call
time.
phat 1 – phat 2=0. 7922 – 0 . 4 040=0. 3882
As evident, the originals reported a higher percentage of staffs that recorded more than 3
minutes median call time compared to the replacement staffs.
Call Centre 2
descriptive sample statistics
no yes total
original count 11 73 84
original % 13.10% 86.90% 100.00%
replacement count 64 28 92
replacement % 69.57% 30.43% 100.00%
The table above shows that among the original staffs 13.1% and 86.9% reported less and
more than 3 minutes respectively of the median call time whereas among the replacement staffs
69.57% and 30.43% reported less and more than 3 minutes respectively of the median call time.
phat 1 – phat 2=0.8690 – 0.3043=0.5647
As evident, the originals reported a higher percentage of staffs that recorded more than 3
minutes median call time compared to the replacement staffs.
Generally, more original staffs in centre 2 recorded more than 3 minues compared to
centre 1.
Investigate the relationship between the variables “median call time?” and “number of
complaints?”
Call Centre 1
descriptive sample statistics
sample size 176
sample Slope 10.128445
sample intercept -0.470656
sample correlation r 0.9161148

6
The table above exhibits a positive strong correlation of 0.9161 between median call time
and number of complaints recorded.
2.2 2.4 2.6 2.8 3 3.2 3.4 3.6 3.8 4 4.2
0
10
20
30
40
50
f(x) = 10.1284448336719 x − 0.470656000382892
R² = 0.839266394263981
Scatter Plot
Median Call Time
number of complaints
Similarly, the graph above shows a positive correlation
Call Centre 2
descriptive sample statistics
sample size 176
sample Slope 9.9802718
sample intercept 0.4392616
sample correlation r 0.8836459
The table above exhibits a positive strong correlation of 0.8836 between median call time
and number of complaints recorded.
2.2 2.4 2.6 2.8 3 3.2 3.4 3.6 3.8 4 4.2
0
10
20
30
40
50
f(x) = 9.9802718347668 x + 0.439261637156417
R² = 0.780830153824964
Scatter Plots
Median Call time
Number of complaints
⊘ This is a preview!⊘
Do you want full access?
Subscribe today to unlock all pages.

Trusted by 1+ million students worldwide

7
Similarly, the graph above shows a positive correlation.
It is evident that centre 1 reported a higher correlation value compared to centre 2.
Z-score Score: Call Centre 1
As shown above the originals in centre 1 had a sample size of 77 and sample mean of
3.36857 minutes.
Given population mean (μ) = 3
Standard deviation σ =1.1
Z= x−μ
( σ
√ n )= 3.36857−3
1.1
√ 77
=2.9402
As shown above the replacements in centre 1 had a sample size of 99 and sample mean of
2.87192 minutes.
Given population mean (μ) = 3
Standard deviation σ =1.1
Z= x−μ
( σ
√ n ) = 2.87192−3
1.1
√ 99
=−1.0217
Confidence Interval: Call centre 1
As shown above the originals in centre 1 had a sample size of 77 and sample proportion
of staffs that have median call time above 3 minutes of 0.7922
CI = p±
Z α
2
∗σ
√n =0.7922 ± 1.96∗0.7922∗0.2078
√77 =0.7554 , 0.8290
Therefore, the confidence interval for originals is 75.54% and 82.90%
As shown above the replacements in centre 1 had a sample size of 99 and sample
proportion of staffs that have median call time above 3 minutes of 0.4040
Paraphrase This Document
Need a fresh take? Get an instant paraphrase of this document with our AI Paraphraser

8
CI = p±
Z α
2
∗σ
√n =0.4040 ± 1.96∗0.4040∗0.5960
√99 =0.3566 , 0.4514
Therefore, the confidence interval for originals is 35.66% and 45.14%.
Inferential Statistics
Evidence for the claim there is a relationship between the variables “Original staff or
Replacement staff?” and “Median call time?”
Call centre 1
Inferential statistics
Estimate of the difference between population means
xbar1-xbar2
0.49665
standard error of estimate xbar1-xbar2
0.05722
t test stat df two sided pvalue
8.68 163 3.9E-15
To calculate the p-value H0:μ1=μ2 is assumed to be true
since the test is two sided H1 is H1:μ1≠μ2
At significance level 0.05
It is evident that the p-value 3.9E-15 is less than the significance level 0.05 thus we reject
the null hypothesis and conclude that there is mean difference between staffs and median call
time.
Call Centre 2
Inferential statistics
Estimate of the difference between population means
xbar1-xbar2
0.57251
standard error of estimate xbar1-xbar2
0.0534
t test stat df two sided pvalue
10.7221 166 1E-20
To calculate the p-value H0:μ1=μ2 is assumed to be true
since the test is two sided H1 is H1:μ1≠μ2
At significance level 0.05

9
It is evident that the p-value 1E-15 is less than the significance level 0.05 thus we reject
the null hypothesis and conclude that there is mean difference between staffs and median call
time.
Generally, both centre 1 and 2 are significant in showing the relationship between staffs
and median call time.
Evidence for the claim there is a relationship between the variables “Original staff or
Replacement staff?” and “median above 3 minutes?”
Inferential statistics
n1 n2 phat 1 phat 2
77 99 0.79221 0.4040404
Estimate of the difference between population proportions
phat1-phat2
0.388167388
standard error of estimate test stat two sided pvalue
0.075140144 5.1659122 2.393E-07
To calculate the p-value H0:p1=p2 is assumed to be true
since the test is two sided H1 is H1:p1≠p2
At significance level 0.05
It is evident that the p-value 2.393E-7 is less than the significance level 0.05 thus we
reject the null hypothesis and conclude that there is proportion difference between staffs and
median above 3 minutes.
Cal Centre 2
Inferential statistics
n1 n2 phat 1 phat 2
84 92 0.86905 0.3043478
Estimate of the difference between population proportions
phat1-phat2
0.564699793
standard error of estimate test stat two sided pvalue
0.074627936 7.566868741 3.823E-14
To calculate the p-value H0:p1=p2 is assumed to be true
since the test is two sided H1 is H1:p1≠p2
At significance level 0.05
⊘ This is a preview!⊘
Do you want full access?
Subscribe today to unlock all pages.

Trusted by 1+ million students worldwide

10
It is evident that the p-value 3.823E-14 is less than the significance level 0.05 thus we
reject the null hypothesis and conclude that there is proportion difference between staffs and
median above 3 minutes
Generally, both centre 1 and 2 are significant in showing the relationship between staffs
and median above 3 minutes.
Evidence for the claim there is a relationship between the variables “median call time?”
and “number of complaints?”
Call Centre 1
Inferential statistics
paste this into the word file and add comments
correlation r 0.9161148
R square 0.8392664
standard error of slope 0.336025
test stat of slope 30.14194
two sided p-value for slope 5.622E-71
To calculate the p-value H0:population slope =0 is assumed to be true
since the test is two sided H1 is H1:population slope ≠0
At significance level 0.05
It is evident that the p-value 5.622E-71 is less than the significance level 0.05 thus we
reject the null hypothesis and conclude that there is a relationship between median call time and
number of complaints.
Call Centre 2
Inferential statistics
paste this into the word file and add comments
correlation r 0.8836459
R square 0.7808302
standard error of slope 0.4008481
test stat of slope 24.897888
two sided p-value for slope 3.034E-59
To calculate the p-value H0:population slope =0 is assumed to be true
since the test is two sided H1 is H1:population slope ≠0
At significance level 0.05
Paraphrase This Document
Need a fresh take? Get an instant paraphrase of this document with our AI Paraphraser

11
It is evident that the p-value 3.034E-59 is less than the significance level 0.05 thus we
reject the null hypothesis and conclude that there is a relationship between median call time and
number of complaints.
Generally, both centre 1 and 2 are significant in showing the relationship between median
call time and number of complaints.
Conclusion
Generally, the results above indicate that there is a strong evidence that the results above
also apply to the whole population of call centre 1. However, there is a stronger evidence that the
results above also apply to the whole population of call centre 2. Notably, the existing dataset
does not have any information that explains why the call centres are different. Therefore, more
variables could be gathered to find out why the centre 2 is more successful compared to centre1.
1 out of 11
Related Documents
Your All-in-One AI-Powered Toolkit for Academic Success.
+13062052269
info@desklib.com
Available 24*7 on WhatsApp / Email
Unlock your academic potential
Copyright © 2020–2025 A2Z Services. All Rights Reserved. Developed and managed by ZUCOL.


