Market Research Report: Assessing Customer Behavior on New Soap
VerifiedAdded on 2019/10/31
|16
|2606
|270
Report
AI Summary
This market research report investigates customer behavior towards a new soap brand, examining product acceptance and preferences. The study, based on a survey of 20 customers, uses questionnaires and statistical analysis to understand customer perceptions of the soap, including its solid and liquid versions. Key findings reveal that 70% of respondents did not have an alternative soap, while the remaining 30% should be targeted to encourage them to switch. The analysis also highlights the preference for the liquid version of the soap. The report provides descriptive statistics on variables such as age, gender, product liking, and income, with the goal of providing valuable insights for the brand's marketing strategies. The data was collected through primary methods using questionnaires, and analyzed using descriptive and inferential statistics.
Market research report 1
Assessment of customers’ behaviour towards a new brand of soap
in the market
Reported by
To
Dr
1
Assessment of customers’ behaviour towards a new brand of soap
in the market
Reported by
To
Dr
1
Paraphrase This Document
Need a fresh take? Get an instant paraphrase of this document with our AI Paraphraser
Market research report 2
Executive Summary
My main ain of this report was enable me understand the behaviour of customers towards a
new brand of soap that had just been introduced into the market. I used a sample of 20
customers in this survey report. The data was collected from them using questionnaires and
data analysed using excel. Descriptive statistics and inferential statistics were used to make
decisions. The survey found that that 70% of the respondents interviewed attested of not
having an alternative soap. However, the 30% that had alternative soap should be encouraged
by the manufacturing company of the benefits of the new soap. When it came to the version
of the two soaps (solid and liquid), the two versions are liked differently by the customers.
Most customers prefer version two which is liquid soap compared to version one. It is
therefore important for the management to focus more on producing version 2 of the soap
while at the same time conducting marketing for version 1 of the same soap.
2
Market research report 3
Contents
Executive Summary...............................................................................................................................2
Introduction........................................................................................................................................4
Method of data collection......................................................................................................................4
Summary of the data set........................................................................................................................5
Gender...............................................................................................................................................6
Age....................................................................................................................................................6
Product liking....................................................................................................................................7
Version of the soap............................................................................................................................8
Origin.................................................................................................................................................9
Presence of substitute......................................................................................................................10
Data analysis - descriptive statistics....................................................................................................11
Hypothesis testing...............................................................................................................................13
Conclusion and recommendations.......................................................................................................14
3
⊘ This is a preview!⊘
Do you want full access?
Subscribe today to unlock all pages.
Trusted by 1+ million students worldwide
Market research report 4
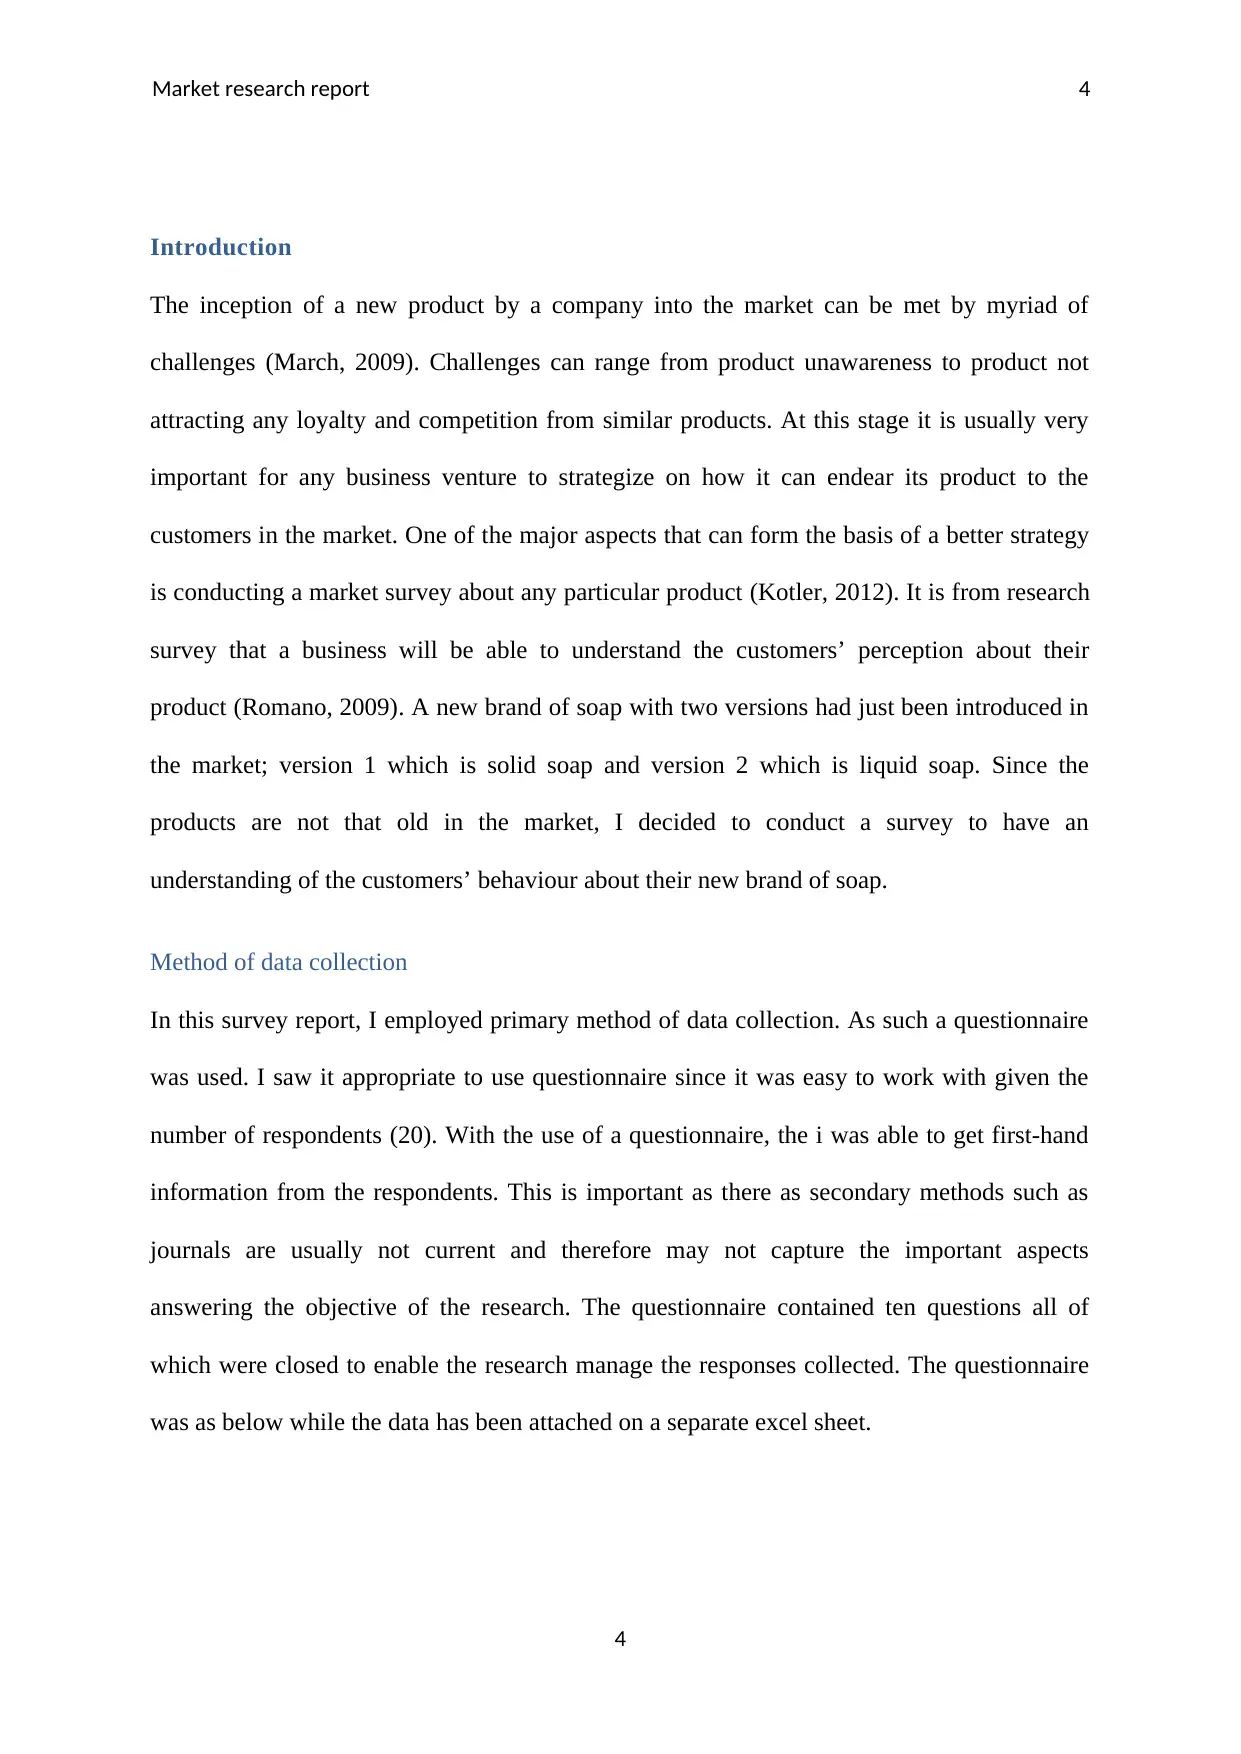
Introduction
The inception of a new product by a company into the market can be met by myriad of
challenges (March, 2009). Challenges can range from product unawareness to product not
attracting any loyalty and competition from similar products. At this stage it is usually very
important for any business venture to strategize on how it can endear its product to the
customers in the market. One of the major aspects that can form the basis of a better strategy
is conducting a market survey about any particular product (Kotler, 2012). It is from research
survey that a business will be able to understand the customers’ perception about their
product (Romano, 2009). A new brand of soap with two versions had just been introduced in
the market; version 1 which is solid soap and version 2 which is liquid soap. Since the
products are not that old in the market, I decided to conduct a survey to have an
understanding of the customers’ behaviour about their new brand of soap.
Method of data collection
In this survey report, I employed primary method of data collection. As such a questionnaire
was used. I saw it appropriate to use questionnaire since it was easy to work with given the
number of respondents (20). With the use of a questionnaire, the i was able to get first-hand
information from the respondents. This is important as there as secondary methods such as
journals are usually not current and therefore may not capture the important aspects
answering the objective of the research. The questionnaire contained ten questions all of
which were closed to enable the research manage the responses collected. The questionnaire
was as below while the data has been attached on a separate excel sheet.
4
Paraphrase This Document
Need a fresh take? Get an instant paraphrase of this document with our AI Paraphraser
Market research report 5
Which
version
is the
best?
Gender
?
ag
e
Do they
like
product
?
How
much
would
pay?
Are
they
old? origin
substitut
e
monthl
y
income
dollars
how long
have you
used the
product
(months)
version
2 female 28 like 3 old Brisbane no 370 30
version
2 female 43 like 3.2 old
Melbourn
e no 364 25
version
2 male 24 like 3.3 young Sidney yes 538 40
version
1 male 31 like 3 old Sidney no 460 32
version
2 male 47 like 3.2 old Brisbane no 436 36
neither female 49 hate 0.5 young
Melbourn
e no 546 18
neither female 31 hate 0.3 old Sidney yes 330 12
version
1 female 22 like 3 young Brisbane no 596 26
version
1 male 40 like 3.2 old
Melbourn
e no 467 26
version
2 male 21 like 3 old
Melbourn
e no 206 28
neither male 39 hate 0.4 old Sidney yes 508 15
neither male 43 hate 0.5 old Sidney yes 471 20
neither female 38 like 3.3 young
Melbourn
e no 216 27
version
2 male 32 like 3.3 young Sidney no 262 29
neither male 33 hate 0.3 old Sidney yes 565 20
neither female 35 hate 0.4 young Brisbane yes 228 20
version
1 male 26 like 3.3 old
Melbourn
e no 286 21
version
1 female 39 like 3.1 old Sidney no 202 30
version
1 female 36 like 3.2 young Brisbane no 531 18
version
2 male 45 like 3.2 old Brisbane no 441 12
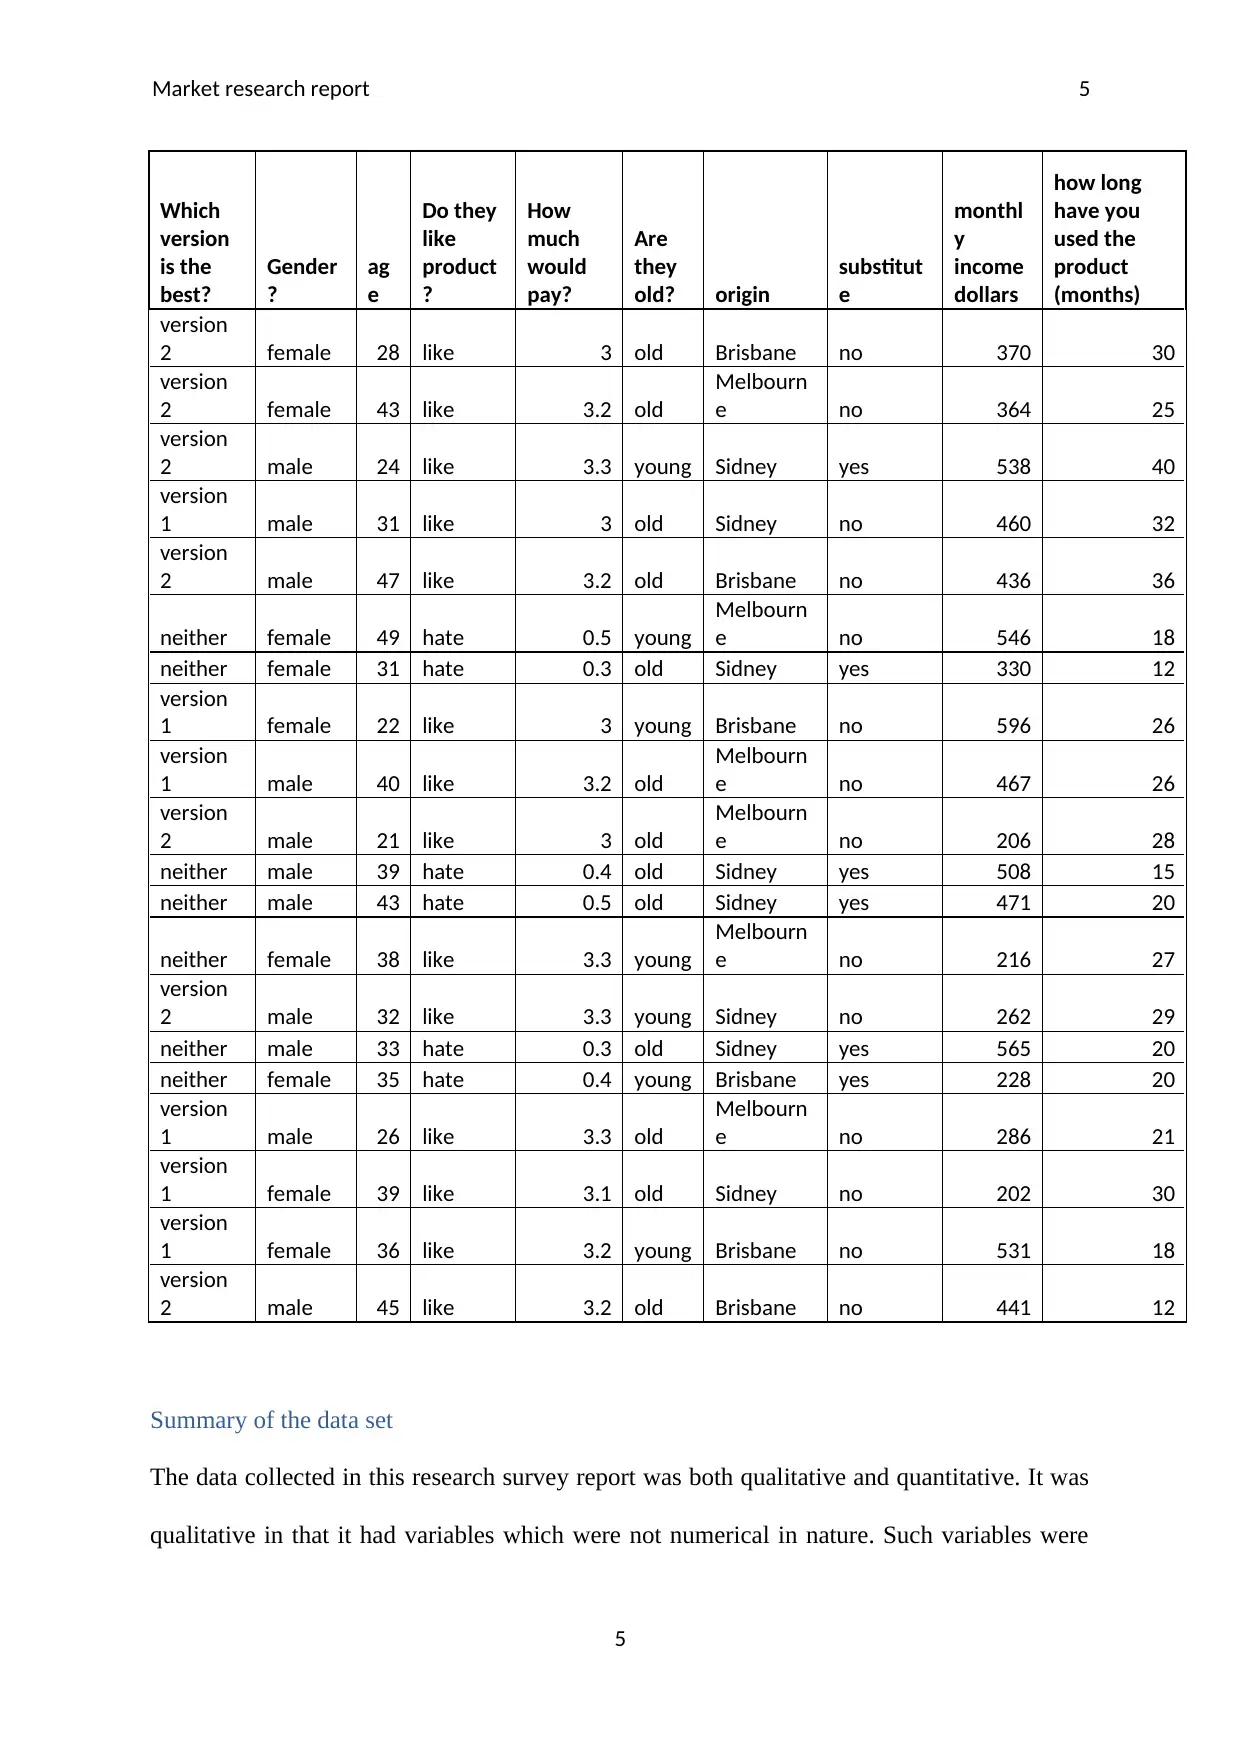
Summary of the data set
The data collected in this research survey report was both qualitative and quantitative. It was
qualitative in that it had variables which were not numerical in nature. Such variables were
5
Which
version
is the
best?
Gender
?
ag
e
Do they
like
product
?
How
much
would
pay?
Are
they
old? origin
substitut
e
monthl
y
income
dollars
how long
have you
used the
product
(months)
version
2 female 28 like 3 old Brisbane no 370 30
version
2 female 43 like 3.2 old
Melbourn
e no 364 25
version
2 male 24 like 3.3 young Sidney yes 538 40
version
1 male 31 like 3 old Sidney no 460 32
version
2 male 47 like 3.2 old Brisbane no 436 36
neither female 49 hate 0.5 young
Melbourn
e no 546 18
neither female 31 hate 0.3 old Sidney yes 330 12
version
1 female 22 like 3 young Brisbane no 596 26
version
1 male 40 like 3.2 old
Melbourn
e no 467 26
version
2 male 21 like 3 old
Melbourn
e no 206 28
neither male 39 hate 0.4 old Sidney yes 508 15
neither male 43 hate 0.5 old Sidney yes 471 20
neither female 38 like 3.3 young
Melbourn
e no 216 27
version
2 male 32 like 3.3 young Sidney no 262 29
neither male 33 hate 0.3 old Sidney yes 565 20
neither female 35 hate 0.4 young Brisbane yes 228 20
version
1 male 26 like 3.3 old
Melbourn
e no 286 21
version
1 female 39 like 3.1 old Sidney no 202 30
version
1 female 36 like 3.2 young Brisbane no 531 18
version
2 male 45 like 3.2 old Brisbane no 441 12
Summary of the data set
The data collected in this research survey report was both qualitative and quantitative. It was
qualitative in that it had variables which were not numerical in nature. Such variables were
5
Market research report 6
gender, place of origin, product liking and product version. On the other hand, the
quantitative variables included the amount the respondents were willing to pay for the new
soap, their monthly income and age. With the categorical variable “gender”, the research
survey is able to establish product version liking by gender or whether there is a correlation
between gender and other variables such as duration of using the new soap. The numerical
variable “willing to pay” will help the research survey determine the amount of money people
were willing to part with to purchase the new soap brand. The monthly income of the
respondents will aid the research establish whether there is a correlation between the amount
respondents were willing to pay and their monthly salaries.
Gender
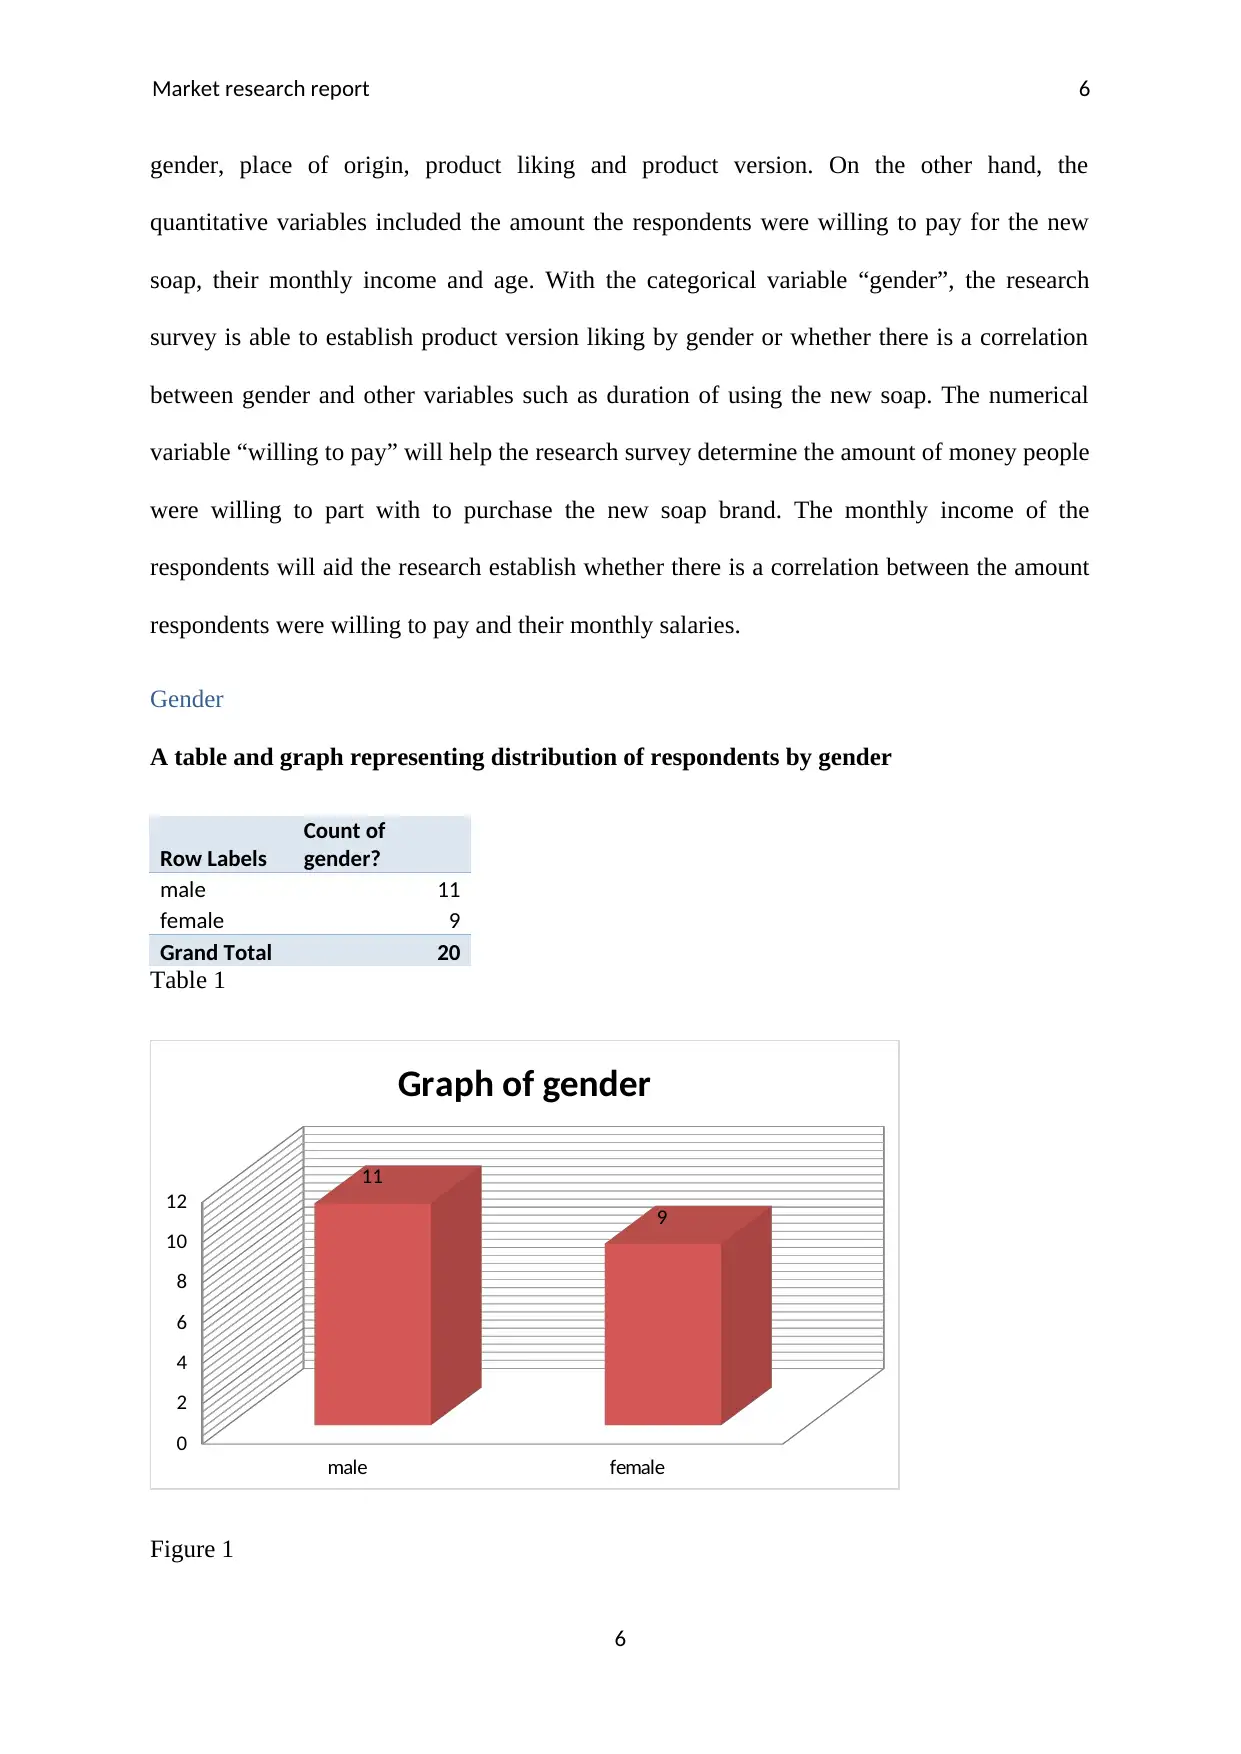
A table and graph representing distribution of respondents by gender
Row Labels
Count of
gender?
male 11
female 9
Grand Total 20
Table 1
male female
0
2
4
6
8
10
12
11
9
Graph of gender
Figure 1
6
gender, place of origin, product liking and product version. On the other hand, the
quantitative variables included the amount the respondents were willing to pay for the new
soap, their monthly income and age. With the categorical variable “gender”, the research
survey is able to establish product version liking by gender or whether there is a correlation
between gender and other variables such as duration of using the new soap. The numerical
variable “willing to pay” will help the research survey determine the amount of money people
were willing to part with to purchase the new soap brand. The monthly income of the
respondents will aid the research establish whether there is a correlation between the amount
respondents were willing to pay and their monthly salaries.
Gender
A table and graph representing distribution of respondents by gender
Row Labels
Count of
gender?
male 11
female 9
Grand Total 20
Table 1
male female
0
2
4
6
8
10
12
11
9
Graph of gender
Figure 1
6
⊘ This is a preview!⊘
Do you want full access?
Subscribe today to unlock all pages.
Trusted by 1+ million students worldwide
Market research report 7
It can be observed from the table and graph above that the number of males and females who
took part in the survey was not the same. The number of males was more than the number of
females. The males were 11 in number while the females were 9 in number. Therefore the
female represented 45% of the total number of respondents while the males represented 55%
of the total number of respondents.
Age
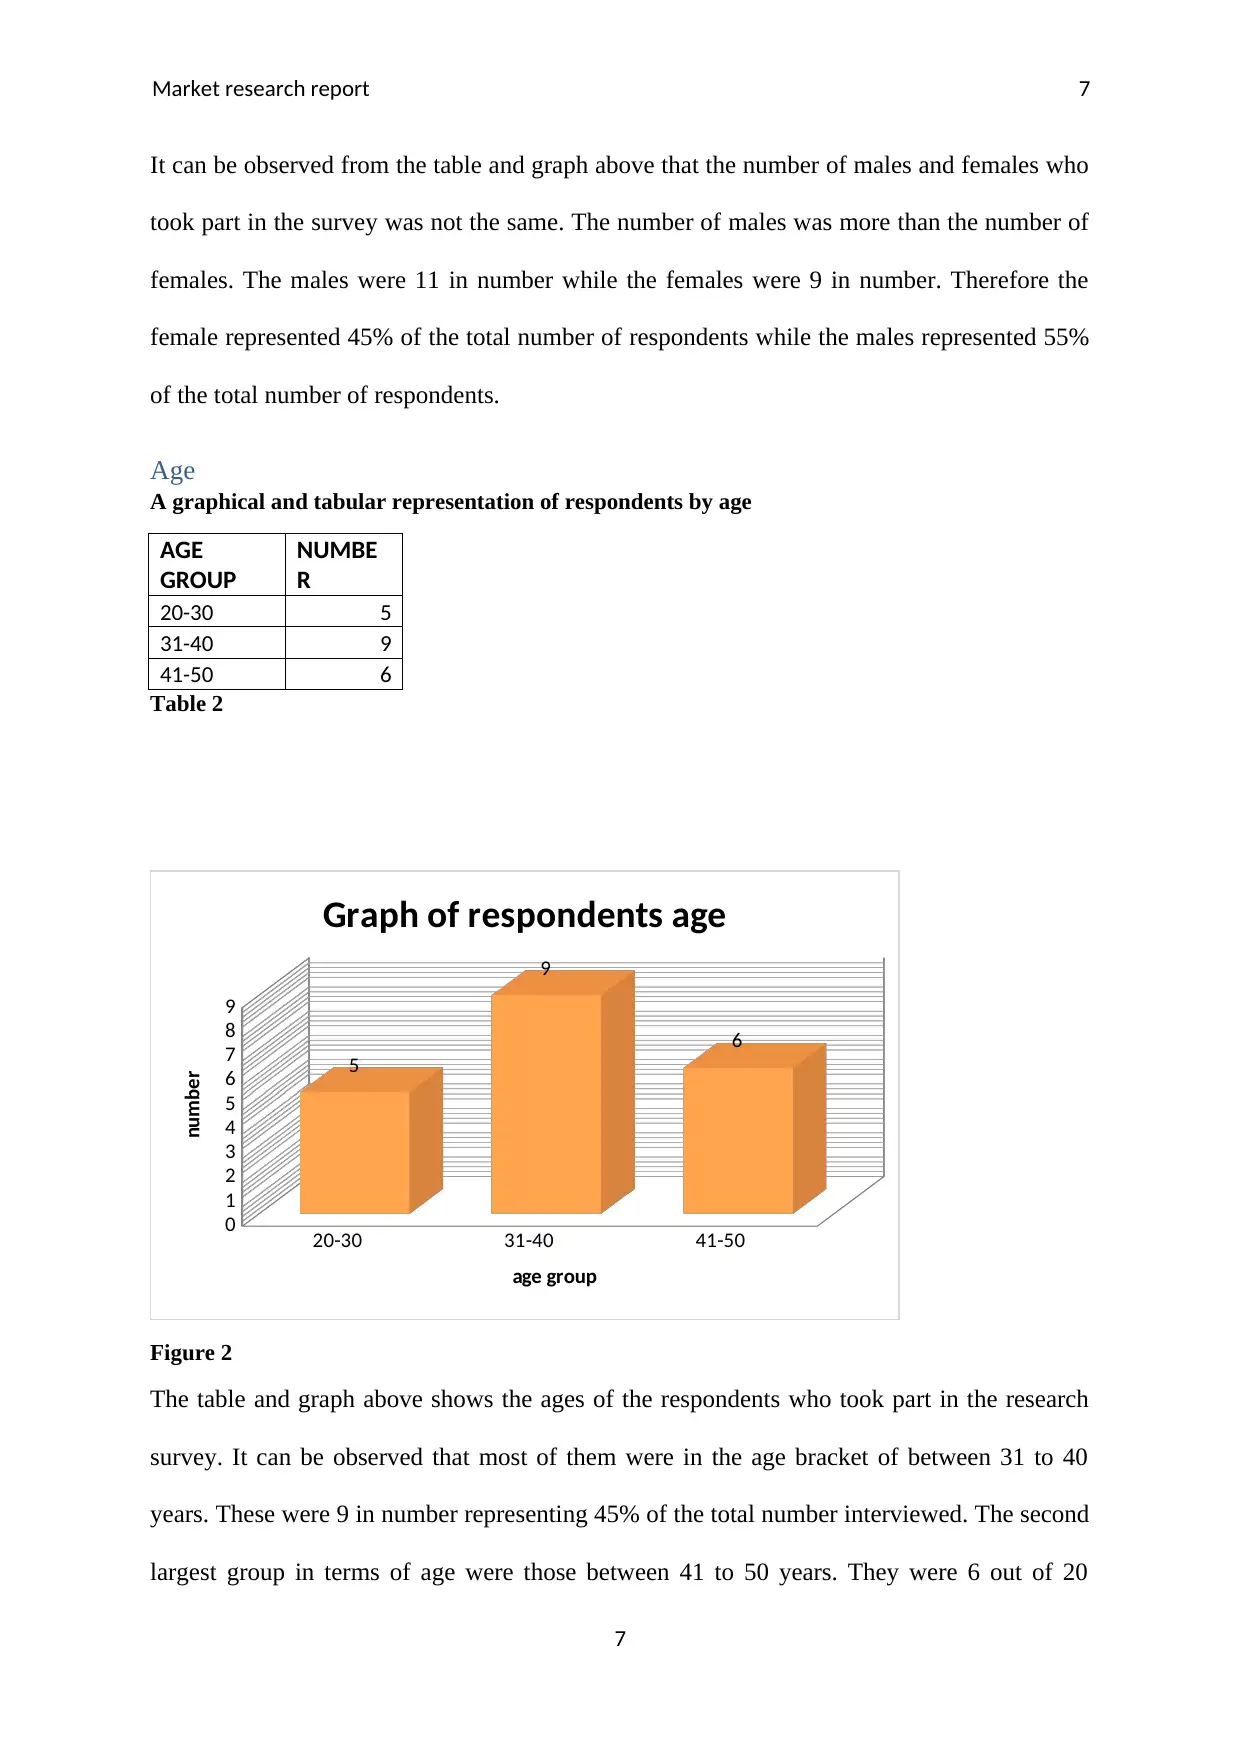
A graphical and tabular representation of respondents by age
AGE
GROUP
NUMBE
R
20-30 5
31-40 9
41-50 6
Table 2
20-30 31-40 41-50
0
1
2
3
4
5
6
7
8
9
5
9
6
Graph of respondents age
age group
number
Figure 2
The table and graph above shows the ages of the respondents who took part in the research
survey. It can be observed that most of them were in the age bracket of between 31 to 40
years. These were 9 in number representing 45% of the total number interviewed. The second
largest group in terms of age were those between 41 to 50 years. They were 6 out of 20
7
It can be observed from the table and graph above that the number of males and females who
took part in the survey was not the same. The number of males was more than the number of
females. The males were 11 in number while the females were 9 in number. Therefore the
female represented 45% of the total number of respondents while the males represented 55%
of the total number of respondents.
Age
A graphical and tabular representation of respondents by age
AGE
GROUP
NUMBE
R
20-30 5
31-40 9
41-50 6
Table 2
20-30 31-40 41-50
0
1
2
3
4
5
6
7
8
9
5
9
6
Graph of respondents age
age group
number
Figure 2
The table and graph above shows the ages of the respondents who took part in the research
survey. It can be observed that most of them were in the age bracket of between 31 to 40
years. These were 9 in number representing 45% of the total number interviewed. The second
largest group in terms of age were those between 41 to 50 years. They were 6 out of 20
7
Paraphrase This Document
Need a fresh take? Get an instant paraphrase of this document with our AI Paraphraser
Market research report 8
interviewed representing 30%. The least in number were those that were between 20 to 30
years. They were 5 in number therefore representing 25% of the total number of the
respondents.
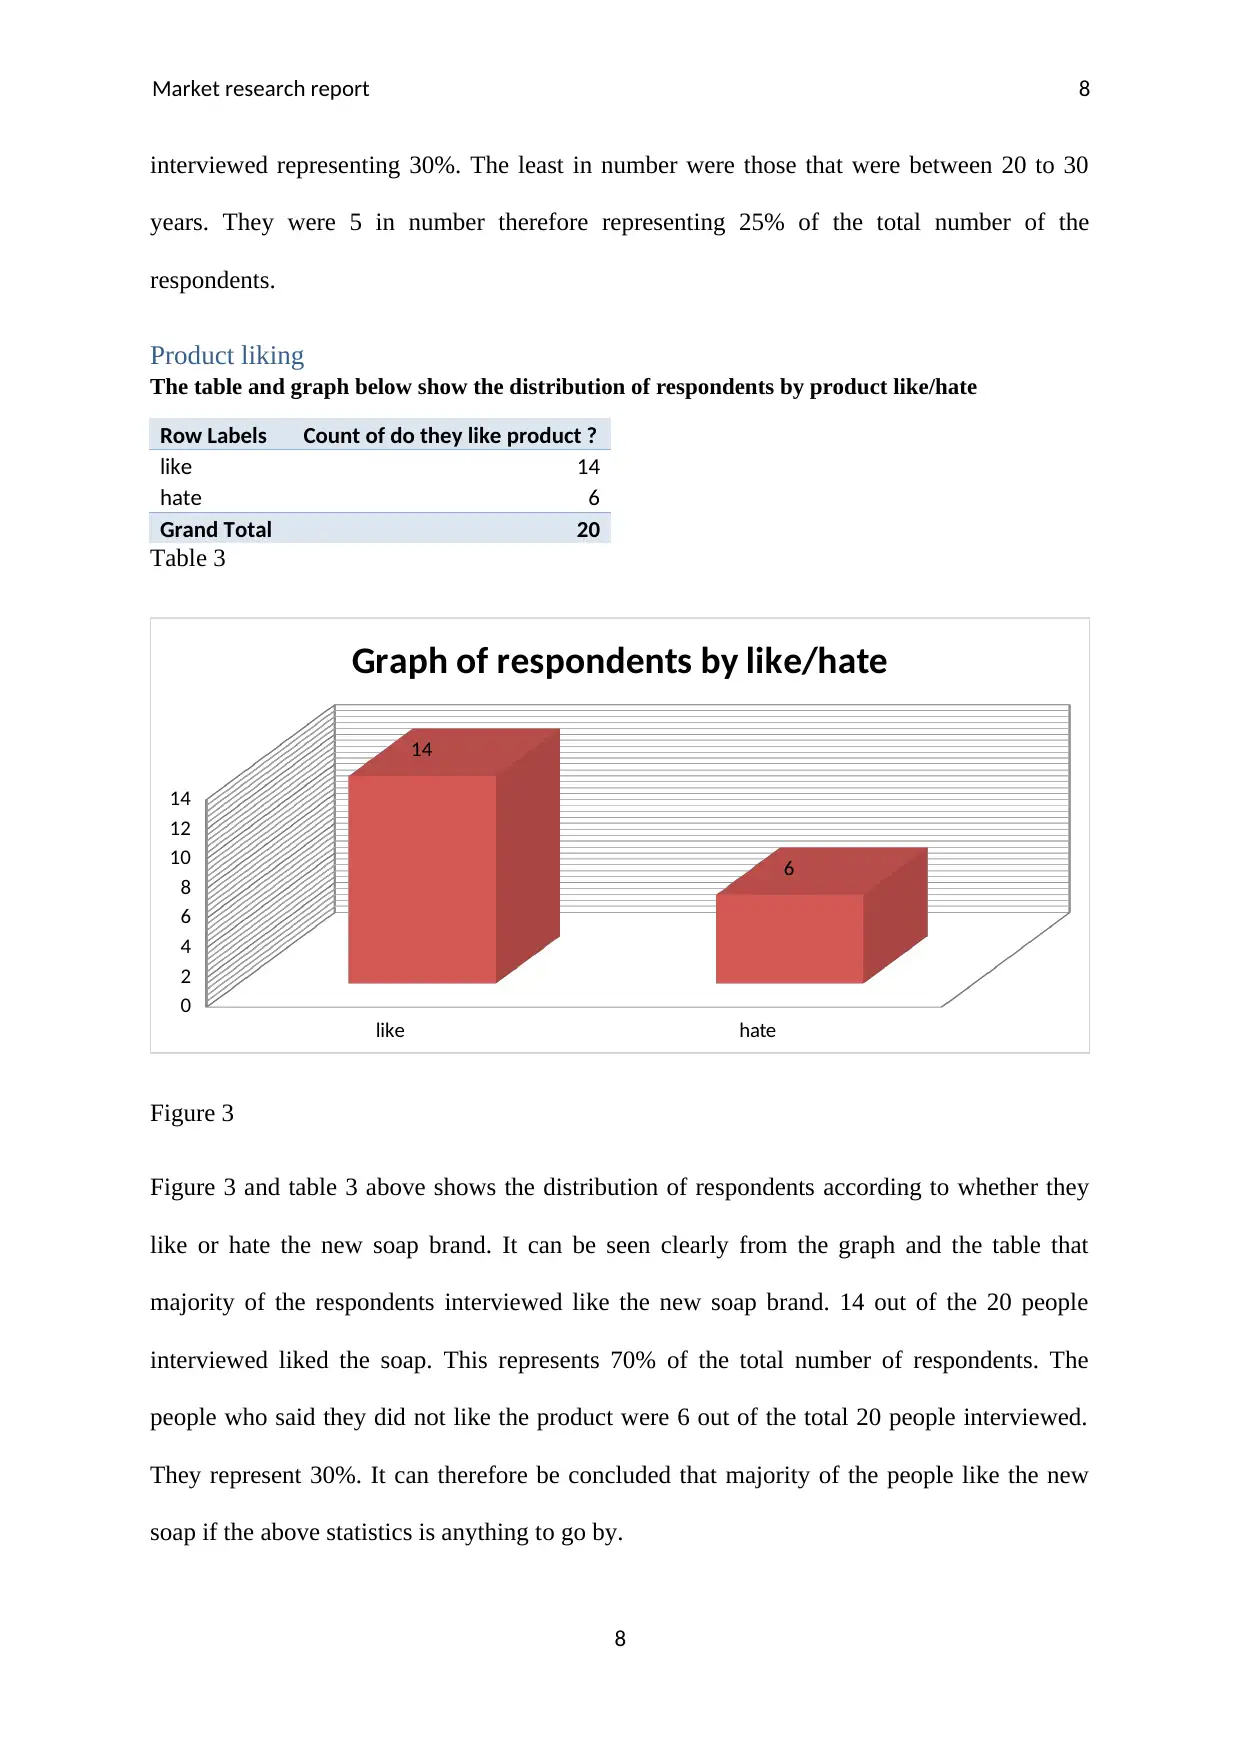
Product liking
The table and graph below show the distribution of respondents by product like/hate
Row Labels Count of do they like product ?
like 14
hate 6
Grand Total 20
Table 3
like hate
0
2
4
6
8
10
12
14
14
6
Graph of respondents by like/hate
Figure 3
Figure 3 and table 3 above shows the distribution of respondents according to whether they
like or hate the new soap brand. It can be seen clearly from the graph and the table that
majority of the respondents interviewed like the new soap brand. 14 out of the 20 people
interviewed liked the soap. This represents 70% of the total number of respondents. The
people who said they did not like the product were 6 out of the total 20 people interviewed.
They represent 30%. It can therefore be concluded that majority of the people like the new
soap if the above statistics is anything to go by.
8
interviewed representing 30%. The least in number were those that were between 20 to 30
years. They were 5 in number therefore representing 25% of the total number of the
respondents.
Product liking
The table and graph below show the distribution of respondents by product like/hate
Row Labels Count of do they like product ?
like 14
hate 6
Grand Total 20
Table 3
like hate
0
2
4
6
8
10
12
14
14
6
Graph of respondents by like/hate
Figure 3
Figure 3 and table 3 above shows the distribution of respondents according to whether they
like or hate the new soap brand. It can be seen clearly from the graph and the table that
majority of the respondents interviewed like the new soap brand. 14 out of the 20 people
interviewed liked the soap. This represents 70% of the total number of respondents. The
people who said they did not like the product were 6 out of the total 20 people interviewed.
They represent 30%. It can therefore be concluded that majority of the people like the new
soap if the above statistics is anything to go by.
8
Market research report 9
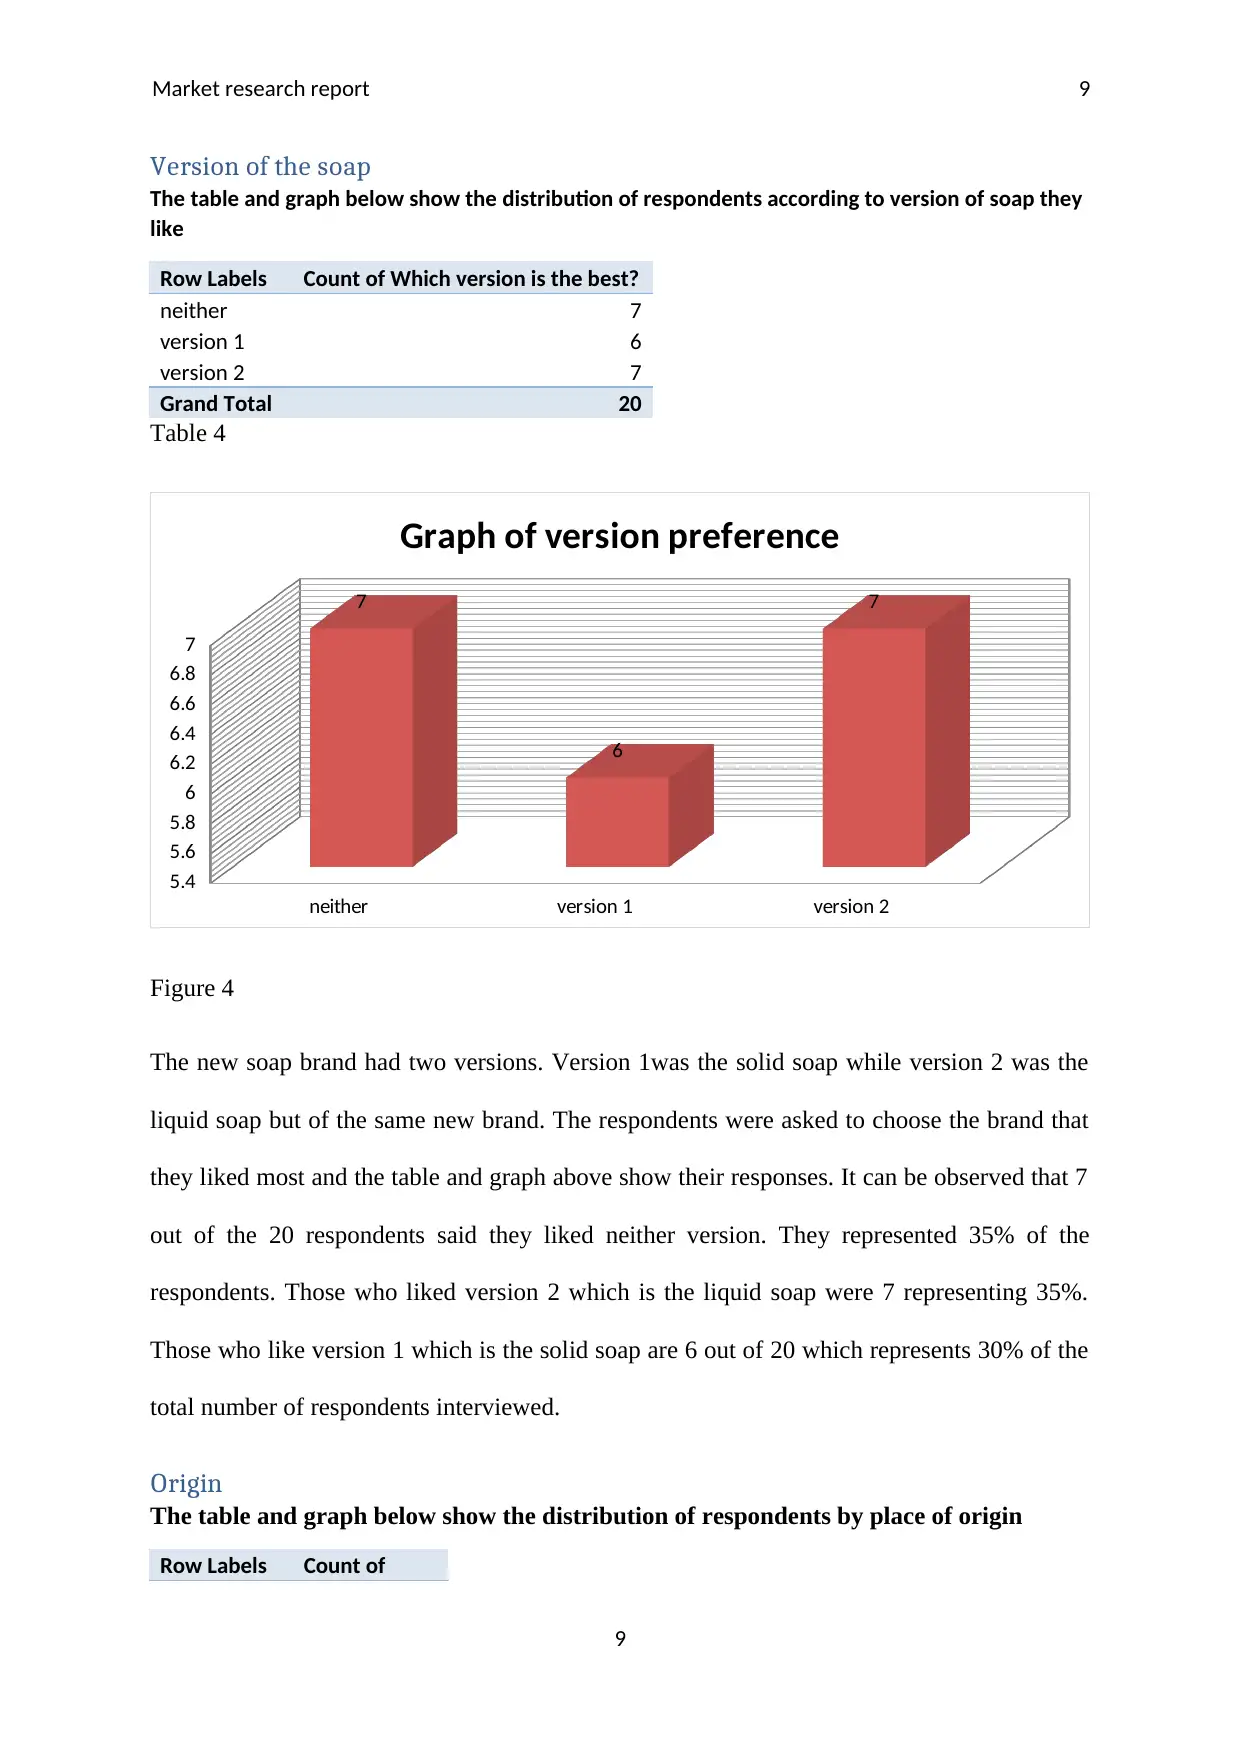
Version of the soap
The table and graph below show the distribution of respondents according to version of soap they
like
Row Labels Count of Which version is the best?
neither 7
version 1 6
version 2 7
Grand Total 20
Table 4
neither version 1 version 2
5.4
5.6
5.8
6
6.2
6.4
6.6
6.8
7
7
6
7
Graph of version preference
Figure 4
The new soap brand had two versions. Version 1was the solid soap while version 2 was the
liquid soap but of the same new brand. The respondents were asked to choose the brand that
they liked most and the table and graph above show their responses. It can be observed that 7
out of the 20 respondents said they liked neither version. They represented 35% of the
respondents. Those who liked version 2 which is the liquid soap were 7 representing 35%.
Those who like version 1 which is the solid soap are 6 out of 20 which represents 30% of the
total number of respondents interviewed.
Origin
The table and graph below show the distribution of respondents by place of origin
Row Labels Count of
9
Version of the soap
The table and graph below show the distribution of respondents according to version of soap they
like
Row Labels Count of Which version is the best?
neither 7
version 1 6
version 2 7
Grand Total 20
Table 4
neither version 1 version 2
5.4
5.6
5.8
6
6.2
6.4
6.6
6.8
7
7
6
7
Graph of version preference
Figure 4
The new soap brand had two versions. Version 1was the solid soap while version 2 was the
liquid soap but of the same new brand. The respondents were asked to choose the brand that
they liked most and the table and graph above show their responses. It can be observed that 7
out of the 20 respondents said they liked neither version. They represented 35% of the
respondents. Those who liked version 2 which is the liquid soap were 7 representing 35%.
Those who like version 1 which is the solid soap are 6 out of 20 which represents 30% of the
total number of respondents interviewed.
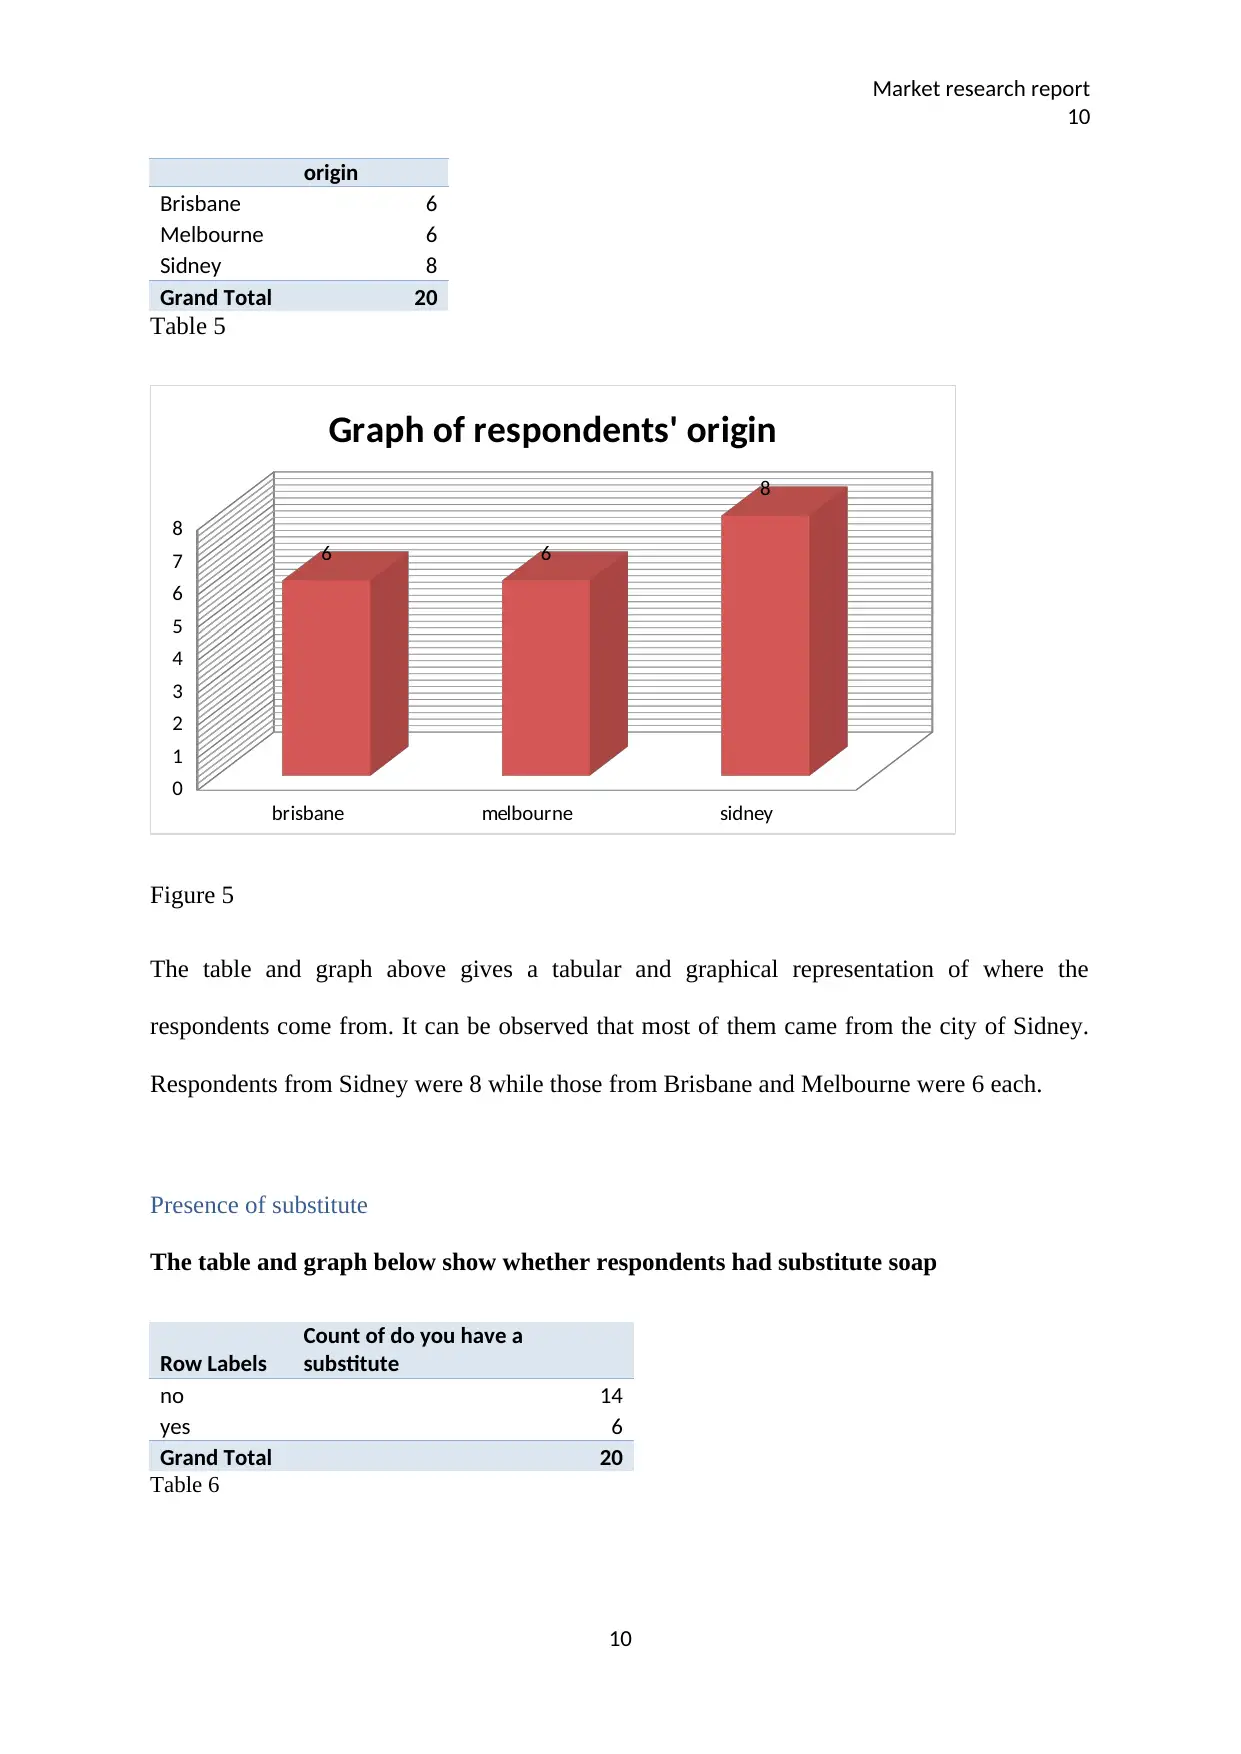
Origin
The table and graph below show the distribution of respondents by place of origin
Row Labels Count of
9
⊘ This is a preview!⊘
Do you want full access?
Subscribe today to unlock all pages.
Trusted by 1+ million students worldwide
Market research report
10
origin
Brisbane 6
Melbourne 6
Sidney 8
Grand Total 20
Table 5
brisbane melbourne sidney
0
1
2
3
4
5
6
7
8
6 6
8
Graph of respondents' origin
Figure 5
The table and graph above gives a tabular and graphical representation of where the
respondents come from. It can be observed that most of them came from the city of Sidney.
Respondents from Sidney were 8 while those from Brisbane and Melbourne were 6 each.
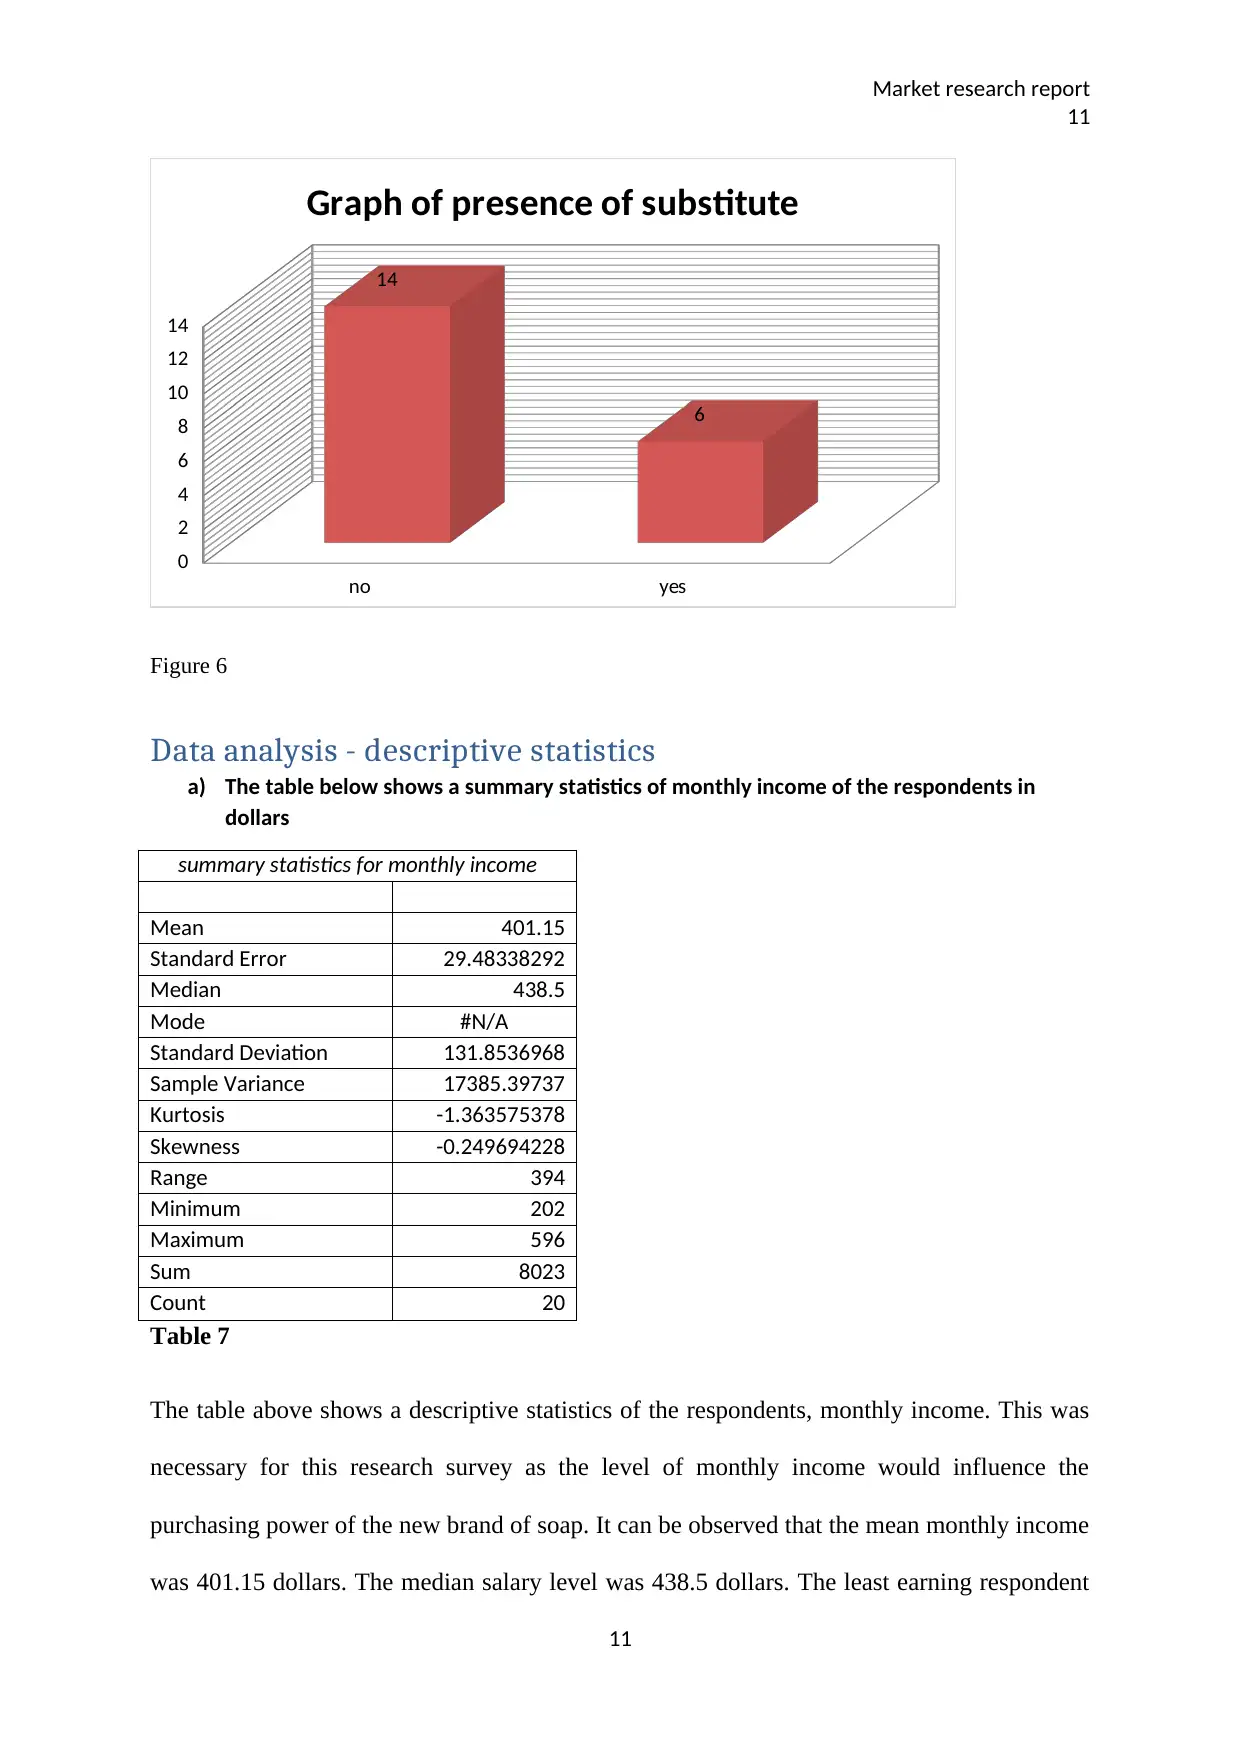
Presence of substitute
The table and graph below show whether respondents had substitute soap
Row Labels
Count of do you have a
substitute
no 14
yes 6
Grand Total 20
Table 6
10
10
origin
Brisbane 6
Melbourne 6
Sidney 8
Grand Total 20
Table 5
brisbane melbourne sidney
0
1
2
3
4
5
6
7
8
6 6
8
Graph of respondents' origin
Figure 5
The table and graph above gives a tabular and graphical representation of where the
respondents come from. It can be observed that most of them came from the city of Sidney.
Respondents from Sidney were 8 while those from Brisbane and Melbourne were 6 each.
Presence of substitute
The table and graph below show whether respondents had substitute soap
Row Labels
Count of do you have a
substitute
no 14
yes 6
Grand Total 20
Table 6
10
Paraphrase This Document
Need a fresh take? Get an instant paraphrase of this document with our AI Paraphraser
Market research report
11
no yes
0
2
4
6
8
10
12
14
14
6
Graph of presence of substitute
Figure 6
Data analysis - descriptive statistics
a) The table below shows a summary statistics of monthly income of the respondents in
dollars
summary statistics for monthly income
Mean 401.15
Standard Error 29.48338292
Median 438.5
Mode #N/A
Standard Deviation 131.8536968
Sample Variance 17385.39737
Kurtosis -1.363575378
Skewness -0.249694228
Range 394
Minimum 202
Maximum 596
Sum 8023
Count 20
Table 7
The table above shows a descriptive statistics of the respondents, monthly income. This was
necessary for this research survey as the level of monthly income would influence the
purchasing power of the new brand of soap. It can be observed that the mean monthly income
was 401.15 dollars. The median salary level was 438.5 dollars. The least earning respondent
11
11
no yes
0
2
4
6
8
10
12
14
14
6
Graph of presence of substitute
Figure 6
Data analysis - descriptive statistics
a) The table below shows a summary statistics of monthly income of the respondents in
dollars
summary statistics for monthly income
Mean 401.15
Standard Error 29.48338292
Median 438.5
Mode #N/A
Standard Deviation 131.8536968
Sample Variance 17385.39737
Kurtosis -1.363575378
Skewness -0.249694228
Range 394
Minimum 202
Maximum 596
Sum 8023
Count 20
Table 7
The table above shows a descriptive statistics of the respondents, monthly income. This was
necessary for this research survey as the level of monthly income would influence the
purchasing power of the new brand of soap. It can be observed that the mean monthly income
was 401.15 dollars. The median salary level was 438.5 dollars. The least earning respondent
11
Market research report
12
earned 202 dollars per month while the highest earning respondent got 596 dollars in a
month.
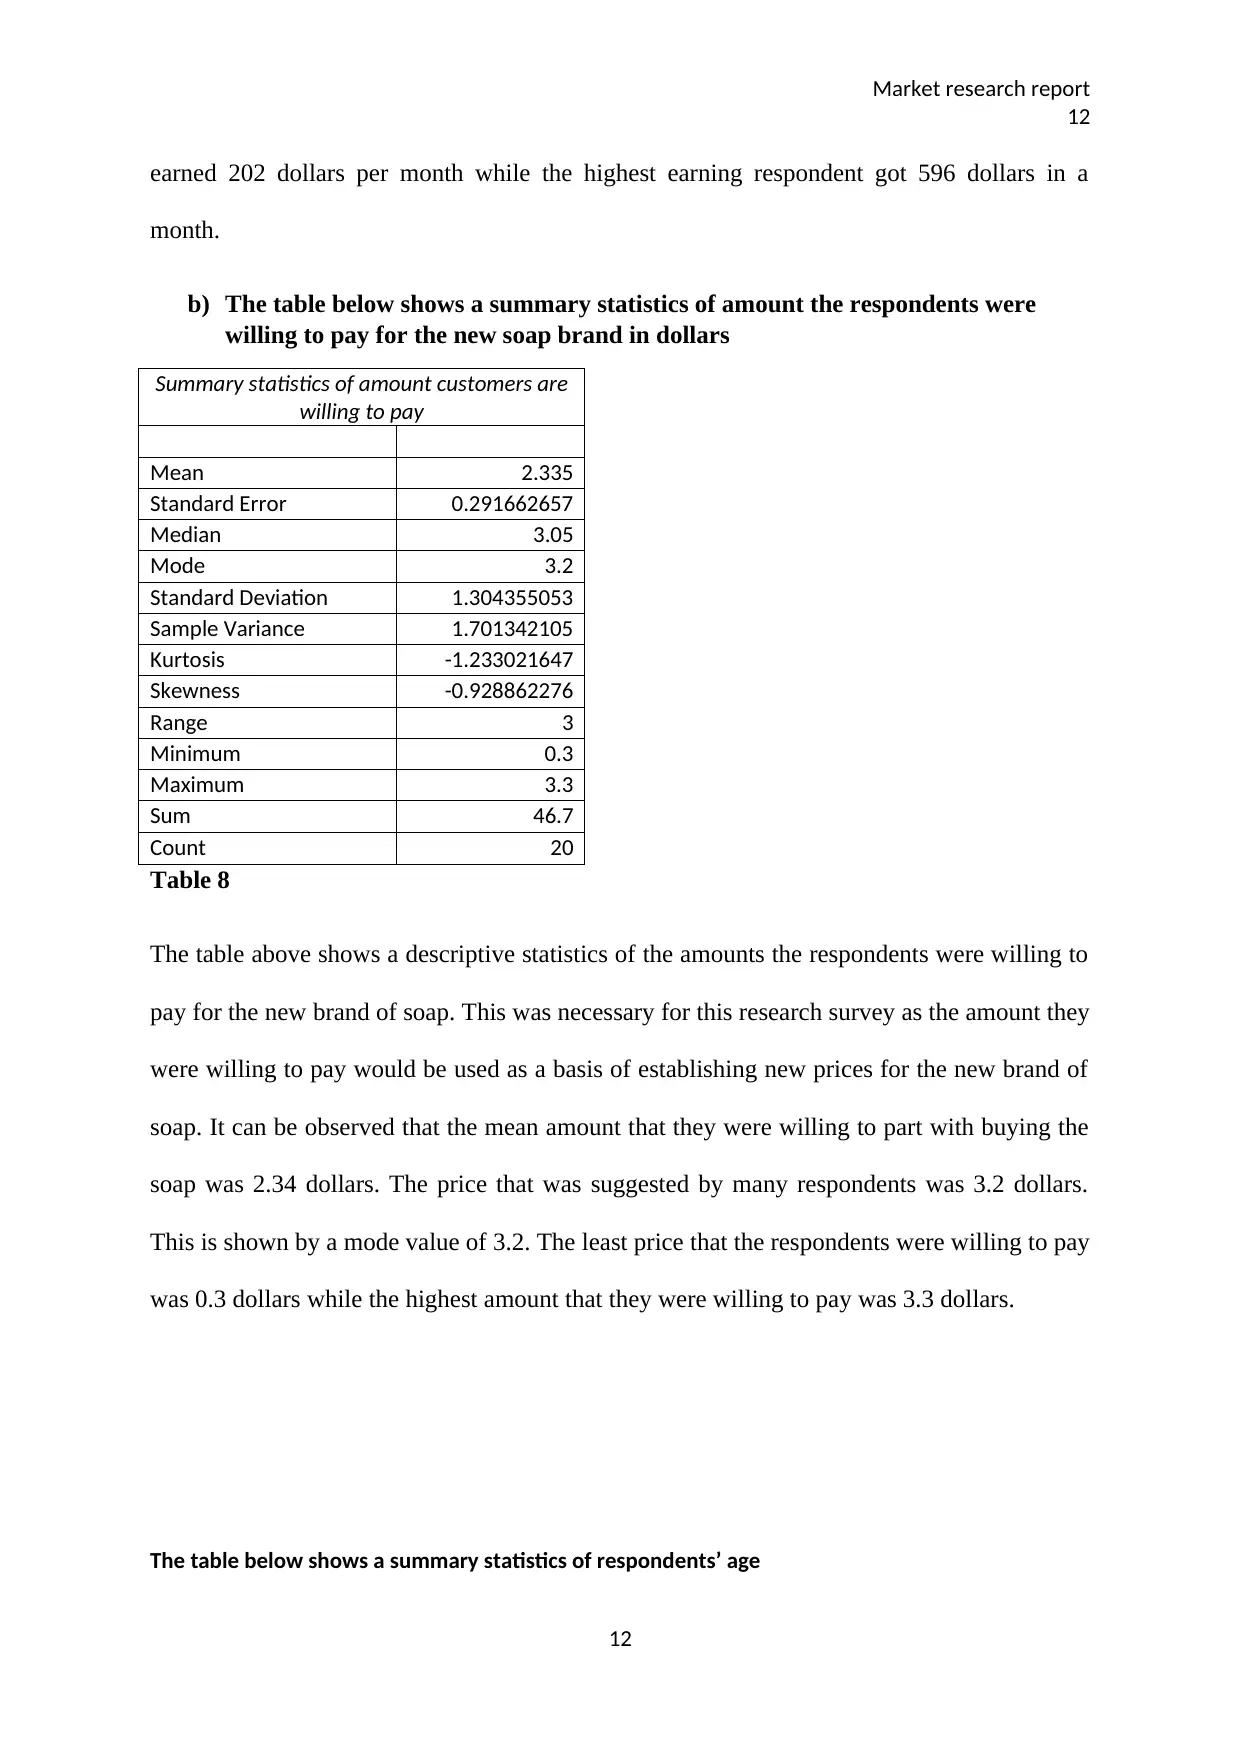
b) The table below shows a summary statistics of amount the respondents were
willing to pay for the new soap brand in dollars
Summary statistics of amount customers are
willing to pay
Mean 2.335
Standard Error 0.291662657
Median 3.05
Mode 3.2
Standard Deviation 1.304355053
Sample Variance 1.701342105
Kurtosis -1.233021647
Skewness -0.928862276
Range 3
Minimum 0.3
Maximum 3.3
Sum 46.7
Count 20
Table 8
The table above shows a descriptive statistics of the amounts the respondents were willing to
pay for the new brand of soap. This was necessary for this research survey as the amount they
were willing to pay would be used as a basis of establishing new prices for the new brand of
soap. It can be observed that the mean amount that they were willing to part with buying the
soap was 2.34 dollars. The price that was suggested by many respondents was 3.2 dollars.
This is shown by a mode value of 3.2. The least price that the respondents were willing to pay
was 0.3 dollars while the highest amount that they were willing to pay was 3.3 dollars.
The table below shows a summary statistics of respondents’ age
12
12
earned 202 dollars per month while the highest earning respondent got 596 dollars in a
month.
b) The table below shows a summary statistics of amount the respondents were
willing to pay for the new soap brand in dollars
Summary statistics of amount customers are
willing to pay
Mean 2.335
Standard Error 0.291662657
Median 3.05
Mode 3.2
Standard Deviation 1.304355053
Sample Variance 1.701342105
Kurtosis -1.233021647
Skewness -0.928862276
Range 3
Minimum 0.3
Maximum 3.3
Sum 46.7
Count 20
Table 8
The table above shows a descriptive statistics of the amounts the respondents were willing to
pay for the new brand of soap. This was necessary for this research survey as the amount they
were willing to pay would be used as a basis of establishing new prices for the new brand of
soap. It can be observed that the mean amount that they were willing to part with buying the
soap was 2.34 dollars. The price that was suggested by many respondents was 3.2 dollars.
This is shown by a mode value of 3.2. The least price that the respondents were willing to pay
was 0.3 dollars while the highest amount that they were willing to pay was 3.3 dollars.
The table below shows a summary statistics of respondents’ age
12
⊘ This is a preview!⊘
Do you want full access?
Subscribe today to unlock all pages.
Trusted by 1+ million students worldwide
1 out of 16
Related Documents


Your All-in-One AI-Powered Toolkit for Academic Success.
+13062052269
info@desklib.com
Available 24*7 on WhatsApp / Email
![[object Object]](/_next/static/media/star-bottom.7253800d.svg)
Unlock your academic potential
Copyright © 2020–2026 A2Z Services. All Rights Reserved. Developed and managed by ZUCOL.