Audit Report: Analyzing Market Risk and Return for Cochlear and CSL
VerifiedAdded on 2020/07/23
|13
|2475
|59
Report
AI Summary
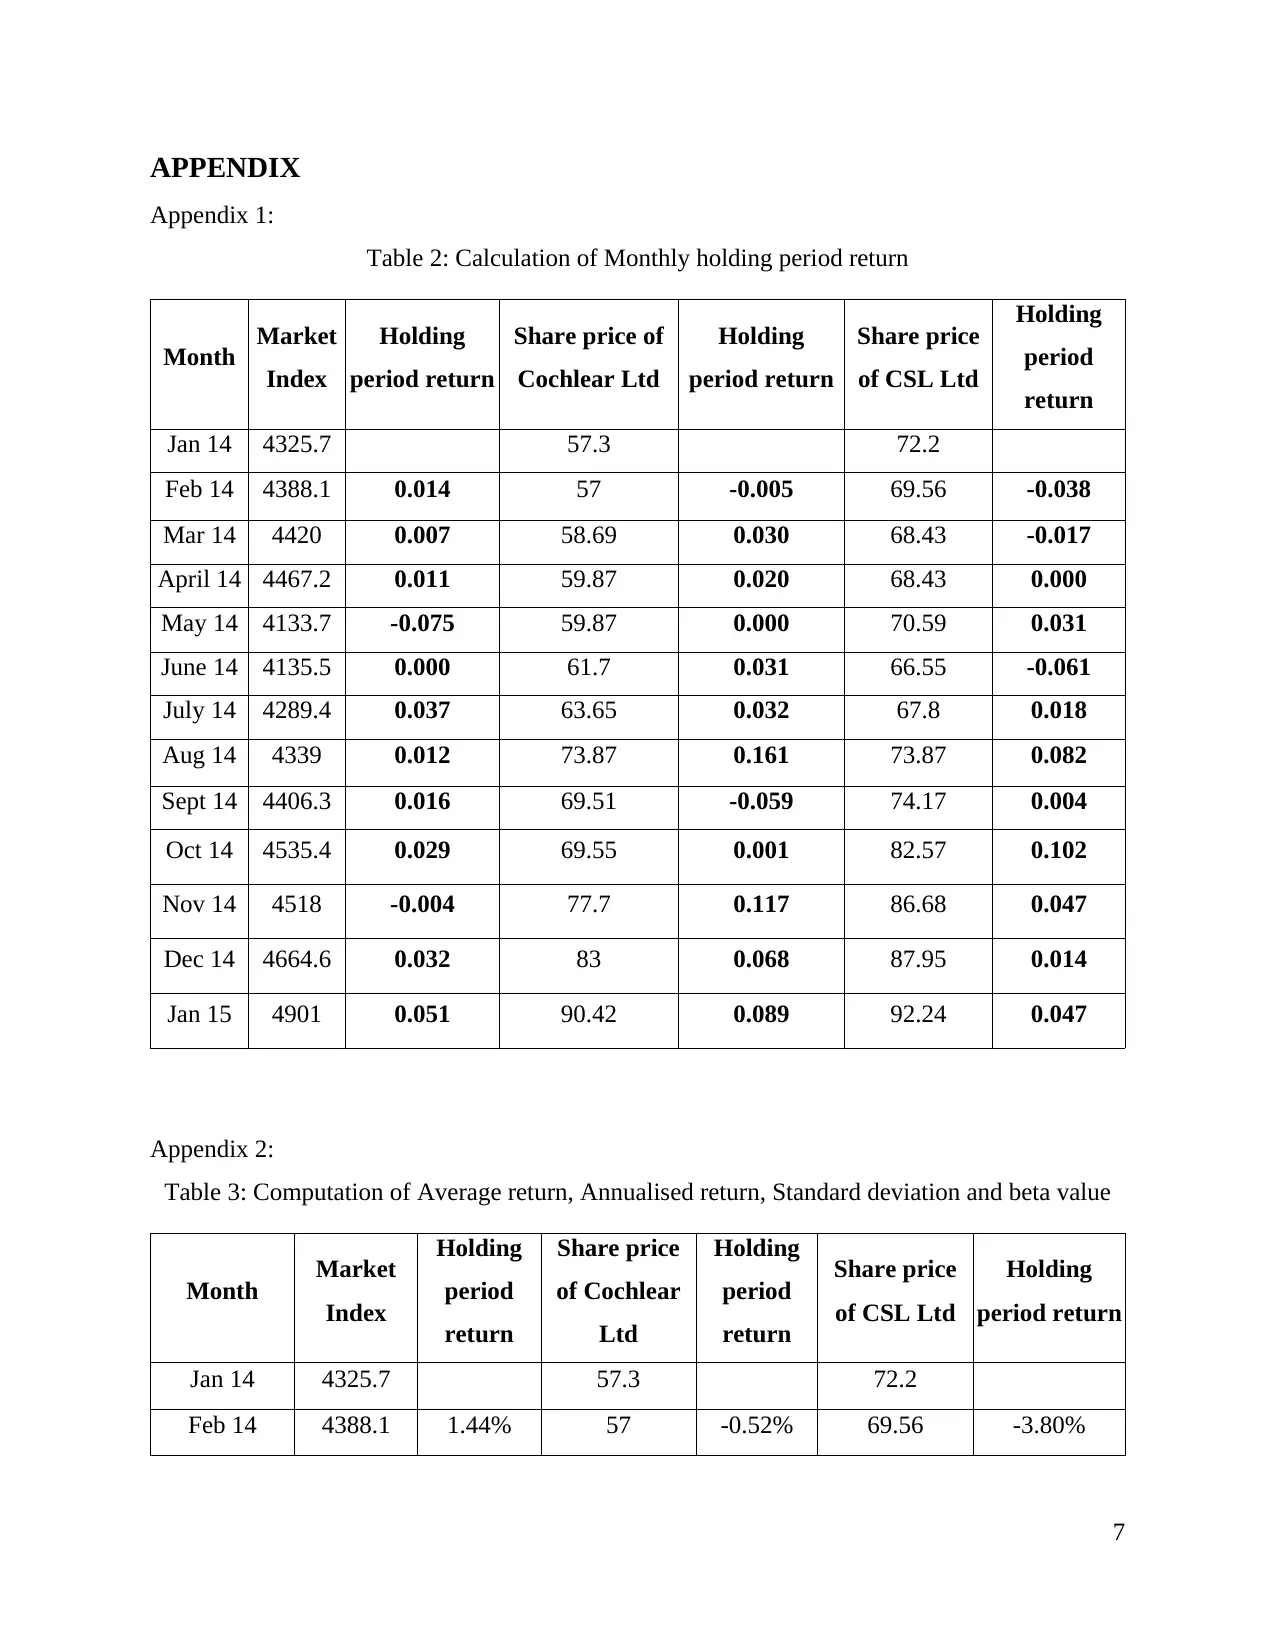
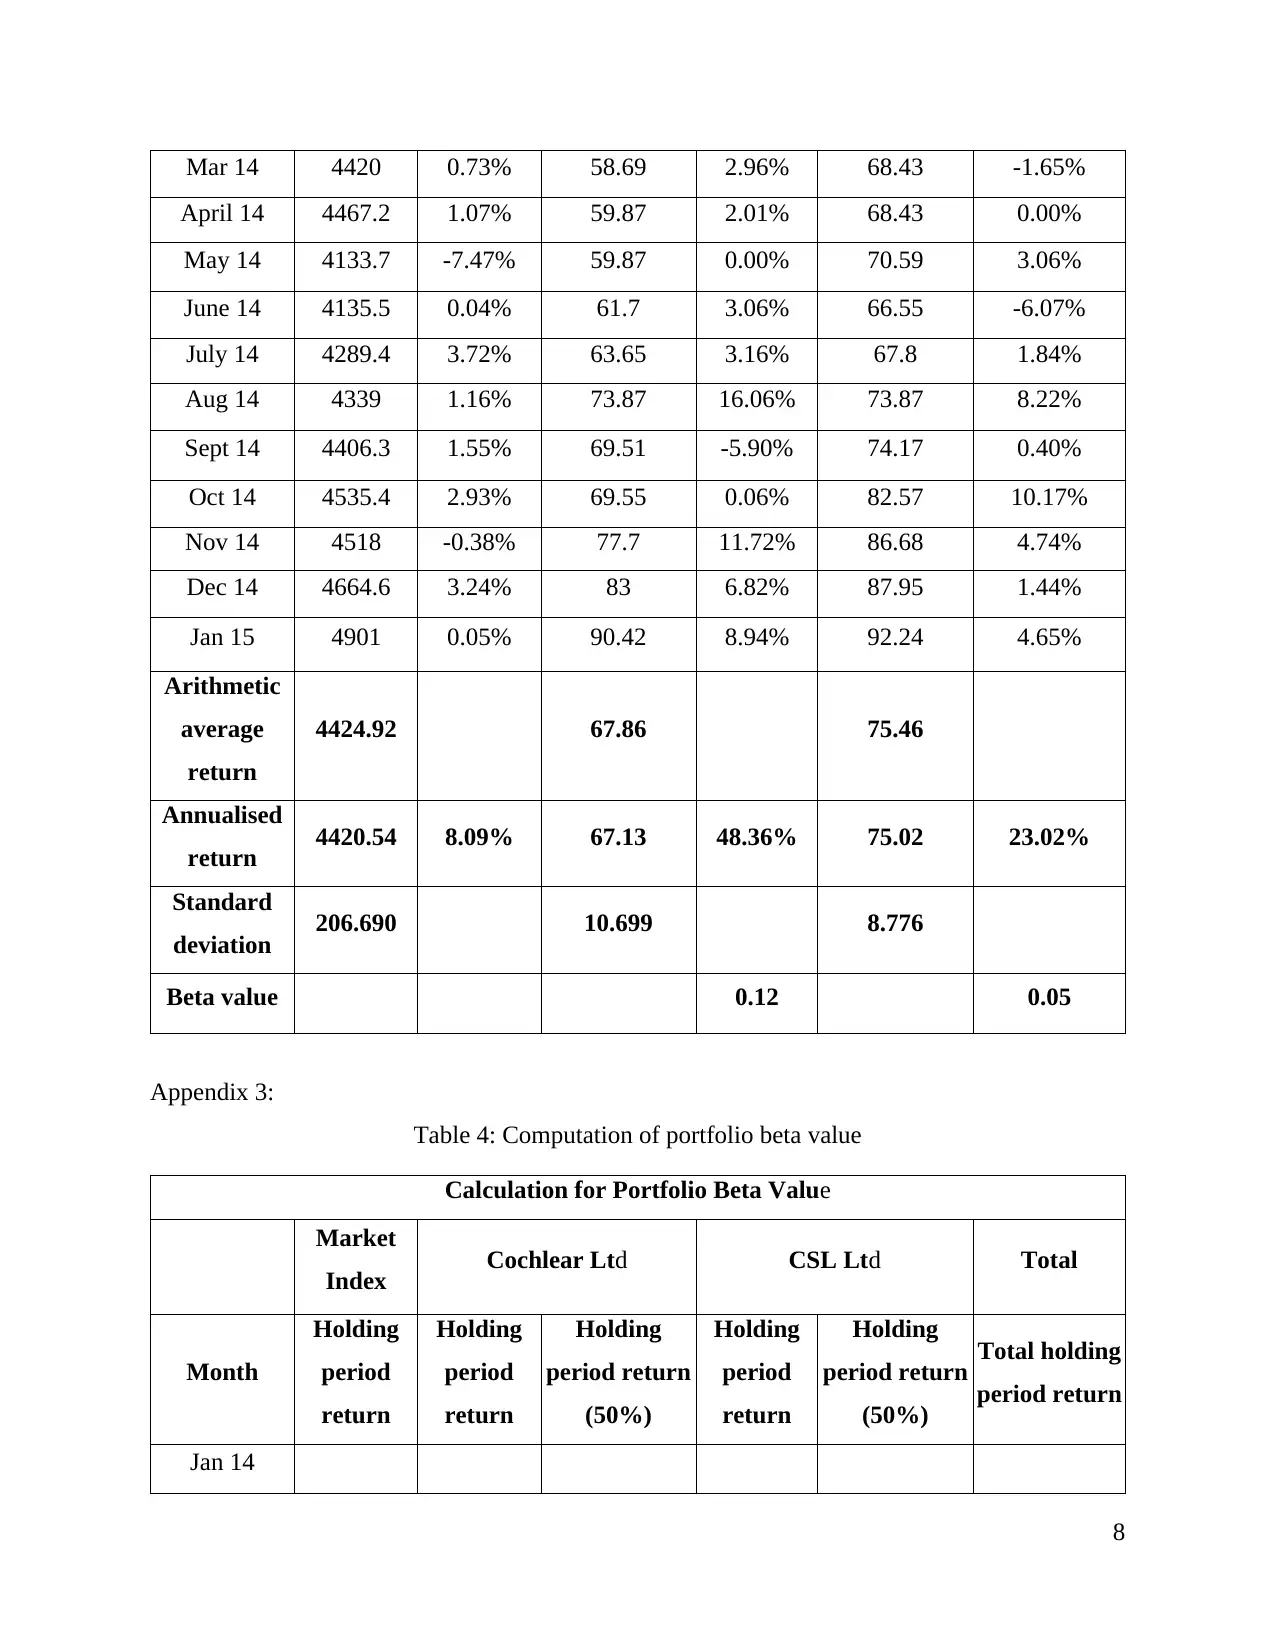
This audit report provides a detailed analysis of market risk and return for Cochlear Ltd and CSL Ltd, two companies in the healthcare sector. The report examines share price fluctuations from January 2014 to January 2015, calculating monthly holding returns, arithmetic average return, annualized returns, standard deviation, and beta values for both companies. It further assesses portfolio beta risk and the required rate of return using the CAPM model. The report concludes with a calculation of the Weighted Average Cost of Capital (WACC) for each company, providing a comprehensive financial evaluation for investment decision-making. The report includes tables and appendices with supporting data and calculations, offering a thorough examination of the companies' financial performance and risk profiles.
Contribute Materials
Your contribution can guide someone’s learning journey. Share your
documents today.

AUDIT REPORT
Secure Best Marks with AI Grader
Need help grading? Try our AI Grader for instant feedback on your assignments.

Table of Contents
Main Body.......................................................................................................................................1
Question 1: Calculation of monthly holding returns...................................................................1
Question 2: Calculation of Arithmetic average return and annualized returns...........................2
Question 3: Standard deviation of the returns.............................................................................3
Question 4: Calculation of beta...................................................................................................3
Question 5: Calculation of portfolio beta risk.............................................................................4
Question 6: Calculation of required rate of return through CAPM model.................................4
Question 7: Calculation of Weighted Average cost of capital for the two companies...............4
APPENDIX......................................................................................................................................5

Illustration Index
Illustration 1: Fluctuations in monthly holding returns...................................................................2

Index of Tables
Table 1: Recording of Share Price...................................................................................................1
Table 2: Calculation of Monthly holding period return...................................................................5
Table 3: Computation of Average return, Annualised return, Standard deviation and beta value. .5
Table 4: Computation of portfolio beta value..................................................................................6
Table 5: Calculation of required rate of return by using CAPM model..........................................7
Table 6: Calculation of WACC for Cochlear Ltd............................................................................7
Table 7: Calculation of WACC for CSL Ltd...................................................................................8
Secure Best Marks with AI Grader
Need help grading? Try our AI Grader for instant feedback on your assignments.

Main Body
Market risk and return plays an important part while deciding to invest in a company. It is
necessary to analyse all the important aspect while taking investment decisions (Feng, Wei and
Wang, 2012). The report discusses market risk and return of Cochlear Ltd and CSL Ltd in order
to understand the volatility in share prices.
The data of two companies in entered in the table, named, Cochlear Ltd and CSL Ltd
which belongs to healthcare sector. Share price from January 2014 to January 2015 is recorded.
Table 1: Recording of Share Price
Month Market
Index
Treasury Bond
rates
Share price of Cochlear
Ltd
Share price of CSL
Ltd
Jan 14 4325.7 4.14% 57.3 72.2
Feb 14 4388.1 4.18% 57 69.56
Mar 14 4420 4.23% 58.69 68.43
April 14 4467.2 4.10% 59.87 68.43
May 14 4133.7 3.69% 59.87 70.59
June 14 4135.5 3.40% 61.7 66.55
July 14 4289.4 3.46% 63.65 67.8
Aug 14 4339 3.48% 73.87 73.87
Sept 14 4406.3 3.45% 69.51 74.17
Oct 14 4535.4 3.25% 69.55 82.57
Nov 14 4518 3.18% 77.7 86.68
Dec 14 4664.6 3.03% 83 87.95
Jan 15 4901 3.00% 90.42 92.24
A rise and fall can be seen the the current share prices of the two companies.
1

Question 1: Calculation of monthly holding returns
Holding period is the return on a particular period that an investor experience in a
particular month in comparison to the previous month (Evans and Hnatkovska, 2014). The
formula used for it is:
Monthly holding period = (Current year share price – Previous year share price) / Previous year
share price
Calculation for monthly holding period have been performed for Cochlear Ltd and CSL
Ltd below graph can be made ( Appendix 1).
It can be interpreted from the above graph that extensive fluctuations in the holding
returns is experienced by Cochlear Ltd in comparison to that of market index. However, in case
of CSL Ltd, it is less volatile.
Question 2: Calculation of Arithmetic average return and annualized returns
Answers are attached in Appendix 2
(I) Arithmetic average return = Total of share price / No. of months.
For Market index = 57523.9 / 13 = 4424.92
2
Feb 14
Mar 14
April 14
May 14
June 14
July 14
Aug 14
Sept 14
Oct 14
Nov 14
Dec 14
Jan 15
-0.1
-0.05
0
0.05
0.1
0.15
0.2
Market Index
Cochlear Ltd
CSL Ltd
Illustration 1: Fluctuations in monthly holding returns

For Share price of Cochlear Ltd = 882.13 / 13 = 67.86
For Share price of CSL Ltd. = 981.04 / 13 = 75.46
Arithmetic average return is the average expected return from the investment made by the
investor. High average shows that the company is able to generate high average return in a
particular year. It shows that average return from CSL Ltd is high in comparison to that of
Cochlear Ltd.
(ii) Annualised return = Total of holding period return
Market index = 0.13
Cochlear Ltd = 0.48
CSL Ltd. = 0.23
The annualised return of Cochlear Ltd. is higher than that of CSL Ltd. It is the return
earned by the investor for every share for the whole year. It shows that there will be change of
13% in the returns of overall investors of the market. Similarly, the change tends to be 48% and
23% in case of Cochlear Ltd and CSL Ltd. Hence, the market condition of Cochlear is better
than compared to CSL. It shows that investor should invest in Cochlear in order to generate
higher returns in a particular year.
Question 3: Standard deviation of the returns
Standard deviation helps in assessing the amount of variation in a particular data.
Deviation is calculated in comparison to the mean (Bodie, 2013). High standard deviation
denotes that the data points are quite away from the mean in comparison to the one which has
lower standard deviation.
Standard deviation =
Market index = 206.690
Cochlear Ltd = 882.13
CSL Ltd = 981.04
Hence, the data of Cochlear Ltd is least deviated in comparison to that of CSL Ltd.
3
Paraphrase This Document
Need a fresh take? Get an instant paraphrase of this document with our AI Paraphraser

Question 4: Calculation of beta
Beta is the risk factor involved in any investment. Moreover, it indicates the volatility of
the data set. Beta less than 1 indicates that the investment is less volatile in the market and vice
versa (Fernandez, 2015).
Based on the monthly holding period, beta value will be calculated (Appendix 2)
Beta value of Cochlear Ltd = 0.12
Beta value of CSL Ltd = 0.05
Beta value helps in assessing the volatility of the asset with respect to the overall market
index (Market risk, 2012). Higher beta indicated higher risk of the portfolio. It shows that
investment in CSL Ltd is riskier in comparison to Cochlear Ltd.
Question 5: Calculation of portfolio beta risk
The investor can invest in both the companies in order to reduce the risk. Moreover, the
investor has decided to invest in both the companies by 50% so that it can mitigate the risk
involved in investment (Gravetter and Wallnau, 2016). For that matter, the risk will be 8%
(Appendix 3) in case of Cochlear Ltd and CSL Ltd. It shows that he will be able to minimize the
risk percentage which is 12% in case of Cochlear if he had invested 100% in that company.
Question 6: Calculation of required rate of return through CAPM model
CAPM helps in describing the relationship between expected returns and systematic risk.
Required rate of return =
Based on the calculations performed (Appendix 4), Expected rate of return for Cochlear
Ltd id 8.96%. However, in case of CSL Ltd, it is 4.57%. Hence, the rate of return is higher in
case of Cochlear Ltd in comparison to that of CSL Ltd.
Question 7: Calculation of Weighted Average cost of capital for the two companies
Weighted Average Rate of Return (WACC) helps in calculating cost of capital of the
company. In this case, capital is weighted proportionately considering all the available sources of
capital (Caporale, 2012). It includes, common stock, preferred stock, bonds and other long term
debts. In the give scenario, there is 45% of equity and 55% of debt. Based on the calculation
4

performed for WACC with respect to Cochlear Ltd and CSL Ltd. The WACC of Cochlear Ltd in
8.43% (Appendix 5) and in case of CSL Ltd., it is 6.45% (Appendix 6).
5
8.43% (Appendix 5) and in case of CSL Ltd., it is 6.45% (Appendix 6).
5

REFERENCES
Books and Journals
Bodie, Z., 2013. Investments. McGraw-Hill.
Caporale, T., 2012. Time varying CAPM betas and banking sector risk.Economics
Letters. 115(2). pp.293-295.
Evans, M. D. and Hnatkovska, V. V., 2014. International capital flows, returns and world
financial integration. Journal of International Economics. 92(1). pp.14-33.
Feng, Z. H., Wei, Y. M. and Wang, K., 2012. Estimating risk for the carbon market via extreme
value theory: An empirical analysis of the EU ETS.Applied Energy. 99. pp.97-108.
Fernandez, P., 2015. EVA and cash value added do not measure shareholder value creation.
Gravetter, F. J. and Wallnau, L. B., 2016. Statistics for the behavioral sciences. Cengage
Learning.
Online
Market risk. 2012. [Online]. Available through
<http://www.hedgefund-index.com/d_marketrisk.asp>. [Accessed on 16th September
2017].
6
Secure Best Marks with AI Grader
Need help grading? Try our AI Grader for instant feedback on your assignments.

APPENDIX
Appendix 1:
Table 2: Calculation of Monthly holding period return
Month Market
Index
Holding
period return
Share price of
Cochlear Ltd
Holding
period return
Share price
of CSL Ltd
Holding
period
return
Jan 14 4325.7 57.3 72.2
Feb 14 4388.1 0.014 57 -0.005 69.56 -0.038
Mar 14 4420 0.007 58.69 0.030 68.43 -0.017
April 14 4467.2 0.011 59.87 0.020 68.43 0.000
May 14 4133.7 -0.075 59.87 0.000 70.59 0.031
June 14 4135.5 0.000 61.7 0.031 66.55 -0.061
July 14 4289.4 0.037 63.65 0.032 67.8 0.018
Aug 14 4339 0.012 73.87 0.161 73.87 0.082
Sept 14 4406.3 0.016 69.51 -0.059 74.17 0.004
Oct 14 4535.4 0.029 69.55 0.001 82.57 0.102
Nov 14 4518 -0.004 77.7 0.117 86.68 0.047
Dec 14 4664.6 0.032 83 0.068 87.95 0.014
Jan 15 4901 0.051 90.42 0.089 92.24 0.047
Appendix 2:
Table 3: Computation of Average return, Annualised return, Standard deviation and beta value
Month Market
Index
Holding
period
return
Share price
of Cochlear
Ltd
Holding
period
return
Share price
of CSL Ltd
Holding
period return
Jan 14 4325.7 57.3 72.2
Feb 14 4388.1 1.44% 57 -0.52% 69.56 -3.80%
7

Mar 14 4420 0.73% 58.69 2.96% 68.43 -1.65%
April 14 4467.2 1.07% 59.87 2.01% 68.43 0.00%
May 14 4133.7 -7.47% 59.87 0.00% 70.59 3.06%
June 14 4135.5 0.04% 61.7 3.06% 66.55 -6.07%
July 14 4289.4 3.72% 63.65 3.16% 67.8 1.84%
Aug 14 4339 1.16% 73.87 16.06% 73.87 8.22%
Sept 14 4406.3 1.55% 69.51 -5.90% 74.17 0.40%
Oct 14 4535.4 2.93% 69.55 0.06% 82.57 10.17%
Nov 14 4518 -0.38% 77.7 11.72% 86.68 4.74%
Dec 14 4664.6 3.24% 83 6.82% 87.95 1.44%
Jan 15 4901 0.05% 90.42 8.94% 92.24 4.65%
Arithmetic
average
return
4424.92 67.86 75.46
Annualised
return 4420.54 8.09% 67.13 48.36% 75.02 23.02%
Standard
deviation 206.690 10.699 8.776
Beta value 0.12 0.05
Appendix 3:
Table 4: Computation of portfolio beta value
Calculation for Portfolio Beta Value
Market
Index Cochlear Ltd CSL Ltd Total
Month
Holding
period
return
Holding
period
return
Holding
period return
(50%)
Holding
period
return
Holding
period return
(50%)
Total holding
period return
Jan 14
8

Feb 14 1.44% -0.52% -0.26% -3.80% -1.90% -2.16%
Mar 14 0.73% 2.96% 1.48% -1.65% -0.83% 0.66%
April 14 1.07% 2.01% 1.01% 0.00% 0.00% 1.01%
May 14 -7.47% 0.00% 0.00% 3.06% 1.53% 1.53%
June 14 0.04% 3.06% 1.53% -6.07% -3.04% -1.51%
July 14 3.72% 3.16% 1.58% 1.84% 0.92% 2.50%
Aug 14 1.16% 16.06% 8.03% 8.22% 4.11% 12.14%
Sept 14 1.55% -5.90% -2.95% 0.40% 0.20% -2.75%
Oct 14 2.93% 0.06% 0.03% 10.17% 5.09% 5.12%
Nov 14 -0.38% 11.72% 5.86% 4.74% 2.37% 8.23%
Dec 14 3.24% 6.82% 3.41% 1.44% 0.72% 4.13%
Jan 15 0.05% 8.94% 4.47% 4.65% 2.33% 6.80%
Beta value 0.08
Appendix 4:
Table 5: Calculation of required rate of return by using CAPM model
Particulars Cochlear Ltd CSL Ltd
Risk free rate of return 3.58% 3.58%
Beta value 12.00% 5.07%
Expected market return 48.36% 23.02%
Rm - Rf 44.78% 19.43%
Beta* (Rm – Rf) 5.37% 0.98%
CAPM 8.96% 4.57%
Appendix 5:
Table 6: Calculation of WACC for Cochlear Ltd
Cochlear Ltd
Debt Equity Weight age
E/(D+E) @ Enterprise Value 45.00%
9
1 out of 13
Related Documents

Your All-in-One AI-Powered Toolkit for Academic Success.
+13062052269
info@desklib.com
Available 24*7 on WhatsApp / Email
Unlock your academic potential
© 2024 | Zucol Services PVT LTD | All rights reserved.