Quantitative Business Analysis: Hierarchical Clustering for UPS

Verified

Added on  2022/08/28

|10
|1780
|18
Project
AI Summary
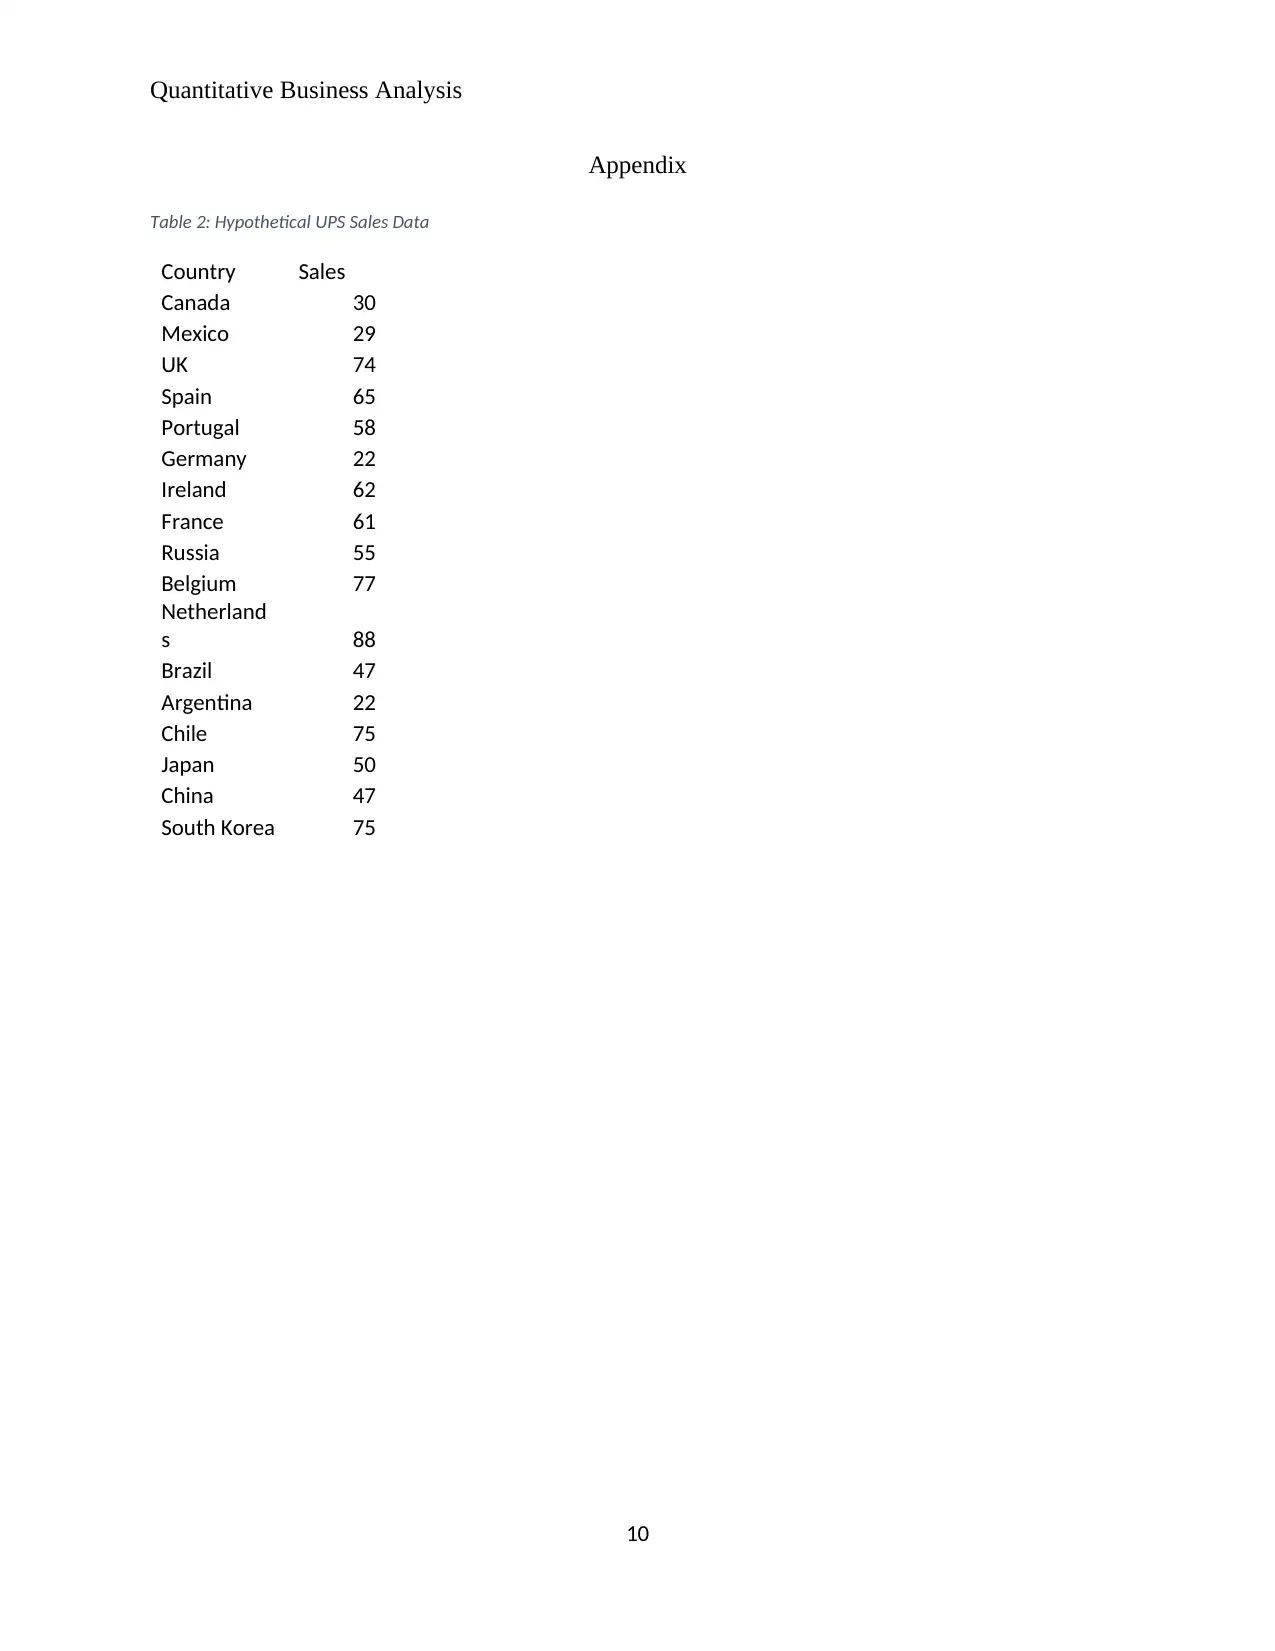
This project provides a comprehensive quantitative business analysis of UPS, a global logistics company, focusing on market segmentation challenges. The analysis highlights the need for effective segmentation due to diverse market dynamics influenced by factors like politics, income, and culture. The project proposes the use of big data analytics, specifically cluster analysis, as a solution. It delves into hierarchical cluster analysis as the most suitable technique for UPS, given the flexibility needed to account for a wide range of services and the ability to minimize information loss. The project includes a sample cluster analysis using hypothetical sales data, demonstrating the R Programming Code and output, along with a visualization of the clusters. The limitations of the hierarchical clustering technique, such as the computational cost and sensitivity to outliers, are also discussed. The project concludes by emphasizing the importance of effective data entry to minimize the chances of outliers. References to relevant academic papers on clustering, market segmentation, and logistics are also provided.
Document Page
Quantitative Business Analysis
tabler-icon-diamond-filled.svg

Paraphrase This Document

Need a fresh take? Get an instant paraphrase of this document with our AI Paraphraser
Document Page
Quantitative Business Analysis
Overview of Problem
Operating a global business presents a challenge in terms of aspects such as planning and
product marketing, due to the diversity in the markets. The market dynamics in the different
regions in the world are not the same, with the slightest difference in market metrics
necessitating a change in approach to product marketing and business strategy (Besanko,
Dranove, & Shanley, 2012). Many factors play a role in influencing the market dynamics and
metrics in a particular region. These factors include politics, income levels and GDP (Gross
Domestic Product), religion and culture. This varied range of factors imply that the marketing
model or business strategy adopted by a global company at its country of origin (home country)
may not apply for the markets in other regions in the world.
Traditionally, the idea has been partitioning the international market with respect to
continents or geopolitical regions. However, the development in communication and information
technologies have resulted in more informed customers who know what their needs are. A more
informed customer results in more complex markets, which imply that the traditional market
segmentation based solely on geopolitics may not apply in the modern international market
(Besanko et al., 2012).
Therefore, global companies face the challenge of market segmentation for efficient
operations. One such company is the United Parcel Service (UPS) with its headquarters in the
United States of America. The UPS is a primarily a package delivery company in the logistics
industry. Currently, UPS operates in 220 countries offering the American companies delivery
services to these countries (Reuters, 2020). Its operations in the international market require
effective market segmentation to improve the efficiency.
2
Document Page
Quantitative Business Analysis
Cluster Analysis
Big data analytics provide a range of applicable solutions for the challenge of market
segmentation for companies operating in the global market. Classification algorithms are among
these data driven solutions that are able to categorize markets depending on a predetermined set
of metrics. Cluster analysis is a classification algorithm that considers the level of homogeneity
in attributes between objects as the criteria for generating subgroups of the objects (Nakyoung,
Sangdon, Joohyung, & Jun, 2018; Hung & Chang-Chien, 2017). Cluster analysis therefore
provides an appropriate big data analytics approach for the market segmentation challenge for
the companies operating in the international market.
Hierarchical Cluster Analysis
Whereas cluster analysis in general in the appropriate approach for the market
segmentation challenge, different industries have different characteristics. This difference in
characteristics means a difference in the type of cluster analysis for the different industries. In the
case of the logistic industry in which UPS operates, the hierarchical cluster analysis technique is
the best type of cluster analysis for market segmentation. Hierarchical cluster analysis is a cluster
analysis technique that applies a rank-like approach in which clusters of objects are developed
and then arranged in a manner that resembles a ranking system with the best performing cluster
on one end and the worst performing cluster on the other end (Ulf-Dietrich & Uwe, 2014). This
algorithm is best for UPS for the following reasons:
3
Document Page
Quantitative Business Analysis
Model Flexibility
The algorithm is not limited in terms of the number of clusters into which the objects are
placed by the algorithm (Daie & Li, 2016). This introduces an aspect of flexibility that is
desirable for market segmentation for companies operating in the logistics business. Limiting the
number of clusters, into which the countries in which UPS operates are placed, may fail to
adequately capture the similarities in the different markets. The global logistic industry in
characterized by a huge range of service types with regards to the type of products being
delivered and type of clients (Georgina, 2015). In order to account for this, a clustering algorithm
without a limitation in the number of cluster is required.
Hierarchical algorithm works in two main ways: divisive operation and agglomerative
operation. In the divisive operation, the clustering process starts with a single ‘mega cluster’
which contains all the objects and then proceeds to break down the ‘mega cluster’ by checking
on attribute similarity among the object to form sub clusters (Daie & Li, 2016). The
agglomerative operation starts with the ‘basic clusters’, which are derivatives of the concept of
self-proximity in the Euclidean distance of clusters (Ren & Ying, 2010). Self-proximity refers to
the distance between an object and itself, which is expected to be 0 and given by (Vicenc, 2017):
dii=0 , for ibeing theobject
The agglomerative operation uses self-proximity as the basis for starting the individual objects as
clusters and checking for similarities between the ‘basic clusters’ then merging the similar ones
to form larger clusters.
Both the divisive and agglomerative operations of the hierarchical technique provide for
the development of the appropriate number of clusters without limiting the number of clusters.
4
tabler-icon-diamond-filled.svg

Paraphrase This Document

Need a fresh take? Get an instant paraphrase of this document with our AI Paraphraser
Document Page
Quantitative Business Analysis
This will make it able to account for the huge range of services types the UPS offers to its global
market.
Information Loss
Due to the huge range of product and client type, the notion of information loss in
clustering has to be addressed when considering the choice of clustering algorithm. Information
loss in clustering refers to the amount of information about an individual object that is lost when
it is clustered with another object (Ying, 2016). A cluster represents information that is common
to its members instead of information about each member. The Ward’s Method linkage type
under hierarchical clustering accounts for this by minimizing information loss for objects. The
wards method of linkage considers the ESS (Error sum of squares) measure that represents the
group mean and individual object difference in computing the loss of information (Ying, 2016).
This linkage method results in clusters with smaller sizes implying less loss of information. This
would be important in the case of the UPS with minimum loss of information on the product and
client type for each country.
Sample Cluster for UPS Market Segmentation
Using the hypothetical data of sales in 17 different countries given in the Appendix, the R
Programming Code and output for the Hierarchical Cluster analysis algorithm is as given in
Table 1: Hierarchical Clustering Algorithm below, with the resulting visualization of the clusters
given in Figure 1: Sample Hierarchical Clustering Visualization.
5
Document Page
Quantitative Business Analysis
Table 1: Hierarchical Clustering Algorithm
6
Document Page
Quantitative Business Analysis
Figure 1: Sample Hierarchical Clustering Visualization
Limitations
The main limitation of the hierarchical clustering technique is the cost of implementation
of the approach especially with large datasets. The cost is associated with the speed of large data
processing using this algorithm. The distance matrix utilized by this algorithm is a matrix with
the dimension of p x p, hence in the case of large datasets this would be a large matrix resulting
in slower processing speeds. This can be remedied by use of more powerful computers for
running the algorithm, which in turn result in increased cost for UPS. The algorithm also has
high sensitivity to outliers, which cannot be corrected by replacement or removal without
affecting the results. Hence implying that the data entry stage is critical to minimize chances of
occurrence of outliers.
7
tabler-icon-diamond-filled.svg

Paraphrase This Document

Need a fresh take? Get an instant paraphrase of this document with our AI Paraphraser
Document Page
Quantitative Business Analysis
References
Besanko, D., Dranove, D., & Shanley, M. (2012). Economics of Strategy (1st ed.). New York:
John Wiley & Sons.
Christy, M., Xiao-Liang, S., Zach, W., & Tommy, K. (2015). Promoting sales of online games
through customer engagement. Electronic Commerce Research and Applications, 14(4),
241-250.
Daie, P., & Li, S. (2016). Managing product variety through configuration of preassembled
vanilla boxes using hierarchical clustering. International Journal of Production
Research, 54(18), 5468-5479.
Georgina, P. (2015). How Business Works: A Graphic Guide to Business Success (1st ed.).
London: DK Publishing.
Hung, W.L., & Chang-Chien, S.J. (2017). Learning-based EM algorithm for normal-inverse
Gaussian mixture model with application to extrasolar planets. Journal of Applied
Statistics, 44(6), 978-999.
Nakyoung, K., Sangdon, P., Joohyung, L., & Jun, K. C. (2018). Load Profile Extraction by
Mean-Shift Clustering with Sample Pearson Correlation Coefficient Distance. Energies,
11(9), 2397.
Ren, J., & Ying, S. (2010). Research and Improvement of Clustering Algorithms in Data Mining.
Dalian, China: 2010 2nd International Conference on Signal Processing Systems.
Reuters. (2020, January 3). UPS. Retrieved from Reuters:
https://www.reuters.com/companies/UPS
8
Document Page
Quantitative Business Analysis
Ulf-Dietrich, R., & Uwe, M. (2014). Mining "Big Data" Using Big Data Services. International
Journal of Internet Science, 1(1), 1-8.
Vicenc, T. (2017). Studies in Big Data (1st ed.). Chicago: Springer International Publishing .
Ying, M. (2016). An Analysis on the Relative Efficiency of Furniture Enterprises in Guangdong
Province Based on DEA-BCC and Clustering Method. Open Journal of Business and
Management , 4(2), 13.
Yu, Y. P., Omar, R., Harrison, R. D., Sammathuria, M. K., & Nik, A. R. (2011). Pattern
Clustering of Forest Fires Based on Meteorological Variables and its Classification Using
Hybrid Data Mining Methods. Journal of Computational Biology and Bioinformatics
Research, 3(1), 47-52.
9
Document Page
Quantitative Business Analysis
Appendix
Table 2: Hypothetical UPS Sales Data
Country Sales
Canada 30
Mexico 29
UK 74
Spain 65
Portugal 58
Germany 22
Ireland 62
France 61
Russia 55
Belgium 77
Netherland
s 88
Brazil 47
Argentina 22
Chile 75
Japan 50
China 47
South Korea 75
10
chevron_up_icon
1 out of 10
circle_padding
hide_on_mobile
zoom_out_icon
[object Object]