Organizational Behavior: Exploring Market Structures and Elasticity

Verified

Added on  2023/06/08

|12
|1485
|159
Homework Assignment
AI Summary
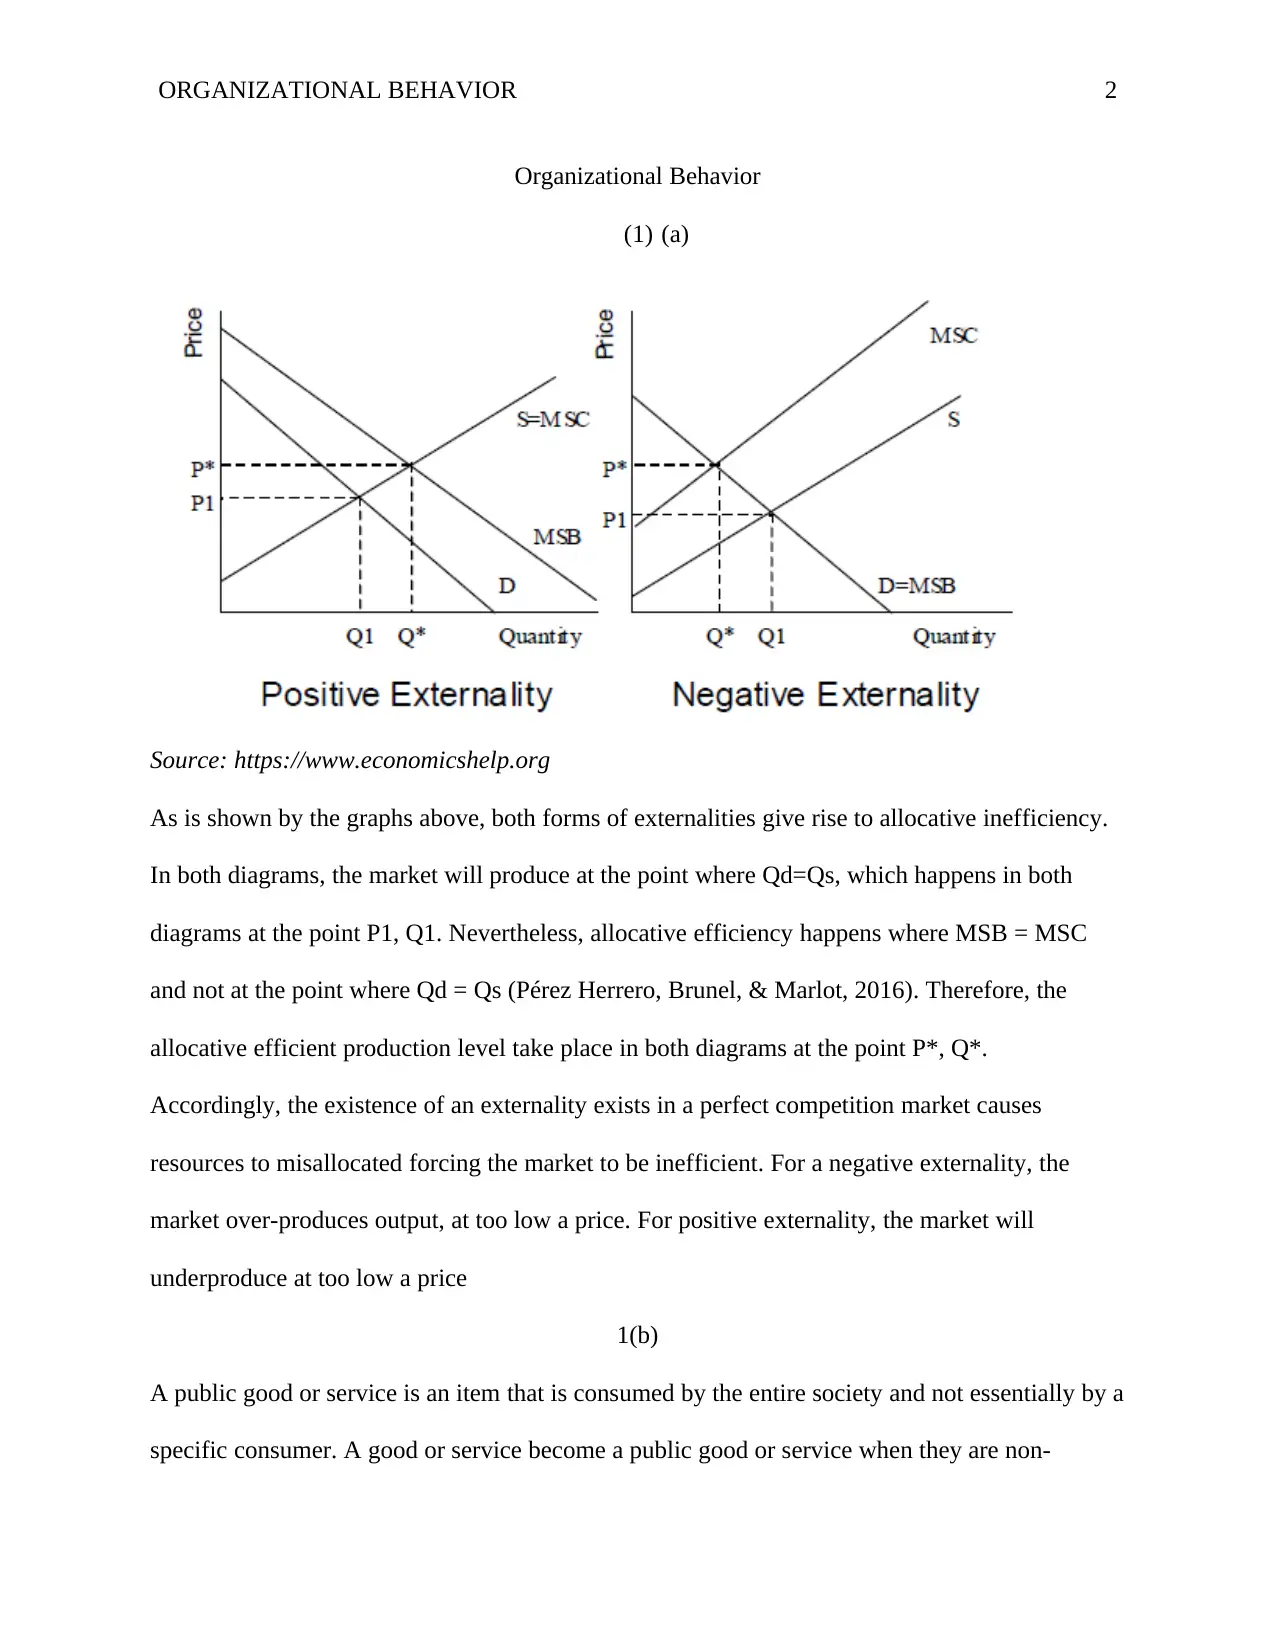
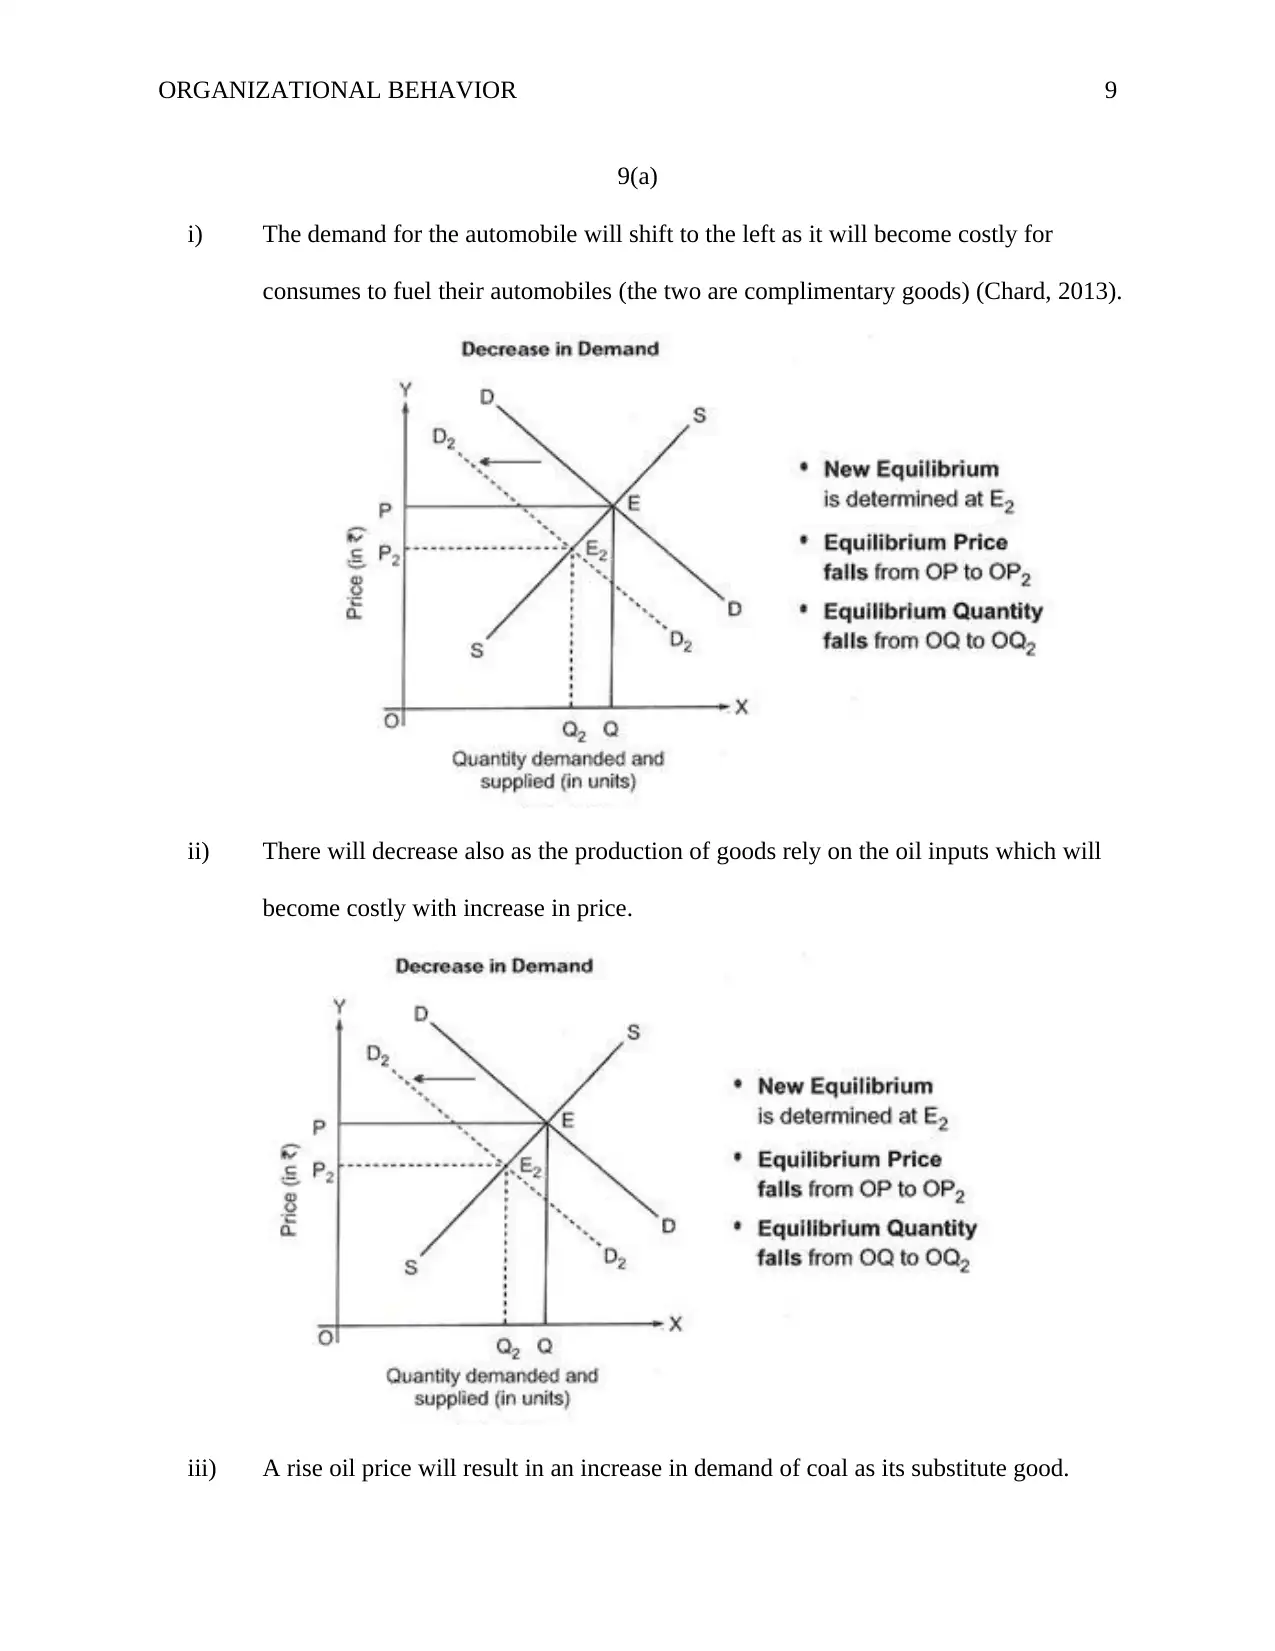
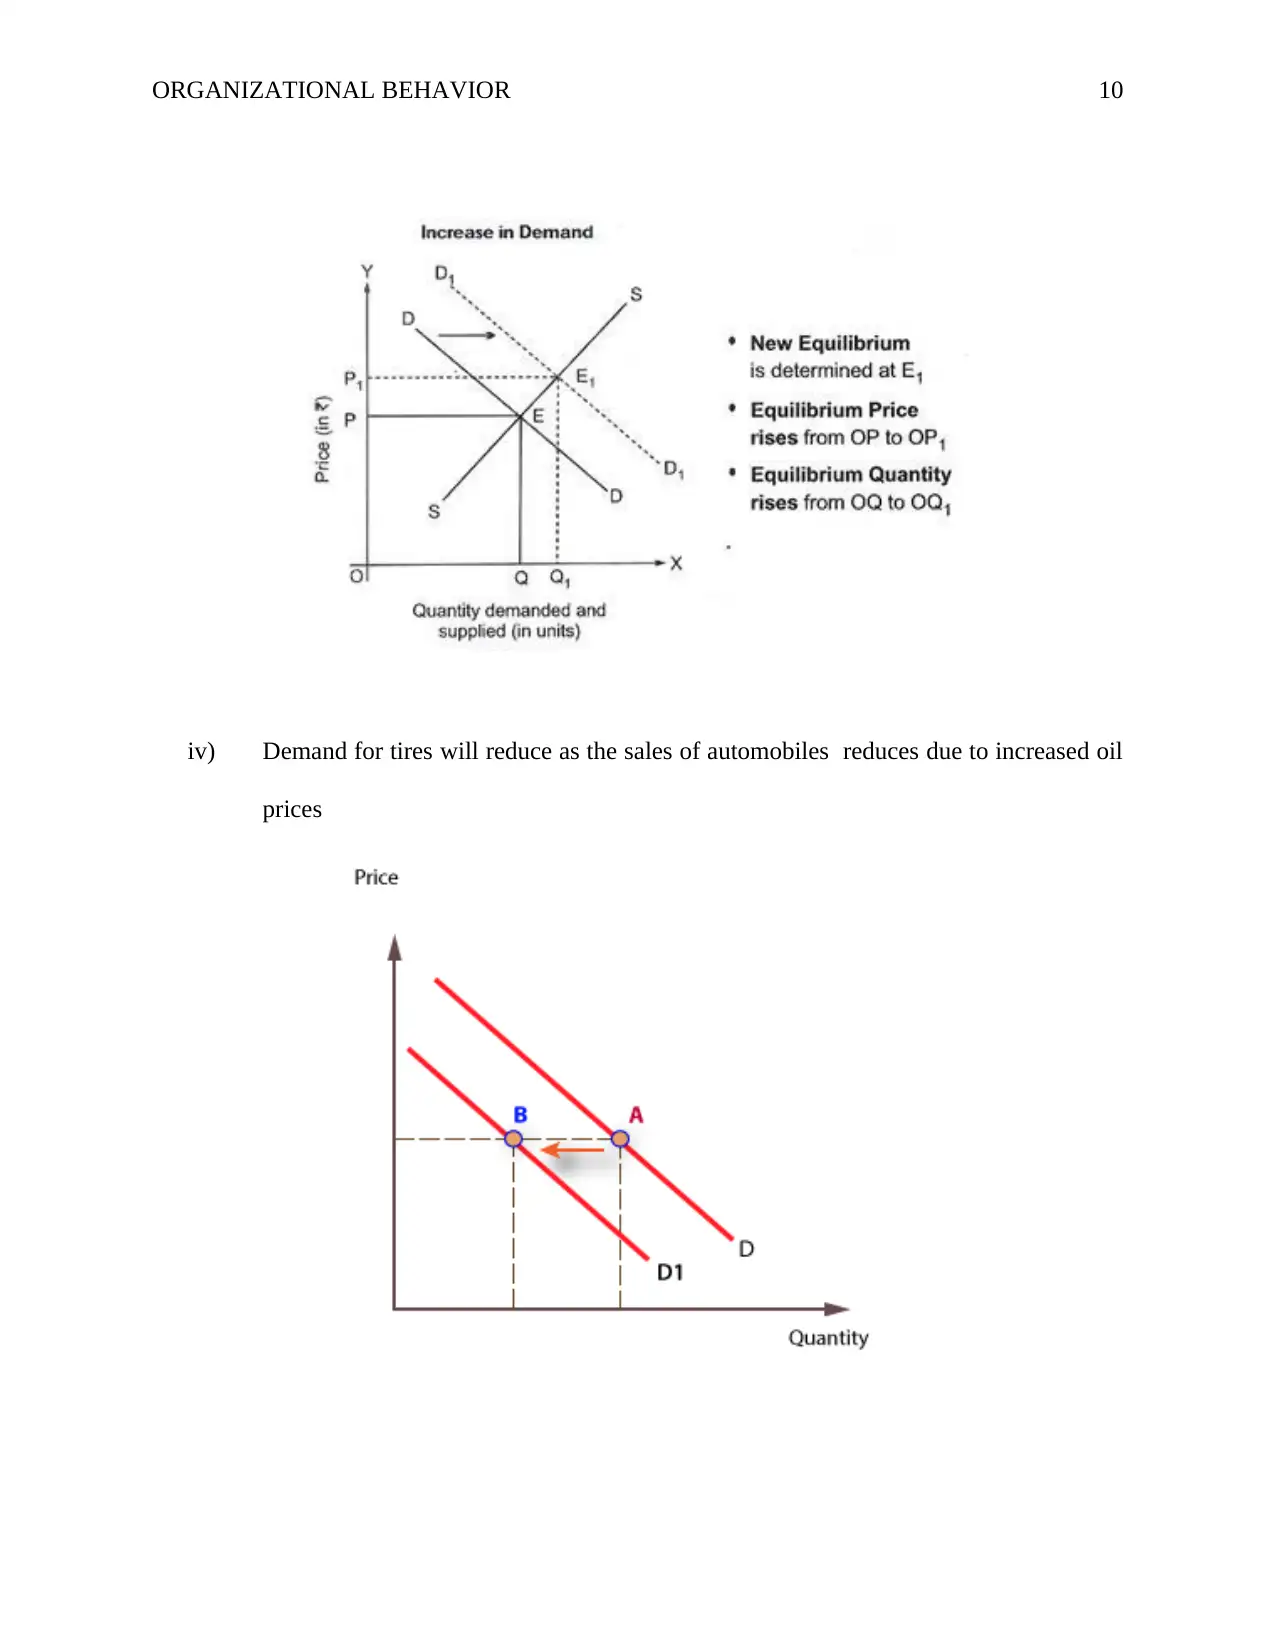
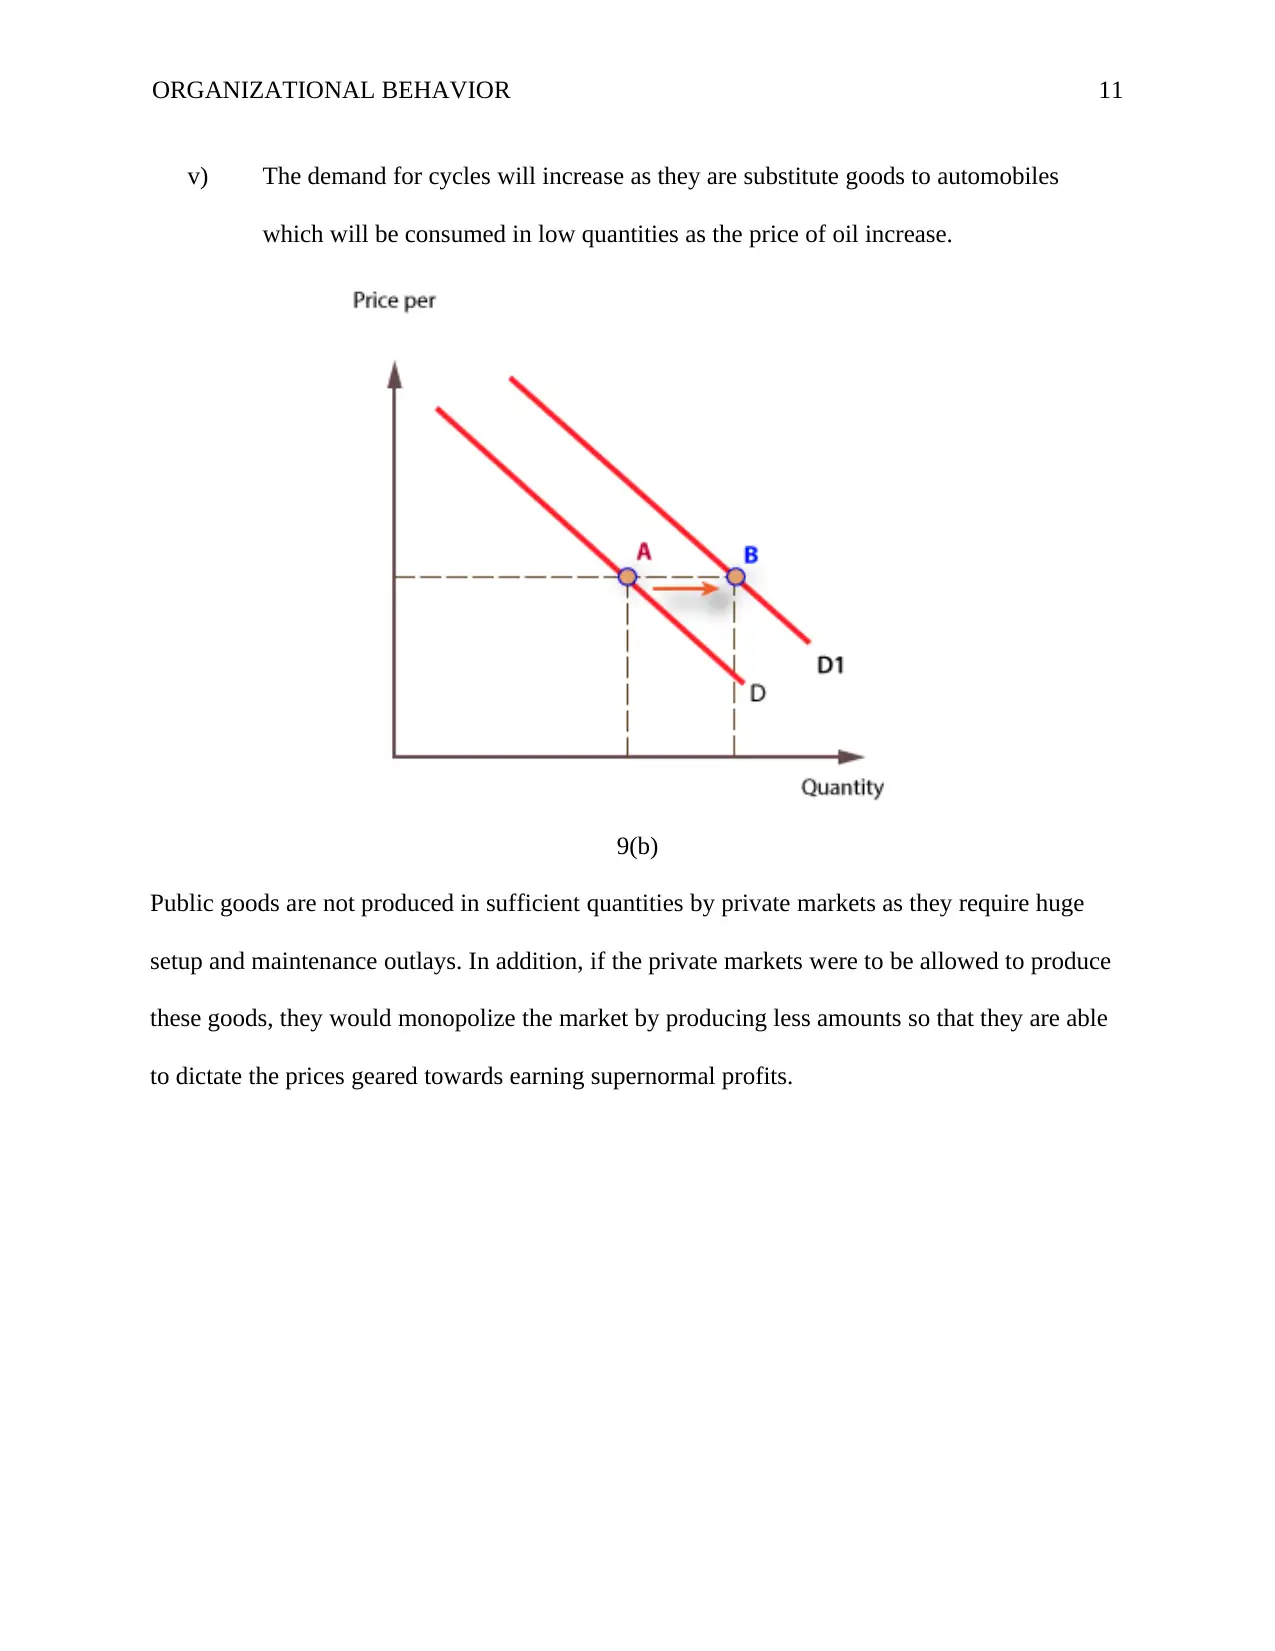
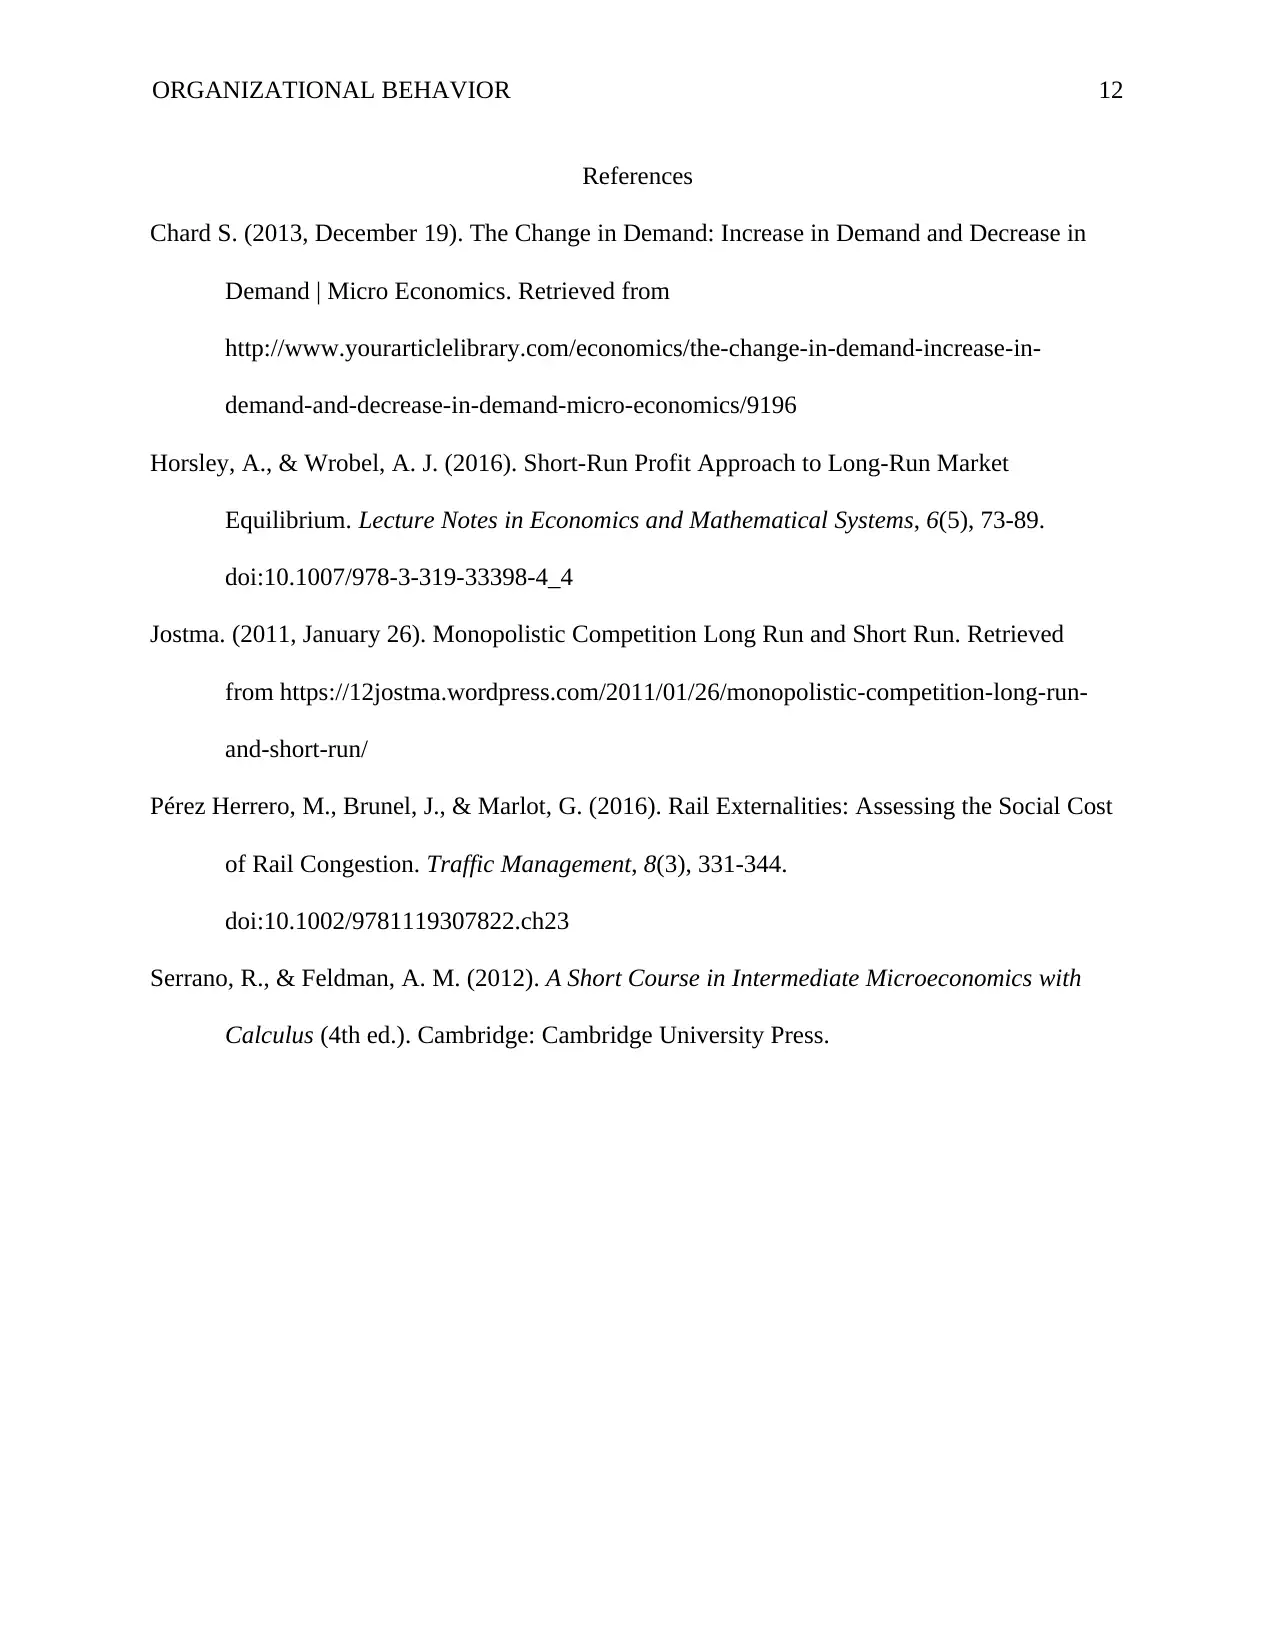
This assignment delves into various economic concepts, starting with an analysis of externalities and their impact on allocative efficiency. It differentiates between private and public goods, providing examples and categorizing services based on excludability and rivalry. The assignment further explores elasticity of demand, including income elasticity and cross-price elasticity, using examples of pre-recorded compact disks and cabinet makers' work. It includes a detailed analysis of two firms operating in different market conditions, calculating total, average, and marginal revenue and costs to determine profit-maximizing output levels. Finally, the assignment examines market equilibrium using diagrams, identifying profit-maximizing output and price, and discusses factors that shift demand curves, such as changes in oil prices. The document concludes by explaining why public goods are not sufficiently produced by private markets. Desklib offers a wealth of similar solved assignments and past papers for students.
Document Page
Running head: ORGANIZATIONAL BEHAVIOR 1
Organizational Behavior
Name
Institution
tabler-icon-diamond-filled.svg

Secure Best Marks with AI Grader

Need help grading? Try our AI Grader for instant feedback on your assignments.
Document Page
ORGANIZATIONAL BEHAVIOR 2
Organizational Behavior
(1) (a)
Source: https://www.economicshelp.org
As is shown by the graphs above, both forms of externalities give rise to allocative inefficiency.
In both diagrams, the market will produce at the point where Qd=Qs, which happens in both
diagrams at the point P1, Q1. Nevertheless, allocative efficiency happens where MSB = MSC
and not at the point where Qd = Qs (PĂ©rez Herrero, Brunel, & Marlot, 2016). Therefore, the
allocative efficient production level take place in both diagrams at the point P*, Q*.
Accordingly, the existence of an externality exists in a perfect competition market causes
resources to misallocated forcing the market to be inefficient. For a negative externality, the
market over-produces output, at too low a price. For positive externality, the market will
underproduce at too low a price
1(b)
A public good or service is an item that is consumed by the entire society and not essentially by a
specific consumer. A good or service become a public good or service when they are non-
Document Page
ORGANIZATIONAL BEHAVIOR 3
excludable and non-rivalrous. This implies that people cannot be successfully excluded from use
and where use by one specific does not decrease availability to others. Examples of public goods
include fresh air, national defense, lighthouses, street lighting, among others.
1(c)
(i) Private good-there is excludability in the use of laboratory as it is a private entity.
(ii) Public service- the services are non-excludable and non-rivalrous.
(iii) Public good-the road can be freely used by anyone
(iv) Private-services-participants can be excluded
(v) Private good-owned privately; can be consumed by one person only.
2(a)
A 10 percent reduction in consumer income during a recession period would see the demand for
pre-recorded compact disk decrease more than proportionate to a change in income changes (this
is a luxury good with a YED>1). On the other side, the demand for cabinet makers work will
decrease less than proportionately to income changes (this is a normal good with a YED<1).
2(b)
By conducting a cross price elasticity of demand analysis for the two commodities to measure
the responsiveness in quantity demanded for MP3 music players when the price of pre-recorded
music compact disks changes.
2(c)
(i) Normal good-has a positive income elasticity of demand implying that s household’s
income increases more is demanded at each price
(ii) Inferior goods-has a negative income elasticity of demand implying that demand falls
as household’s income rises.
Document Page
ORGANIZATIONAL BEHAVIOR 4
2(d)
(i) The two goods are very close substitutes as they have a positive cross-price elasticity
of demand.
(ii) The two goods are complement each other (complementary goods). They have a
negative cross-price elasticity of demand.
3(a)
Firm A
Quantity
Total
Revenue ($)
Average
Revenue($)
Marginal
Revenue($)
Total
Cost ($)
Marginal
Cost ($)
Average
Cost ($)
0 0 - 0 30 0 -
1 10 10 10 42 12 42
2 20 10 10 50 8 25
3 30 10 10 60 10 20
4 40 10 10 76 16 19
5 50 10 10 100 24 20
6 60 10 10 140 40 23.3
Firm B
Quantity
Total Cost
($)
Average
Cost ($)
Marginal
Cost ($) Price($)
Marginal
Revenue($)
Total
Revenue
($)
0 100 - 0 140 - 0
1 134 134 34 130 130 130
2 154 77 20 120 110 240
3 177 59 23 110 90 330
4 216 54 39 100 70 400
5 266 53.2 50 90 50 450
6 366 61 100 80 30 480
tabler-icon-diamond-filled.svg

Secure Best Marks with AI Grader

Need help grading? Try our AI Grader for instant feedback on your assignments.
Document Page
ORGANIZATIONAL BEHAVIOR 5
3(b)
Both Firms are operating in the short run fixed cost at zero units of output production (Firm A
has $ 30 while Firm B has $100). There are no fixed in the long-run.
3(c)
Both firms are operating in prefect competition market. For firm A, an extra output products
generate the equal marginal revenue. For Firm B, as prices reduces, more of its products are
demanded by consumers and vice versa.
3(d)
Profit maximization in the short run is achieved when marginal revenue equals marginal cost
(MR=MR) (Serrano & Feldman, 2012). Thus, Firm A will produce 3 units of output
(MR=MC=10), whereas Firm B will produce 5 units of output (MR=MC=50).
3(e)
Profit is often obtained by subtracting total cost from total revenue.
Firm A will make $ (60-30= $ 30
Firm B will make $ (450-53.2) = $396.8
Thus, in the short-run, Firm B would be more profitable than Firm A.
Document Page
ORGANIZATIONAL BEHAVIOR 6
8(a)
Curve I- Marginal cost (MC)
Curve II-Average Total Cost (ATV)
Curve III-Demand Curve (D)
Curve IV-Marginal Revenue (MR)
8(b)
The diagram represent the short-run equilibrium because the firm is seen to be making abnormal
profits at Q2 units of output (shaded area is the supernormal profit as the AC curve is below the
AR curve) (Jostma, 2011).
Document Page
ORGANIZATIONAL BEHAVIOR 7
8(c)
P3 is not the equilibrium price. Instead, P1 is the equilibrium price where MR=MC(Horsley &
Wrobel, 2016).
8(d)
The profit maximizing output and price are Q2 and P1 respectively.
8(e)
Profit is maximized in the shaded part in the diagram below.
tabler-icon-diamond-filled.svg

Paraphrase This Document

Need a fresh take? Get an instant paraphrase of this document with our AI Paraphraser
Document Page
ORGANIZATIONAL BEHAVIOR 8
8(f)
8(g)
In the above diagram, the firm will produce where MC=MR (the two curves meet) (Jostma,
2011). Since the AC curve is above the AR curve, there is no supernormal profit, as the AVC
=AVR of the good.
Document Page
ORGANIZATIONAL BEHAVIOR 9
9(a)
i) The demand for the automobile will shift to the left as it will become costly for
consumes to fuel their automobiles (the two are complimentary goods) (Chard, 2013).
ii) There will decrease also as the production of goods rely on the oil inputs which will
become costly with increase in price.
iii) A rise oil price will result in an increase in demand of coal as its substitute good.
Document Page
ORGANIZATIONAL BEHAVIOR 10
iv) Demand for tires will reduce as the sales of automobiles reduces due to increased oil
prices
tabler-icon-diamond-filled.svg

Secure Best Marks with AI Grader

Need help grading? Try our AI Grader for instant feedback on your assignments.
Document Page
ORGANIZATIONAL BEHAVIOR 11
v) The demand for cycles will increase as they are substitute goods to automobiles
which will be consumed in low quantities as the price of oil increase.
9(b)
Public goods are not produced in sufficient quantities by private markets as they require huge
setup and maintenance outlays. In addition, if the private markets were to be allowed to produce
these goods, they would monopolize the market by producing less amounts so that they are able
to dictate the prices geared towards earning supernormal profits.
Document Page
ORGANIZATIONAL BEHAVIOR 12
References
Chard S. (2013, December 19). The Change in Demand: Increase in Demand and Decrease in
Demand | Micro Economics. Retrieved from
http://www.yourarticlelibrary.com/economics/the-change-in-demand-increase-in-
demand-and-decrease-in-demand-micro-economics/9196
Horsley, A., & Wrobel, A. J. (2016). Short-Run Profit Approach to Long-Run Market
Equilibrium. Lecture Notes in Economics and Mathematical Systems, 6(5), 73-89.
doi:10.1007/978-3-319-33398-4_4
Jostma. (2011, January 26). Monopolistic Competition Long Run and Short Run. Retrieved
from https://12jostma.wordpress.com/2011/01/26/monopolistic-competition-long-run-
and-short-run/
PĂ©rez Herrero, M., Brunel, J., & Marlot, G. (2016). Rail Externalities: Assessing the Social Cost
of Rail Congestion. Traffic Management, 8(3), 331-344.
doi:10.1002/9781119307822.ch23
Serrano, R., & Feldman, A. M. (2012). A Short Course in Intermediate Microeconomics with
Calculus (4th ed.). Cambridge: Cambridge University Press.
chevron_up_icon
1 out of 12
circle_padding
hide_on_mobile
zoom_out_icon
logo.png

Your All-in-One AI-Powered Toolkit for Academic Success.

Available 24*7 on WhatsApp / Email

[object Object]