Economics: Assessment 2 - Research Essay on Market Structures
VerifiedAdded on 2020/02/24
|11
|2522
|389
Report
AI Summary
This economics assessment is a research essay that delves into the intricacies of various market structures, including perfect competition, monopolistic competition, oligopoly, and monopoly, and their respective characteristics. The essay analyzes each market structure, examining factors like the number of buyers and sellers, product differentiation, price-making power, entry and exit barriers, and the impact on allocative efficiency and economic profit. The essay provides examples of each market structure, such as the egg market and coffee cafes in Australia. Furthermore, the essay explores the concept of negative externalities, using environmental pollution from coal-based thermal power plants as an example, and discusses the role of government intervention to correct market failures. The analysis also includes graphical representations to illustrate key concepts such as profit maximization and welfare loss, as well as the socially desirable market in the presence of negative externalities. The assessment concludes by highlighting the inefficiencies associated with different market structures and the importance of understanding these structures for economic analysis.
ECONOMICS
ASSESSMENT 2 (RESEARCH ESSAY)
STUDENT ID
[Pick the date]
ASSESSMENT 2 (RESEARCH ESSAY)
STUDENT ID
[Pick the date]
Paraphrase This Document
Need a fresh take? Get an instant paraphrase of this document with our AI Paraphraser
Economics
(a)The discussion on the various market structures is carried out as indicated below.
Perfect Competition
It is a market structure which is essentially a theoretical construct and does not exist in
reality. The various characteristics of this market are highlighted below (Arnold, 2008).
It is assumed that the products being sold by the sellers are identical
There are a number of buyers and sellers in the market.
No seller has significant enough market share so as to impact the market, hence the
sellers act as price takers and not price makers. The price is decided on the basis on
the basis of industry demand and supply.
The buyers tend to have perfect information about all the sellers and the price charged
by them due to which any seller who sell at a higher price would not be able to sell
any product.
There are no entry and exit barriers and hence firms can enter and leave the market
with ease.
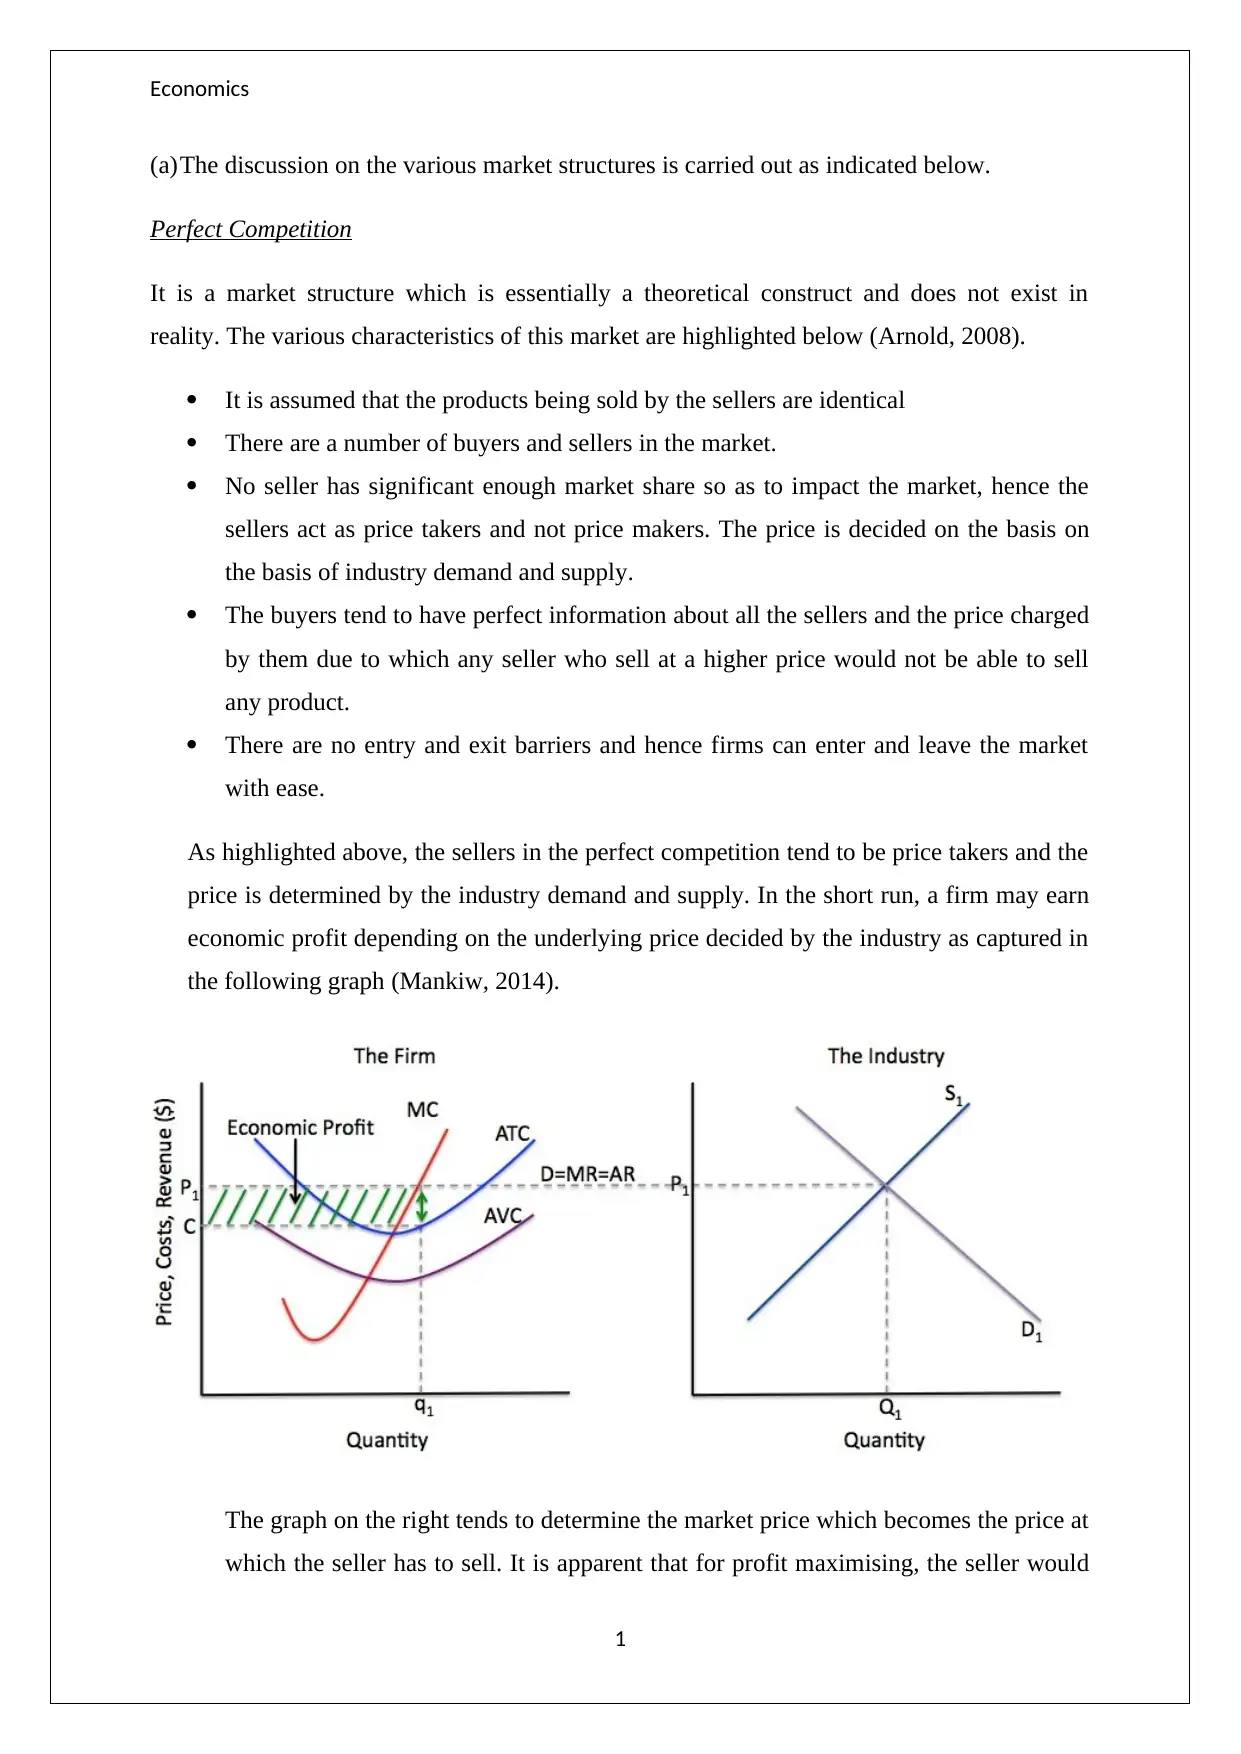
As highlighted above, the sellers in the perfect competition tend to be price takers and the
price is determined by the industry demand and supply. In the short run, a firm may earn
economic profit depending on the underlying price decided by the industry as captured in
the following graph (Mankiw, 2014).
The graph on the right tends to determine the market price which becomes the price at
which the seller has to sell. It is apparent that for profit maximising, the seller would
1
(a)The discussion on the various market structures is carried out as indicated below.
Perfect Competition
It is a market structure which is essentially a theoretical construct and does not exist in
reality. The various characteristics of this market are highlighted below (Arnold, 2008).
It is assumed that the products being sold by the sellers are identical
There are a number of buyers and sellers in the market.
No seller has significant enough market share so as to impact the market, hence the
sellers act as price takers and not price makers. The price is decided on the basis on
the basis of industry demand and supply.
The buyers tend to have perfect information about all the sellers and the price charged
by them due to which any seller who sell at a higher price would not be able to sell
any product.
There are no entry and exit barriers and hence firms can enter and leave the market
with ease.
As highlighted above, the sellers in the perfect competition tend to be price takers and the
price is determined by the industry demand and supply. In the short run, a firm may earn
economic profit depending on the underlying price decided by the industry as captured in
the following graph (Mankiw, 2014).
The graph on the right tends to determine the market price which becomes the price at
which the seller has to sell. It is apparent that for profit maximising, the seller would
1
Economics
choose a quantity where MR(Marginal Revenue) = MC (Marginal Cost). At this
point, the ATC is less than the price or revenue and hence the firm is able to earn a
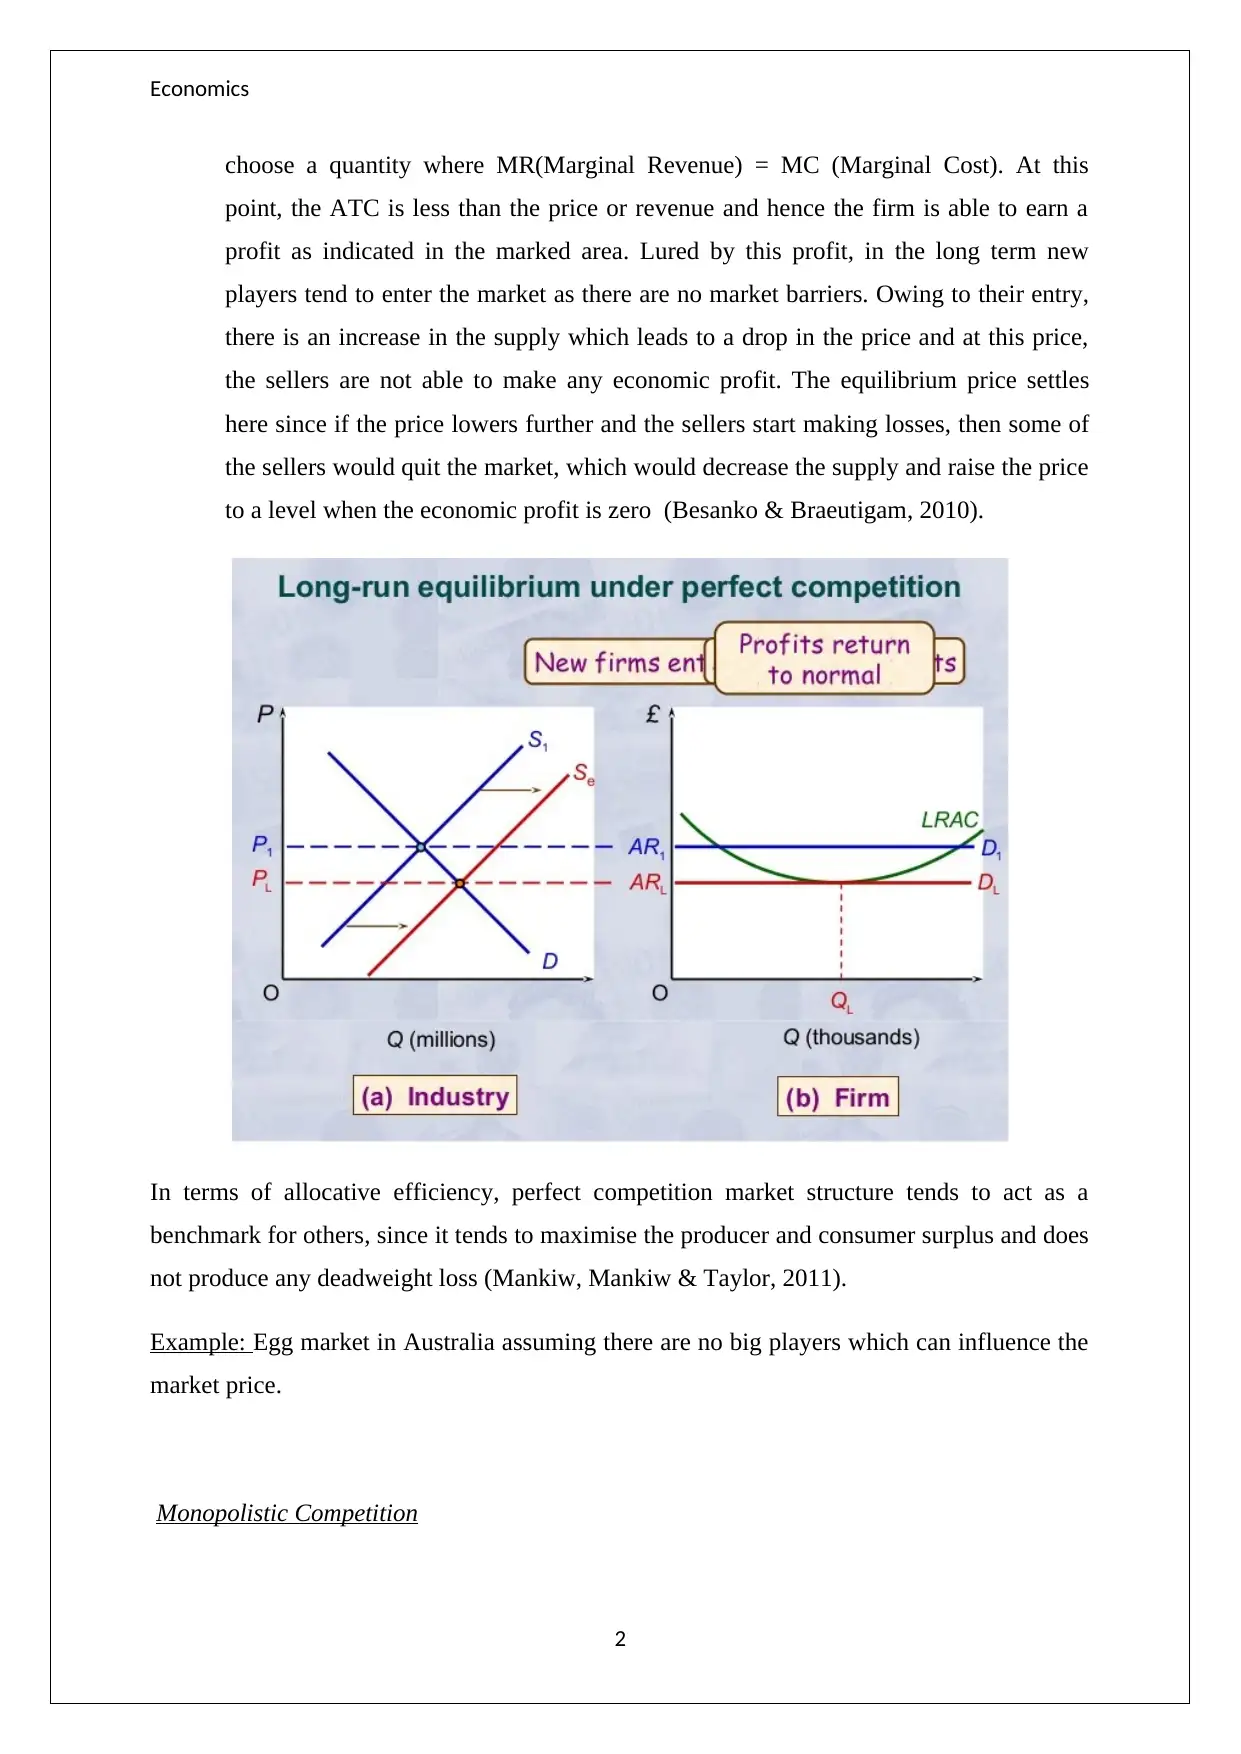
profit as indicated in the marked area. Lured by this profit, in the long term new
players tend to enter the market as there are no market barriers. Owing to their entry,
there is an increase in the supply which leads to a drop in the price and at this price,
the sellers are not able to make any economic profit. The equilibrium price settles
here since if the price lowers further and the sellers start making losses, then some of
the sellers would quit the market, which would decrease the supply and raise the price
to a level when the economic profit is zero (Besanko & Braeutigam, 2010).
In terms of allocative efficiency, perfect competition market structure tends to act as a
benchmark for others, since it tends to maximise the producer and consumer surplus and does
not produce any deadweight loss (Mankiw, Mankiw & Taylor, 2011).
Example: Egg market in Australia assuming there are no big players which can influence the
market price.
Monopolistic Competition
2
choose a quantity where MR(Marginal Revenue) = MC (Marginal Cost). At this
point, the ATC is less than the price or revenue and hence the firm is able to earn a
profit as indicated in the marked area. Lured by this profit, in the long term new
players tend to enter the market as there are no market barriers. Owing to their entry,
there is an increase in the supply which leads to a drop in the price and at this price,
the sellers are not able to make any economic profit. The equilibrium price settles
here since if the price lowers further and the sellers start making losses, then some of
the sellers would quit the market, which would decrease the supply and raise the price
to a level when the economic profit is zero (Besanko & Braeutigam, 2010).
In terms of allocative efficiency, perfect competition market structure tends to act as a
benchmark for others, since it tends to maximise the producer and consumer surplus and does
not produce any deadweight loss (Mankiw, Mankiw & Taylor, 2011).
Example: Egg market in Australia assuming there are no big players which can influence the
market price.
Monopolistic Competition
2
⊘ This is a preview!⊘
Do you want full access?
Subscribe today to unlock all pages.
Trusted by 1+ million students worldwide
Economics
This is a market structure which tends to represent a hybrid of monopoly and perfect
competition. The various characteristics of such a market are indicated below (Mankiw,
2014).
There are a number of buyers and sellers in the market.
The products being sold are not homogeneous and hence product differentiation is
quite common. Hence, advertisement of the product becomes critical.
The sellers are not price takers but rather price makers.
The entry and exit barriers are very less though more than in perfect competition.
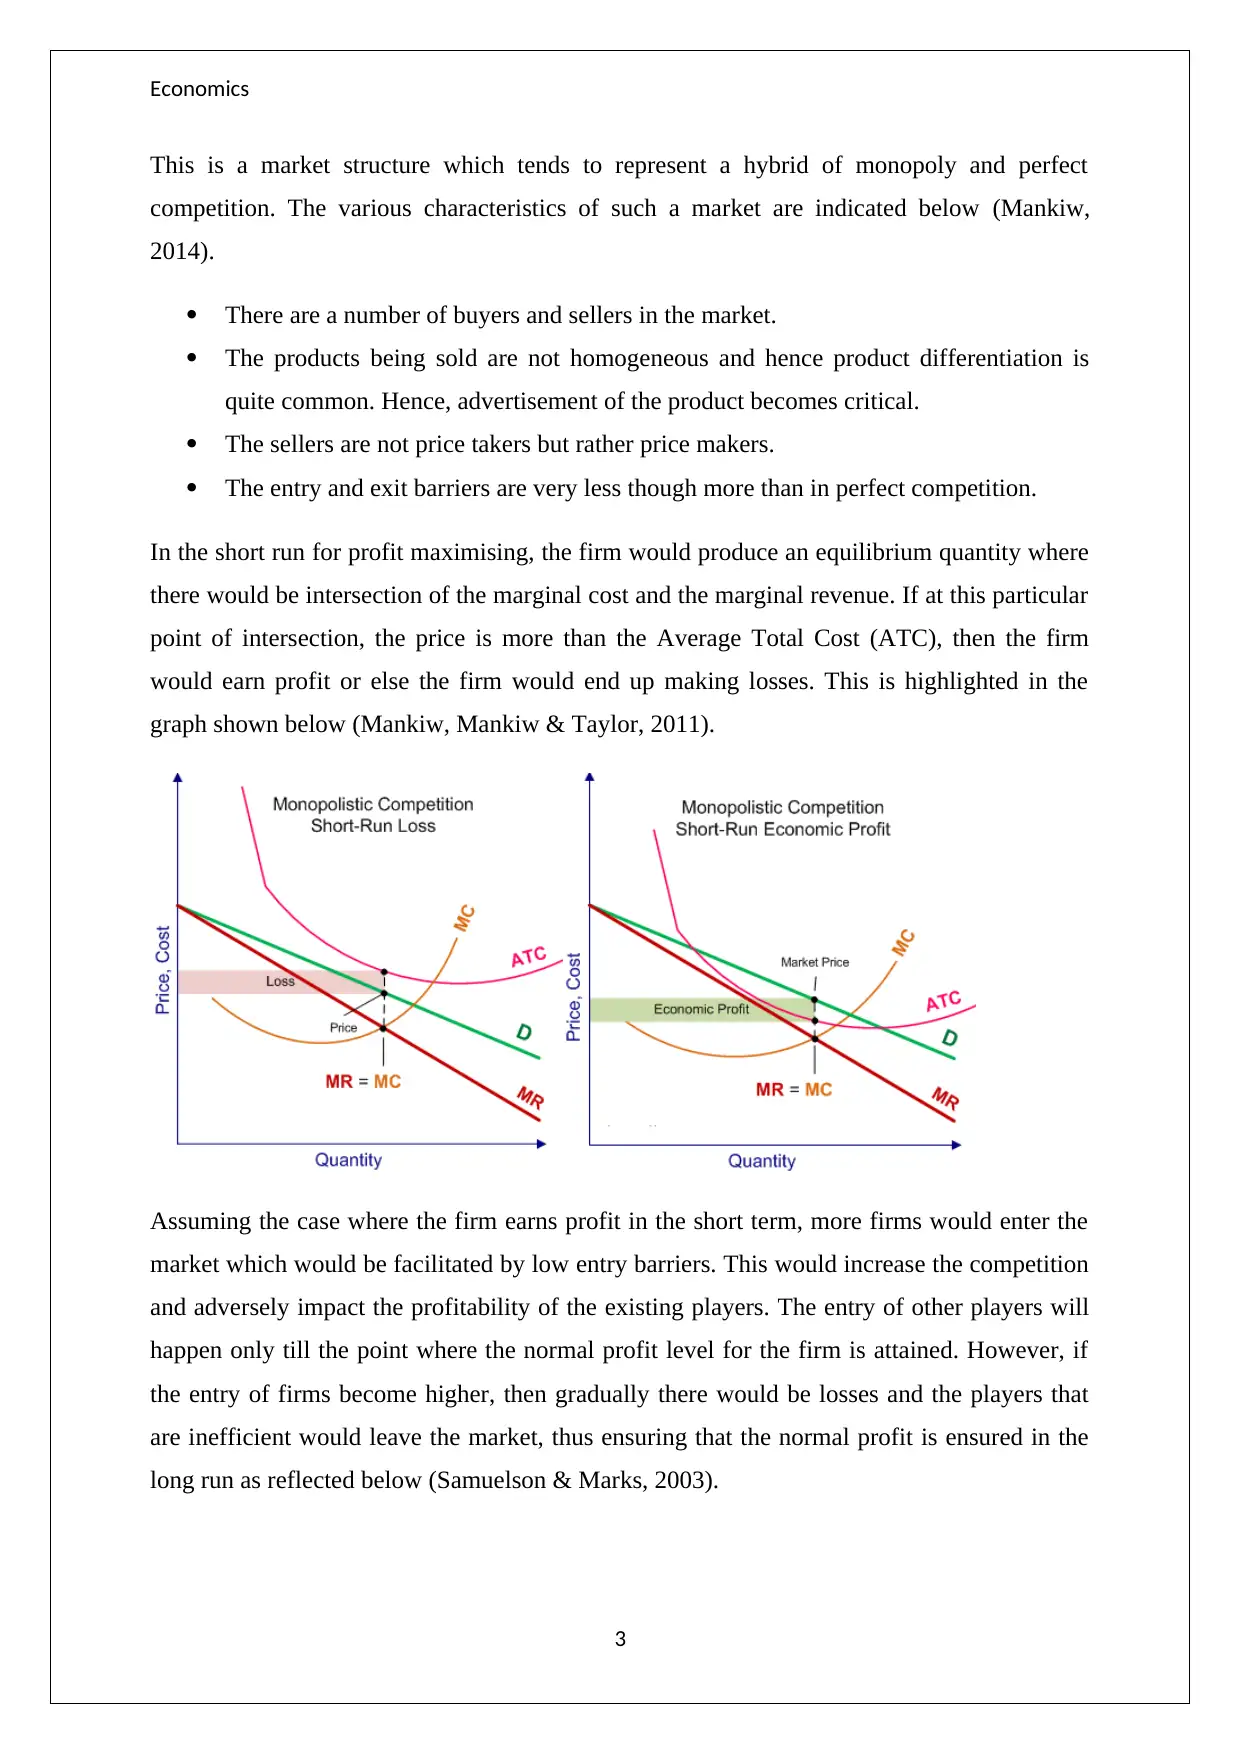
In the short run for profit maximising, the firm would produce an equilibrium quantity where
there would be intersection of the marginal cost and the marginal revenue. If at this particular
point of intersection, the price is more than the Average Total Cost (ATC), then the firm
would earn profit or else the firm would end up making losses. This is highlighted in the
graph shown below (Mankiw, Mankiw & Taylor, 2011).
Assuming the case where the firm earns profit in the short term, more firms would enter the
market which would be facilitated by low entry barriers. This would increase the competition
and adversely impact the profitability of the existing players. The entry of other players will
happen only till the point where the normal profit level for the firm is attained. However, if
the entry of firms become higher, then gradually there would be losses and the players that
are inefficient would leave the market, thus ensuring that the normal profit is ensured in the
long run as reflected below (Samuelson & Marks, 2003).
3
This is a market structure which tends to represent a hybrid of monopoly and perfect
competition. The various characteristics of such a market are indicated below (Mankiw,
2014).
There are a number of buyers and sellers in the market.
The products being sold are not homogeneous and hence product differentiation is
quite common. Hence, advertisement of the product becomes critical.
The sellers are not price takers but rather price makers.
The entry and exit barriers are very less though more than in perfect competition.
In the short run for profit maximising, the firm would produce an equilibrium quantity where
there would be intersection of the marginal cost and the marginal revenue. If at this particular
point of intersection, the price is more than the Average Total Cost (ATC), then the firm
would earn profit or else the firm would end up making losses. This is highlighted in the
graph shown below (Mankiw, Mankiw & Taylor, 2011).
Assuming the case where the firm earns profit in the short term, more firms would enter the
market which would be facilitated by low entry barriers. This would increase the competition
and adversely impact the profitability of the existing players. The entry of other players will
happen only till the point where the normal profit level for the firm is attained. However, if
the entry of firms become higher, then gradually there would be losses and the players that
are inefficient would leave the market, thus ensuring that the normal profit is ensured in the
long run as reflected below (Samuelson & Marks, 2003).
3
Paraphrase This Document
Need a fresh take? Get an instant paraphrase of this document with our AI Paraphraser
Economics
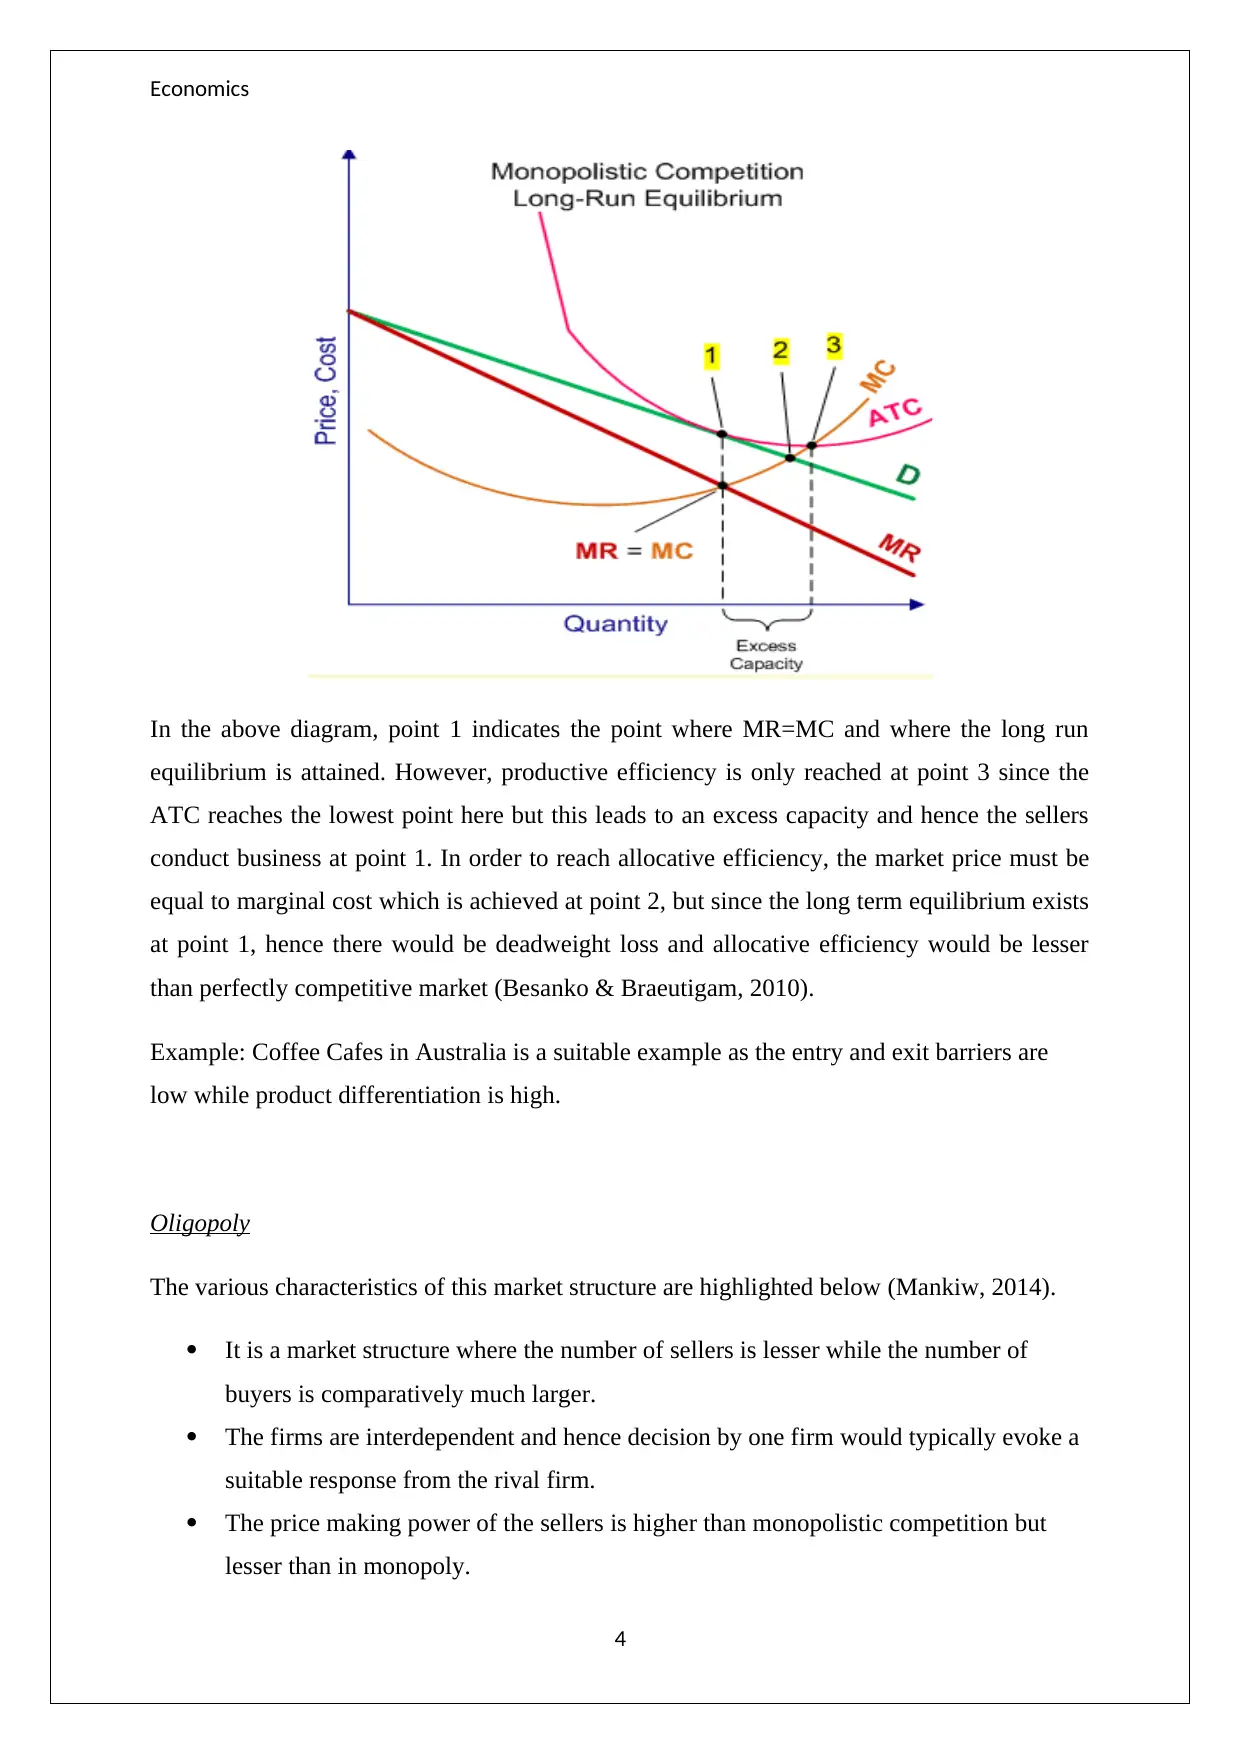
In the above diagram, point 1 indicates the point where MR=MC and where the long run
equilibrium is attained. However, productive efficiency is only reached at point 3 since the
ATC reaches the lowest point here but this leads to an excess capacity and hence the sellers
conduct business at point 1. In order to reach allocative efficiency, the market price must be
equal to marginal cost which is achieved at point 2, but since the long term equilibrium exists
at point 1, hence there would be deadweight loss and allocative efficiency would be lesser
than perfectly competitive market (Besanko & Braeutigam, 2010).
Example: Coffee Cafes in Australia is a suitable example as the entry and exit barriers are
low while product differentiation is high.
Oligopoly
The various characteristics of this market structure are highlighted below (Mankiw, 2014).
It is a market structure where the number of sellers is lesser while the number of
buyers is comparatively much larger.
The firms are interdependent and hence decision by one firm would typically evoke a
suitable response from the rival firm.
The price making power of the sellers is higher than monopolistic competition but
lesser than in monopoly.
4
Economics
There are significant entry and exit barriers due to which entry and exit is difficult.
The competition is based on both price and product attributes. Advertisement
becomes critical especially in those industries where product differentiation is
imperative.
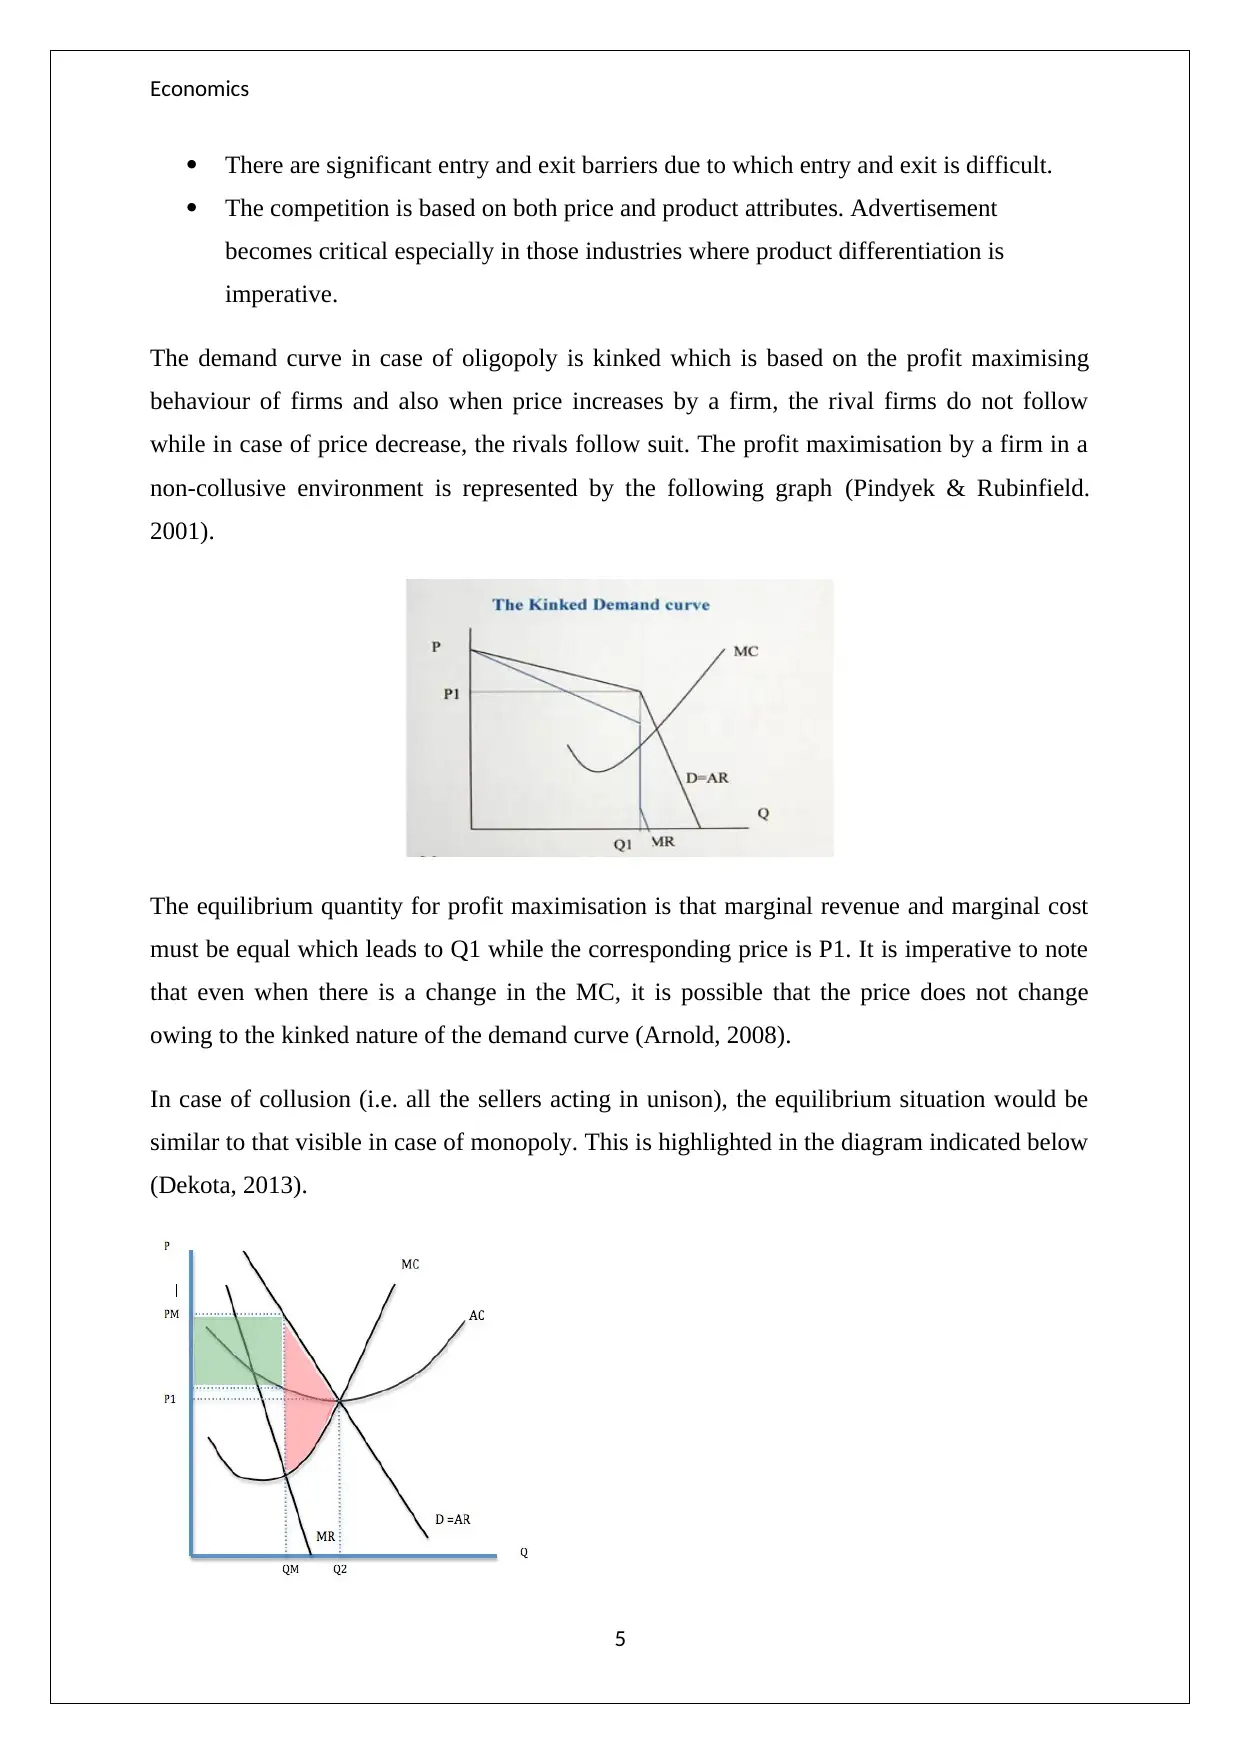
The demand curve in case of oligopoly is kinked which is based on the profit maximising
behaviour of firms and also when price increases by a firm, the rival firms do not follow
while in case of price decrease, the rivals follow suit. The profit maximisation by a firm in a
non-collusive environment is represented by the following graph (Pindyek & Rubinfield.
2001).
The equilibrium quantity for profit maximisation is that marginal revenue and marginal cost
must be equal which leads to Q1 while the corresponding price is P1. It is imperative to note
that even when there is a change in the MC, it is possible that the price does not change
owing to the kinked nature of the demand curve (Arnold, 2008).
In case of collusion (i.e. all the sellers acting in unison), the equilibrium situation would be
similar to that visible in case of monopoly. This is highlighted in the diagram indicated below
(Dekota, 2013).
5
There are significant entry and exit barriers due to which entry and exit is difficult.
The competition is based on both price and product attributes. Advertisement
becomes critical especially in those industries where product differentiation is
imperative.
The demand curve in case of oligopoly is kinked which is based on the profit maximising
behaviour of firms and also when price increases by a firm, the rival firms do not follow
while in case of price decrease, the rivals follow suit. The profit maximisation by a firm in a
non-collusive environment is represented by the following graph (Pindyek & Rubinfield.
2001).
The equilibrium quantity for profit maximisation is that marginal revenue and marginal cost
must be equal which leads to Q1 while the corresponding price is P1. It is imperative to note
that even when there is a change in the MC, it is possible that the price does not change
owing to the kinked nature of the demand curve (Arnold, 2008).
In case of collusion (i.e. all the sellers acting in unison), the equilibrium situation would be
similar to that visible in case of monopoly. This is highlighted in the diagram indicated below
(Dekota, 2013).
5
⊘ This is a preview!⊘
Do you want full access?
Subscribe today to unlock all pages.
Trusted by 1+ million students worldwide
Economics
In the given case, it is apparent that the sellers tend to make supernormal profit as indicated in
green as the price is determined by the industry taking into considering the underlying
demand and profit maximisation is achieved (Mankiw, 2014).
In both the above situations, it is apparent that the allocative efficiency is not achieved since
the charged price by the sellers is significantly higher than the price at which marginal cost is
intersecting the demand curve. Further, this difference becomes higher in case of collusion as
it equates to a monopoly and supernormal profits. Thus, the allocative efficiency is not only
lower than perfect competition but also monopolistic competition (Pindyek & Rubinfield.
2001).
Example: An apt example of oligopoly is the supermarket industry in Australia which is
dominated by few players that have significant market share.
Monopoly
The various characteristics of a monopoly are indicated below (Arnold, 2008).
There is only one seller while there are multiple buyers.
The seller has complete control on the price as there is no competition.
The entry and exit barriers are huge and hence neither a new firm can enter nor can
the existing firm exit.
The firm is the same as industry in the absence of any other player.
The relevant diagram for short run equilibrium in case of a monopoly is indicated below.
6
Paraphrase This Document
Need a fresh take? Get an instant paraphrase of this document with our AI Paraphraser
Economics
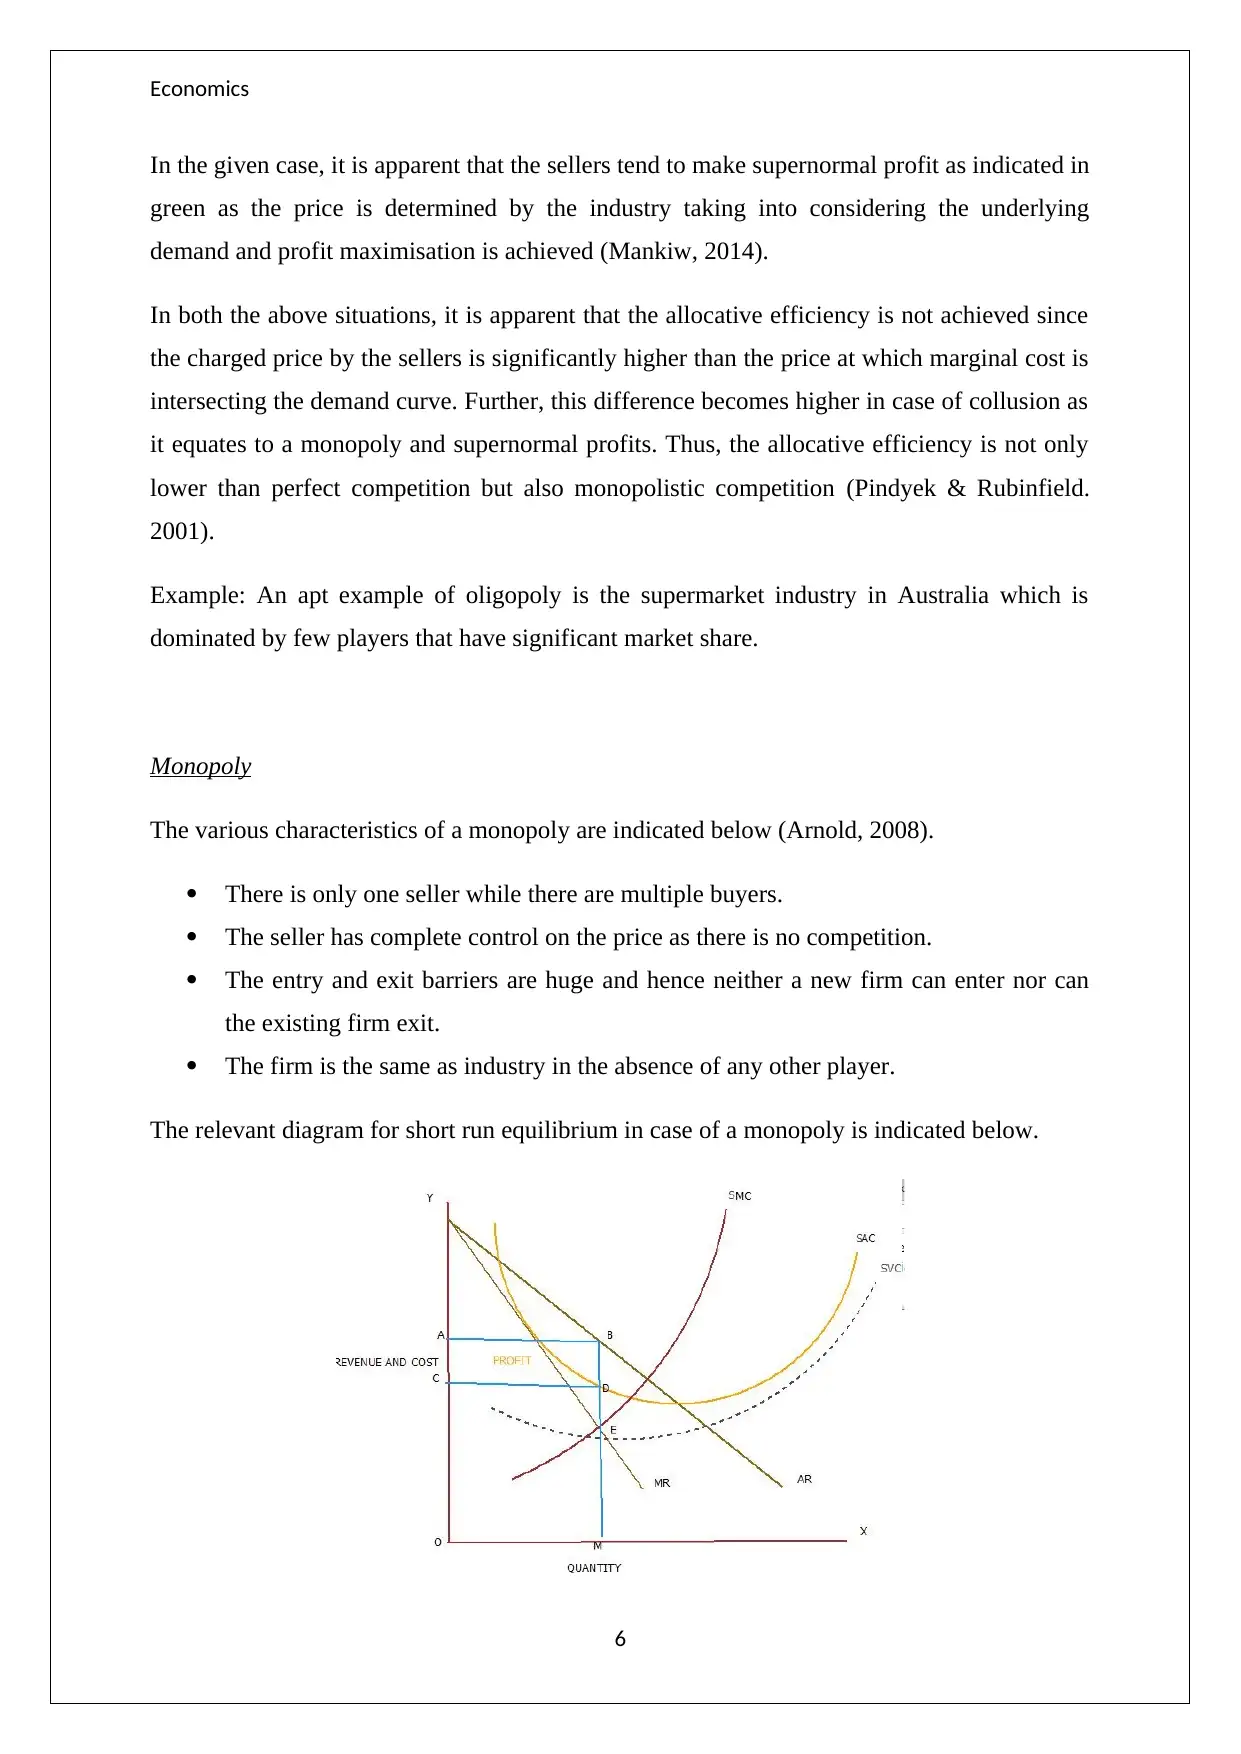
The firm is essentially driven from profit motive and tends to produce more till MR exceeds
MC as it helps in maximising profits. Further the equilibrium quantity is determined using
MR=MC. However, it is noticeable that price charged is significantly higher as compared to
the corresponding price level in perfect competition. Additionally, the monopolist tends to
maintain an artificial shortage so as to keep the price artificially high with the objective of
profit maximisation. Also, since the new firms cannot entry, hence in the long run also, in
monopoly supernormal profits are possible (Paul & Wells, 2008).
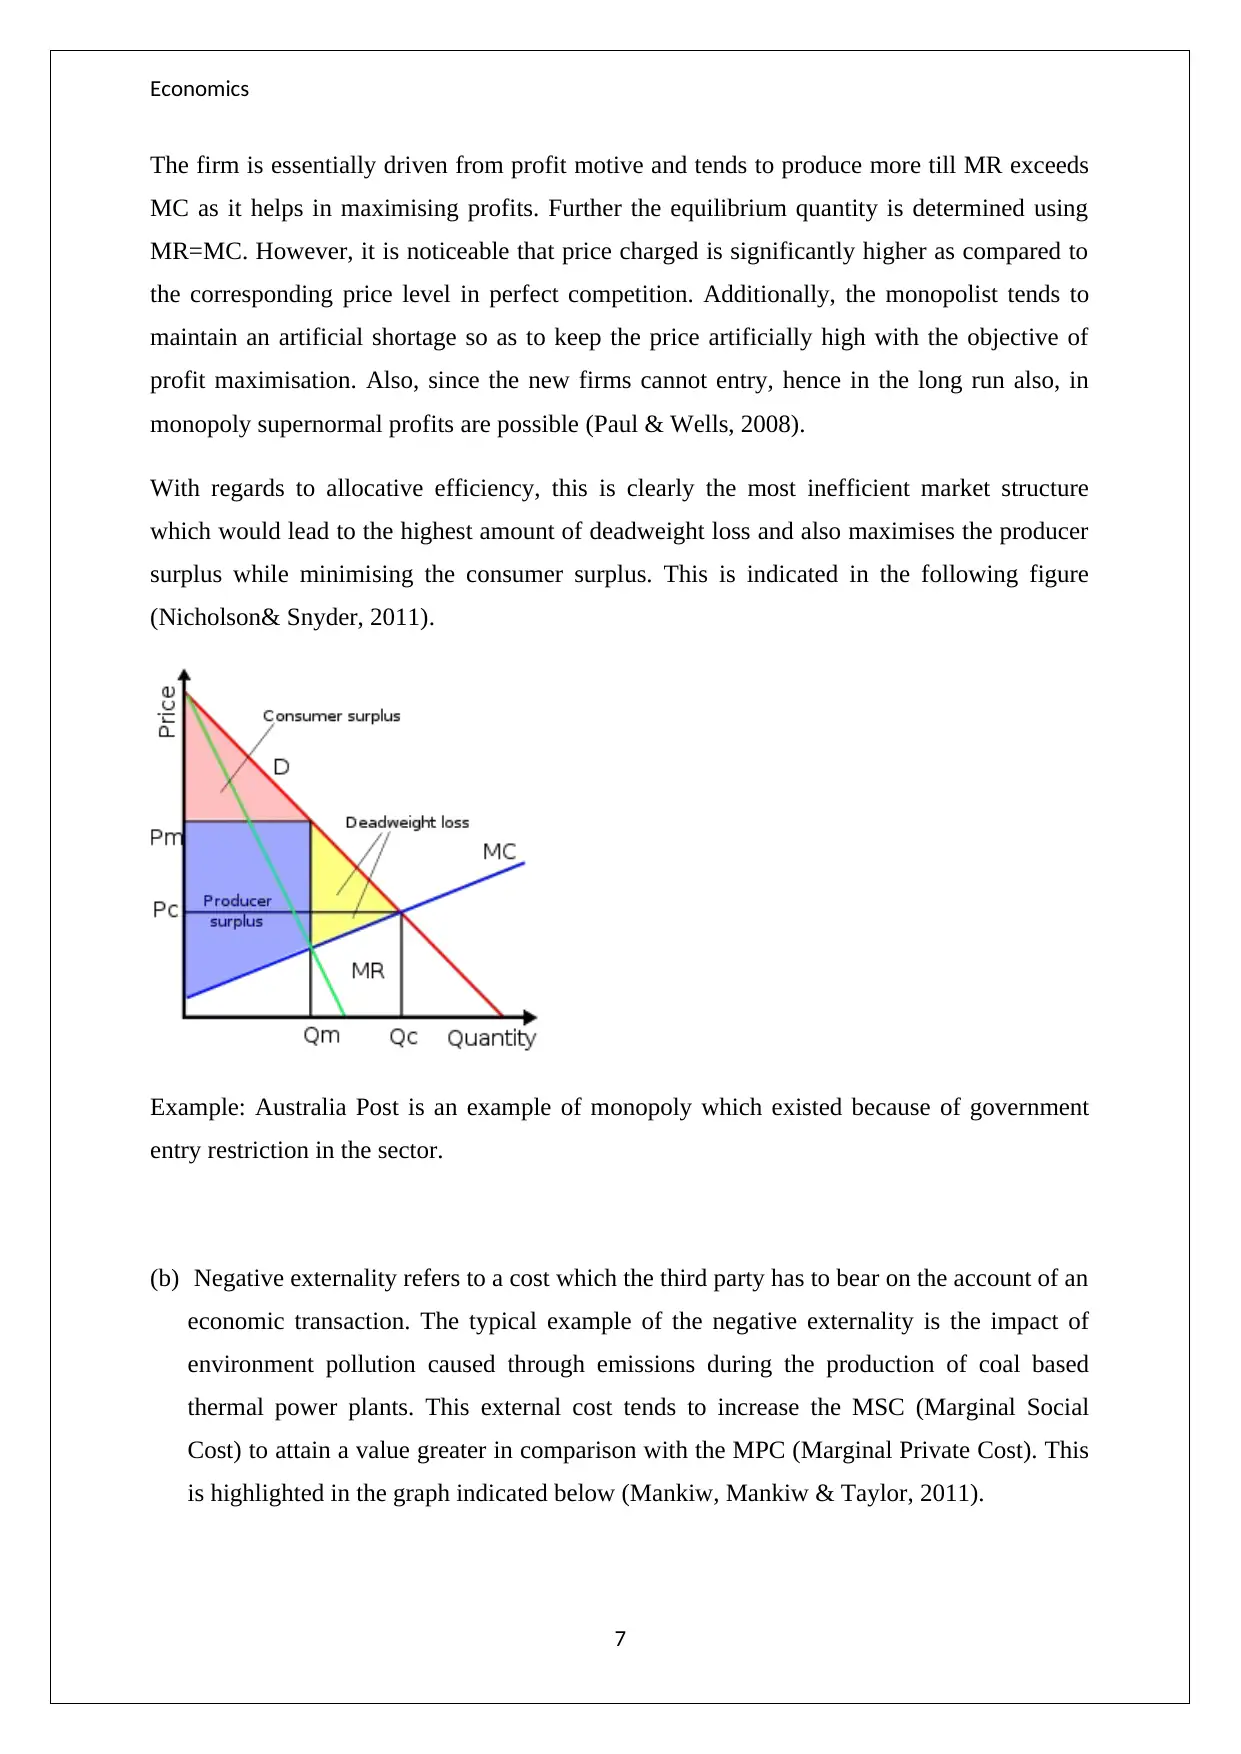
With regards to allocative efficiency, this is clearly the most inefficient market structure
which would lead to the highest amount of deadweight loss and also maximises the producer
surplus while minimising the consumer surplus. This is indicated in the following figure
(Nicholson& Snyder, 2011).
Example: Australia Post is an example of monopoly which existed because of government
entry restriction in the sector.
(b) Negative externality refers to a cost which the third party has to bear on the account of an
economic transaction. The typical example of the negative externality is the impact of
environment pollution caused through emissions during the production of coal based
thermal power plants. This external cost tends to increase the MSC (Marginal Social
Cost) to attain a value greater in comparison with the MPC (Marginal Private Cost). This
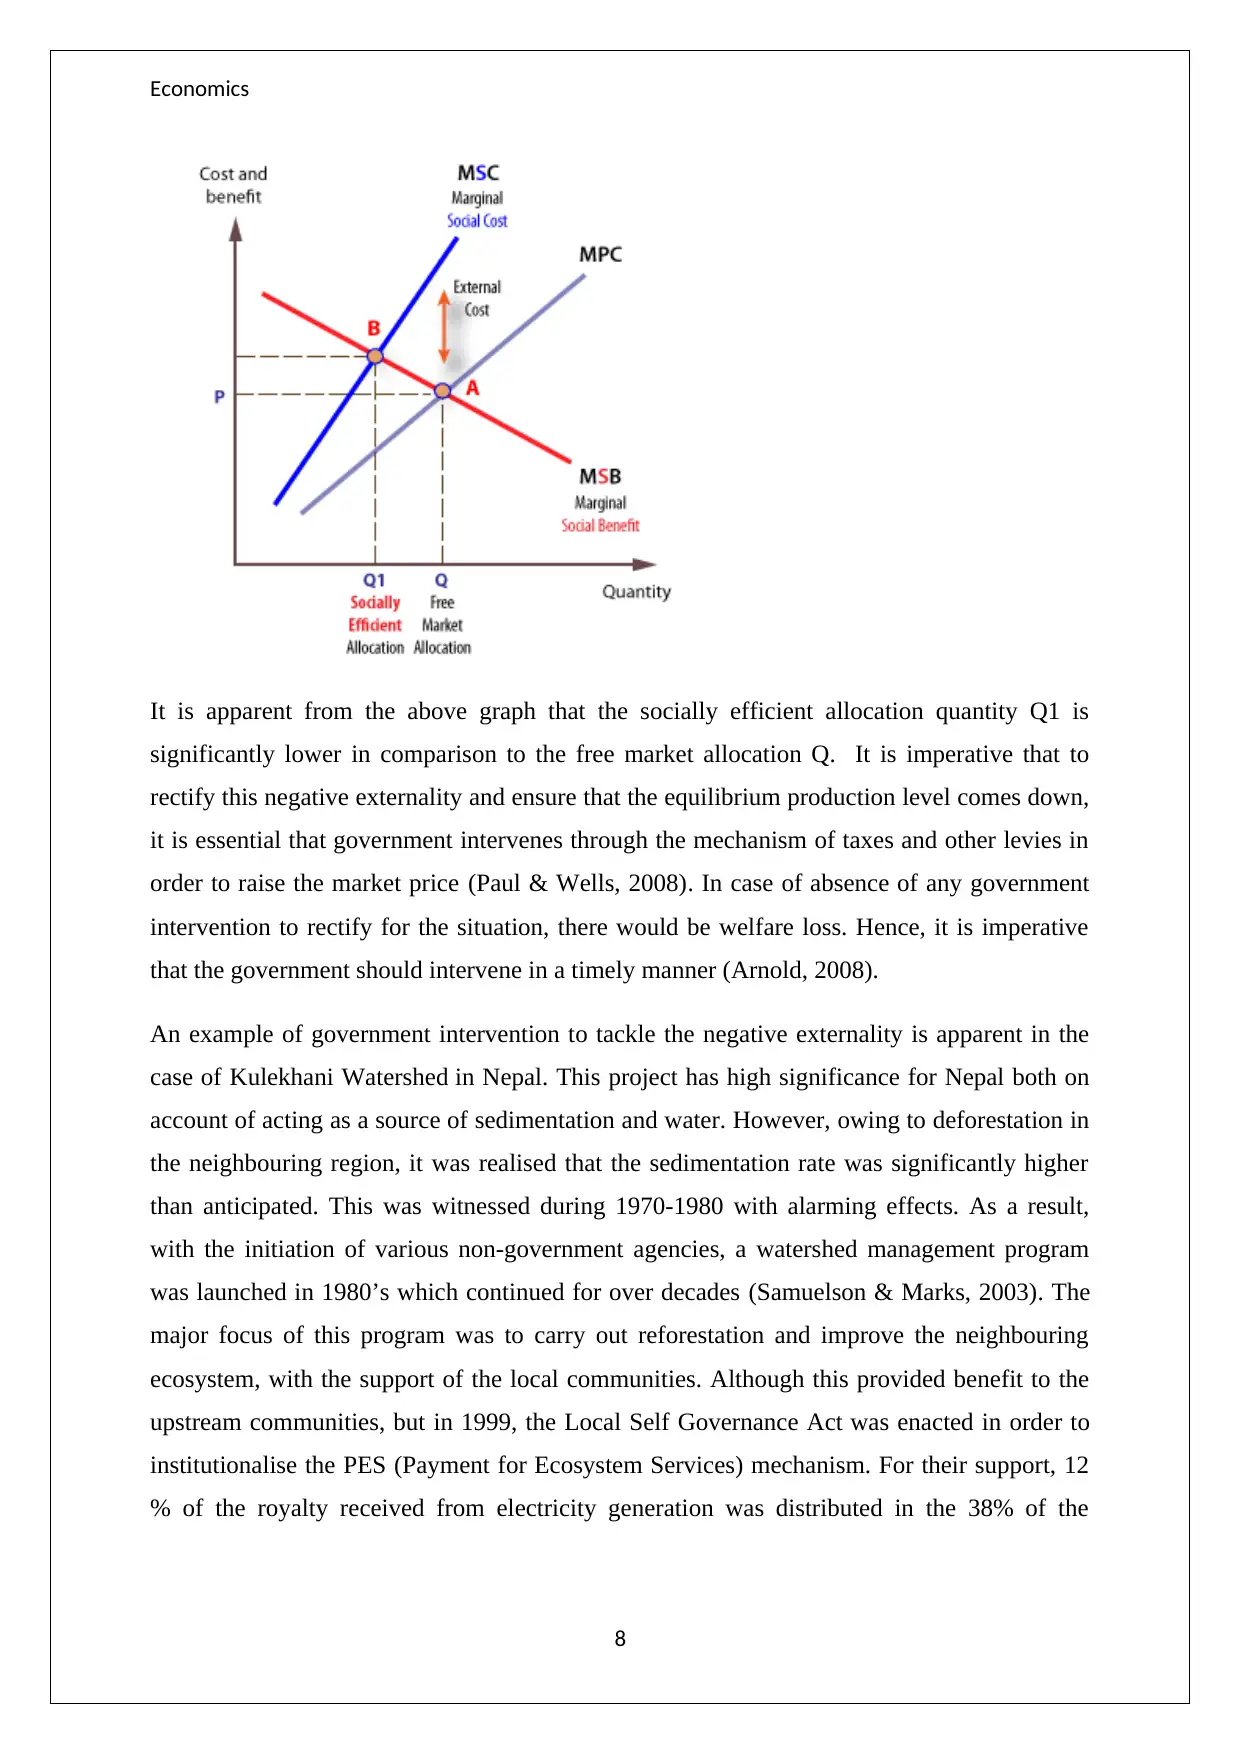
is highlighted in the graph indicated below (Mankiw, Mankiw & Taylor, 2011).
7
The firm is essentially driven from profit motive and tends to produce more till MR exceeds
MC as it helps in maximising profits. Further the equilibrium quantity is determined using
MR=MC. However, it is noticeable that price charged is significantly higher as compared to
the corresponding price level in perfect competition. Additionally, the monopolist tends to
maintain an artificial shortage so as to keep the price artificially high with the objective of
profit maximisation. Also, since the new firms cannot entry, hence in the long run also, in
monopoly supernormal profits are possible (Paul & Wells, 2008).
With regards to allocative efficiency, this is clearly the most inefficient market structure
which would lead to the highest amount of deadweight loss and also maximises the producer
surplus while minimising the consumer surplus. This is indicated in the following figure
(Nicholson& Snyder, 2011).
Example: Australia Post is an example of monopoly which existed because of government
entry restriction in the sector.
(b) Negative externality refers to a cost which the third party has to bear on the account of an
economic transaction. The typical example of the negative externality is the impact of
environment pollution caused through emissions during the production of coal based
thermal power plants. This external cost tends to increase the MSC (Marginal Social
Cost) to attain a value greater in comparison with the MPC (Marginal Private Cost). This
is highlighted in the graph indicated below (Mankiw, Mankiw & Taylor, 2011).
7
Economics
It is apparent from the above graph that the socially efficient allocation quantity Q1 is
significantly lower in comparison to the free market allocation Q. It is imperative that to
rectify this negative externality and ensure that the equilibrium production level comes down,
it is essential that government intervenes through the mechanism of taxes and other levies in
order to raise the market price (Paul & Wells, 2008). In case of absence of any government
intervention to rectify for the situation, there would be welfare loss. Hence, it is imperative
that the government should intervene in a timely manner (Arnold, 2008).
An example of government intervention to tackle the negative externality is apparent in the
case of Kulekhani Watershed in Nepal. This project has high significance for Nepal both on
account of acting as a source of sedimentation and water. However, owing to deforestation in
the neighbouring region, it was realised that the sedimentation rate was significantly higher
than anticipated. This was witnessed during 1970-1980 with alarming effects. As a result,
with the initiation of various non-government agencies, a watershed management program
was launched in 1980’s which continued for over decades (Samuelson & Marks, 2003). The
major focus of this program was to carry out reforestation and improve the neighbouring
ecosystem, with the support of the local communities. Although this provided benefit to the
upstream communities, but in 1999, the Local Self Governance Act was enacted in order to
institutionalise the PES (Payment for Ecosystem Services) mechanism. For their support, 12
% of the royalty received from electricity generation was distributed in the 38% of the
8
⊘ This is a preview!⊘
Do you want full access?
Subscribe today to unlock all pages.
Trusted by 1+ million students worldwide
Economics
villages that fell in the development region and actively led to restoration of the ecological
balance (Mankiw, 2014).
Even though in terms of various efficiencies, a perfect competition market is preferred
against monopoly, but when there is a negative monopoly, then the socially desirable market
tends to be monopoly and not perfect competition (Arnold, 2008). This is primarily on
account of a higher output being produced by a pure competition market in comparison to the
monopoly. The monopoly in order to maximise profits tends to maintain an artificial scarcity
which tends to allow it to keep the price high. This lower production tends to ensure that the
impact of negative externality is also lesser. A comparison in this regard is graphically
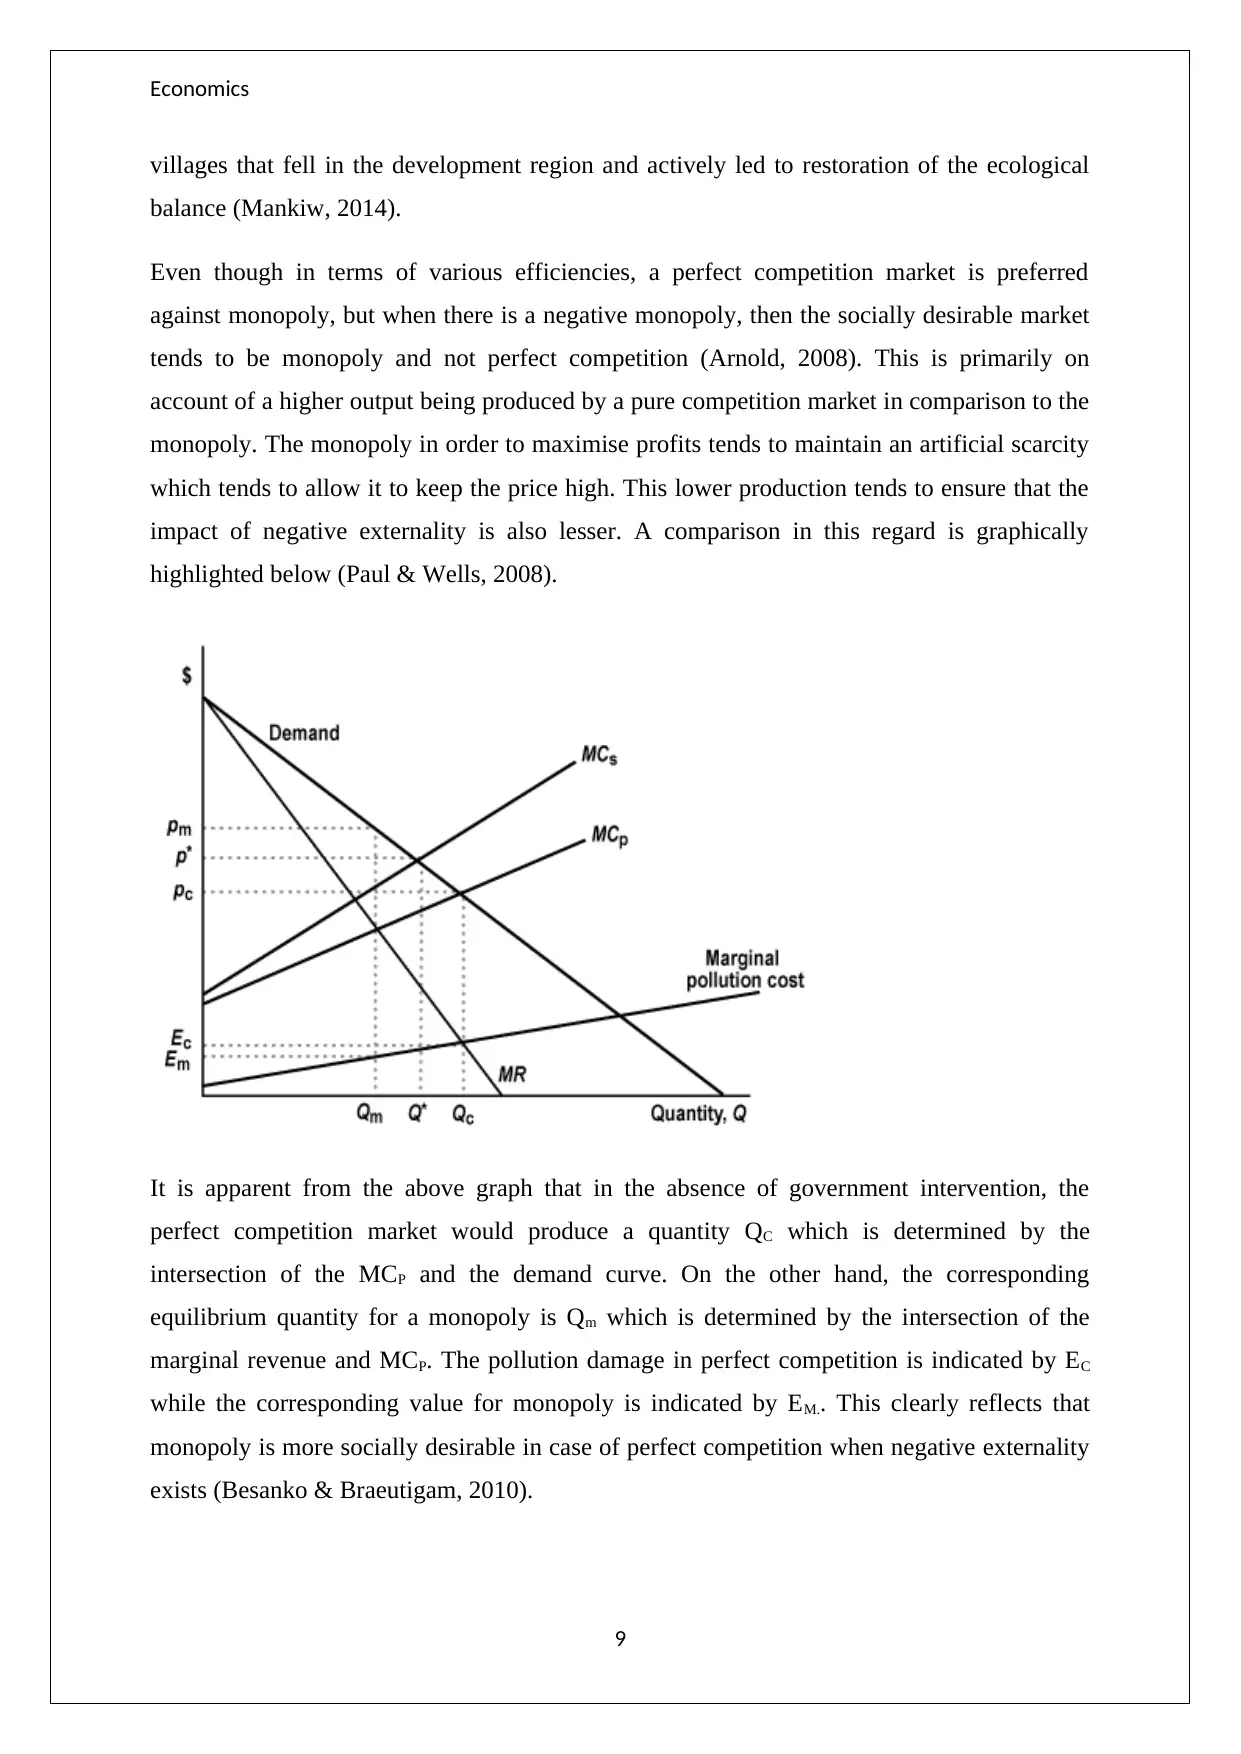
highlighted below (Paul & Wells, 2008).
It is apparent from the above graph that in the absence of government intervention, the
perfect competition market would produce a quantity QC which is determined by the
intersection of the MCP and the demand curve. On the other hand, the corresponding
equilibrium quantity for a monopoly is Qm which is determined by the intersection of the
marginal revenue and MCP. The pollution damage in perfect competition is indicated by EC
while the corresponding value for monopoly is indicated by EM.. This clearly reflects that
monopoly is more socially desirable in case of perfect competition when negative externality
exists (Besanko & Braeutigam, 2010).
9
villages that fell in the development region and actively led to restoration of the ecological
balance (Mankiw, 2014).
Even though in terms of various efficiencies, a perfect competition market is preferred
against monopoly, but when there is a negative monopoly, then the socially desirable market
tends to be monopoly and not perfect competition (Arnold, 2008). This is primarily on
account of a higher output being produced by a pure competition market in comparison to the
monopoly. The monopoly in order to maximise profits tends to maintain an artificial scarcity
which tends to allow it to keep the price high. This lower production tends to ensure that the
impact of negative externality is also lesser. A comparison in this regard is graphically
highlighted below (Paul & Wells, 2008).
It is apparent from the above graph that in the absence of government intervention, the
perfect competition market would produce a quantity QC which is determined by the
intersection of the MCP and the demand curve. On the other hand, the corresponding
equilibrium quantity for a monopoly is Qm which is determined by the intersection of the
marginal revenue and MCP. The pollution damage in perfect competition is indicated by EC
while the corresponding value for monopoly is indicated by EM.. This clearly reflects that
monopoly is more socially desirable in case of perfect competition when negative externality
exists (Besanko & Braeutigam, 2010).
9
Paraphrase This Document
Need a fresh take? Get an instant paraphrase of this document with our AI Paraphraser
Economics
Reference
Arnold, A.R. (2008). Microeconomics (9th ed.). Sydney: Cengage Learning.
Besanko, D. & Braeutigam, R. (2010). Microeconomics (4th ed.). New York: John Wiley &
Sons.
Dekota, D. (2013) Institutional Arrangements for Solving Externality. Retrieved August 28,
2017, from https://bibekacharya.wordpress.com/2013/06/08/institutional-
arrangements-for-solving-externality/
Mankiw, G. (2014) Microeconomics (6th ed.). London: Worth Publishers.
Mankiw, G.N., Mankiw, G.N. & Taylor, P. (2011). Microeconomics (5th ed.). Sydney:
Cengage Learning.
Nicholson, W. & Snyder, C. (2011). Fundamentals of Microeconomics (11th ed.). New York:
Cengage Learning.
Paul, K. & Wells, R. (2008). Microeconomics (2nd ed.). London: Worth Publishers.
Pindyck, R. & Rubinfeld, D. (2001). Microeconomics (5th ed.). London: Prentice-Hall
Publications.
Samuelson, W. & Marks, S. (2003). Managerial Economics (4th ed.). New York: Wiley
Publications.
10
1 out of 11
Related Documents


Your All-in-One AI-Powered Toolkit for Academic Success.
+13062052269
info@desklib.com
Available 24*7 on WhatsApp / Email
![[object Object]](/_next/static/media/star-bottom.7253800d.svg)
Unlock your academic potential
Copyright © 2020–2026 A2Z Services. All Rights Reserved. Developed and managed by ZUCOL.