ECON20039 Economics: Comparative Analysis of Market Structures
VerifiedAdded on 2023/04/21
|15
|4062
|491
Essay
AI Summary
This essay provides a comprehensive analysis of various market structures, beginning with a comparison of perfect competition and monopoly, detailing their key features and the effects of transitioning from one to the other on price, quantity, consumer surplus, producer surplus, and deadweight loss. It then examines the oligopoly market structure within the Australian banking industry, using specific examples of major banks and the role of advertising. Finally, the essay touches on the issue of housing affordability in Australia, linking it to immigration and population growth. The analysis utilizes economic concepts and diagrams to illustrate the differences and implications of each market structure, highlighting the dynamics of competition and market power within the Australian economy.

Running head: ECONOMICS FOR MANAGERS
Economics for Managers
Name of the Student
Name of the University
Author Note
Economics for Managers
Name of the Student
Name of the University
Author Note
Paraphrase This Document
Need a fresh take? Get an instant paraphrase of this document with our AI Paraphraser
1ECONOMICS FOR MANAGERS
Introduction:
Economists differentiate market structure under different headings considering
various factors, such as number of sellers, number of buyers, types of products and profit
making conditions of firms. Hence, to identify a particular type of market, one needs to
analyse these key features accurately. According to the given condition, a perfectly
competitive industry tends to a monopoly one for some reasons. Due this movement, the size
of consumer surplus, producer surplus and deadweight loss also changes. To analyse these
changing situations, it would be beneficial to discuss each type of market precisely
considering their characteristics along with short-run and long-run conditions of profit
making. The consumer surplus represents an economic measure considering benefit of
consumers (Yang & Ng, 2015). The difference between what the consumer wants to pay and
the amount consumer actually pays measures this surplus. On the contrary, producer surplus
represents the difference between the amount a producer wills to supply at existing market
price and the actual amount that the person supplies (Appleyard & Chesbrough, 2017).
Change in surplus value causes deadweight loss within the economy due to the loss of
economic efficiency. This means a market can experience this type of loss if it does not
operate efficiently and charges higher prices compare to its normal profit. In second part the
essay discusses about oligopoly market in Australia. The banking industry of Australia
follows the oligopoly market structure. To justify this statement, it would be beneficial to
relate the characteristics of this oligopoly market with this specified industry. In this context,
the concept of cartel occurs, where a group of firms take output and price decisions together.
Moreover, firms experience barriers to enter into this market due to lack of competition and
lack of profit maximising condition. The third part describes about housing affordability. The
term “housing affordability” indicates the relationship between housing expenditure
considering prices, rents or mortgage payments and household incomes. In Australia, housing
2ECONOMICS FOR MANAGERS
affordability has become an increasing problem for the last few years. One of the chief
reasons of such crisis is growing immigration in this country.
Answer a:
Perfectly competitive industry:
In a perfectly competitive industry, the number of sellers and buyers is unlimited.
Each firm has the opportunity to decide that whether it wants to perform within this industry
or not. As a result, new firms can enter into this market or an existing one can leave this
market based on their profit making condition. This is one of the key characteristics of a
perfectly competitive industry as it cannot be observed in a monopoly market. Another key
feature of this specified industry is that each firm is a price taker (Becker, 2017). This implies
that no firm can change the market price individually as they capture a very small share of the
total industry. Moreover, each firm sells identical products, which are homogeneous and
cannot be differentiated by their size, colour other features. Therefore, it becomes impossible
for each firm to change market price and corresponding quantity of products individually
(Azevedo & Gottlieb, 2017). In this situation, the market price becomes equal with average
revenue and marginal revenue of a perfectly competitive firm.
In short-run, a firm can earn normal profit or economic profit or can incur loss while
in long-run, existing firms earn normal profit only. This situation can be described with the
help of market characteristics. When perfectly competitive firms enjoy economic profits, new
firms intend to enter and this increases total supply of the market (Hayek, 2016). As a result,
excess profits decrease in long run and existing firms get normal profits only. On the
contrary, existing firms leave the market if they incur loss in short-run. This further decreases
total supply of the market and consequently existing firms in long-run start to enjoy normal
⊘ This is a preview!⊘
Do you want full access?
Subscribe today to unlock all pages.
Trusted by 1+ million students worldwide
3ECONOMICS FOR MANAGERS
Quantity
Price
S=MC
P =AR =MR
D
Consumer Surplus
Producer Surplus
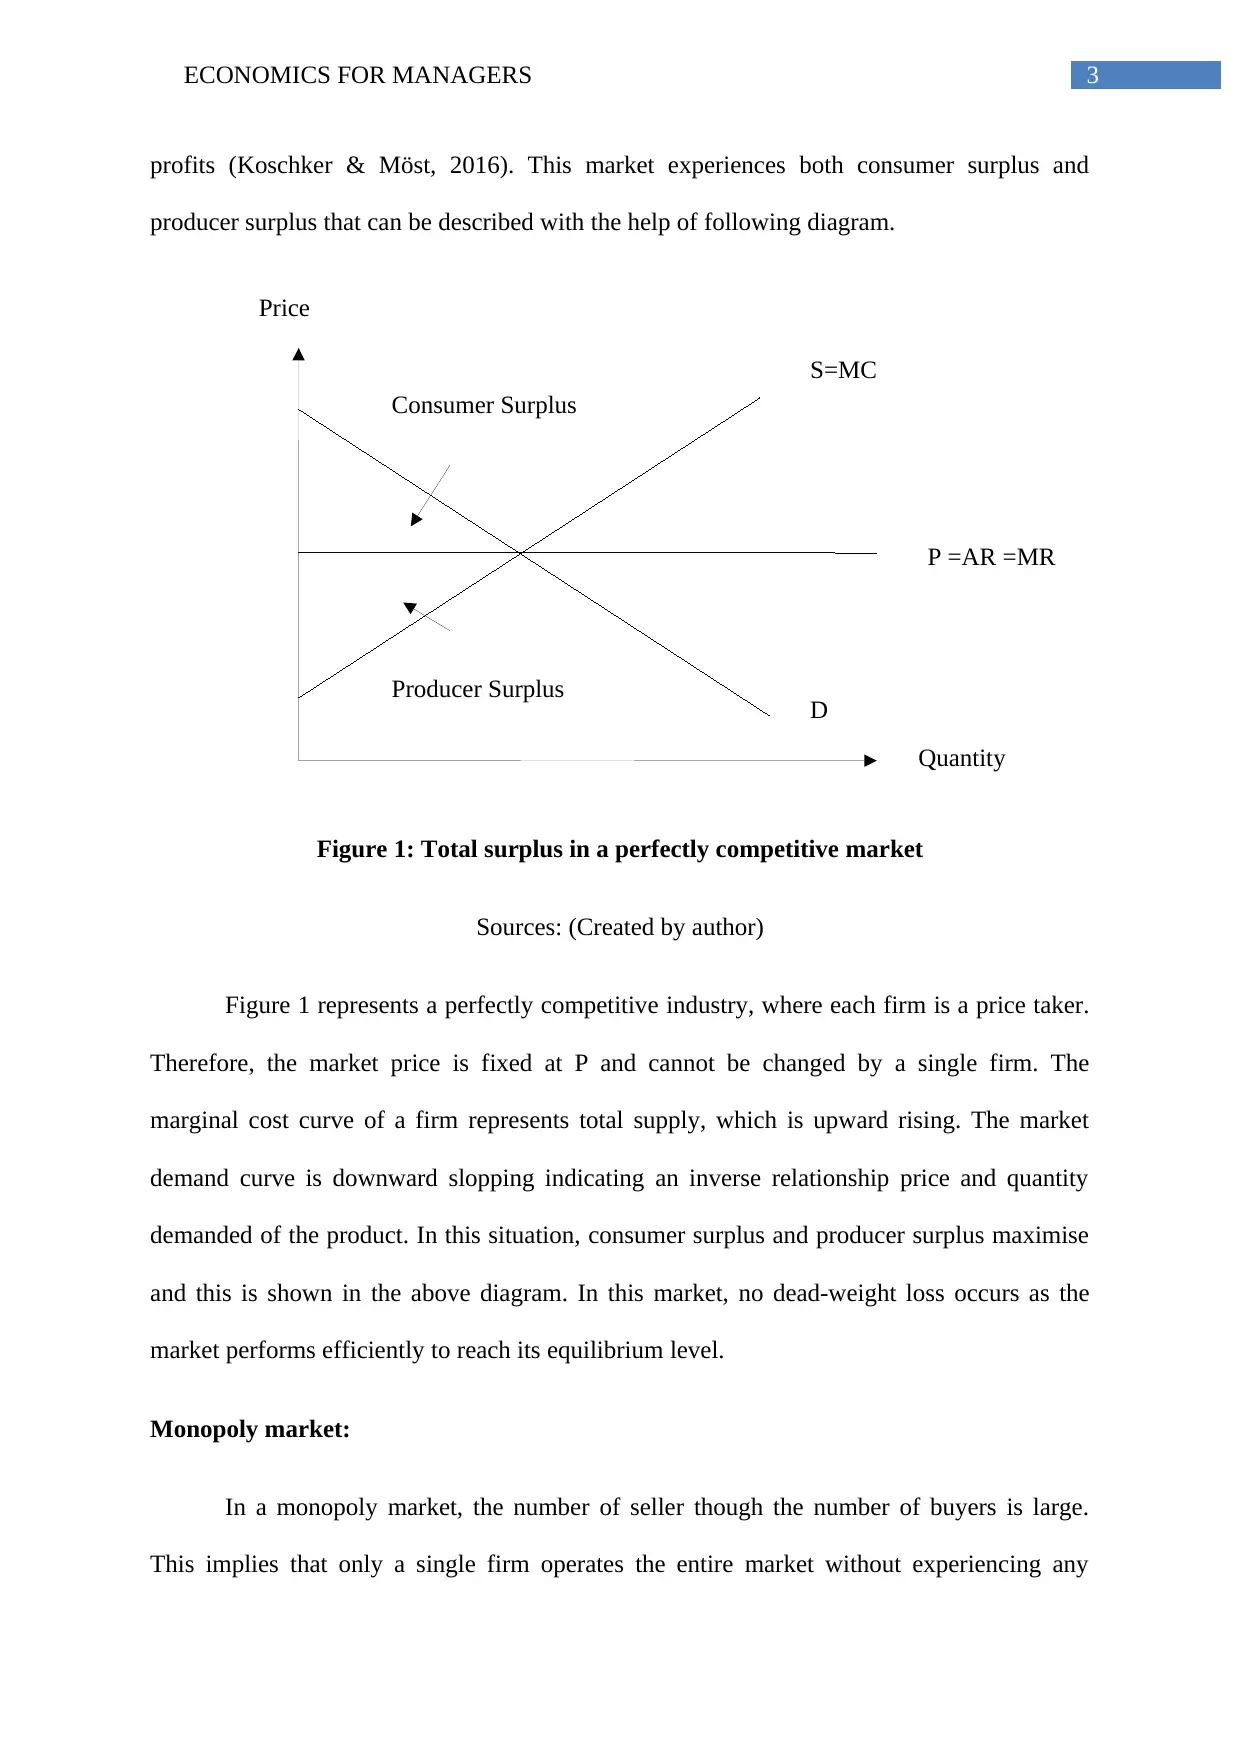
profits (Koschker & Möst, 2016). This market experiences both consumer surplus and
producer surplus that can be described with the help of following diagram.
Figure 1: Total surplus in a perfectly competitive market
Sources: (Created by author)
Figure 1 represents a perfectly competitive industry, where each firm is a price taker.
Therefore, the market price is fixed at P and cannot be changed by a single firm. The
marginal cost curve of a firm represents total supply, which is upward rising. The market
demand curve is downward slopping indicating an inverse relationship price and quantity
demanded of the product. In this situation, consumer surplus and producer surplus maximise
and this is shown in the above diagram. In this market, no dead-weight loss occurs as the
market performs efficiently to reach its equilibrium level.
Monopoly market:
In a monopoly market, the number of seller though the number of buyers is large.
This implies that only a single firm operates the entire market without experiencing any
Quantity
Price
S=MC
P =AR =MR
D
Consumer Surplus
Producer Surplus
profits (Koschker & Möst, 2016). This market experiences both consumer surplus and
producer surplus that can be described with the help of following diagram.
Figure 1: Total surplus in a perfectly competitive market
Sources: (Created by author)
Figure 1 represents a perfectly competitive industry, where each firm is a price taker.
Therefore, the market price is fixed at P and cannot be changed by a single firm. The
marginal cost curve of a firm represents total supply, which is upward rising. The market
demand curve is downward slopping indicating an inverse relationship price and quantity
demanded of the product. In this situation, consumer surplus and producer surplus maximise
and this is shown in the above diagram. In this market, no dead-weight loss occurs as the
market performs efficiently to reach its equilibrium level.
Monopoly market:
In a monopoly market, the number of seller though the number of buyers is large.
This implies that only a single firm operates the entire market without experiencing any
Paraphrase This Document
Need a fresh take? Get an instant paraphrase of this document with our AI Paraphraser
4ECONOMICS FOR MANAGERS
Producer Surplus
Quantity
Price
S
D
Consumer Surplus
Dead weight loss
competition. Therefore, the firm can charge higher price to earn economic profit and
consequently acts as price maker (Mahoney & Weyl, 2017). However, the market does not
allocate resources efficiently due to lack of competition. Due to restriction, others firm cannot
enter into this market and the existing firms cannot leave the market as well. Therefore, this
market can experience economic profit, normal profit or can incur loss both in short-run and
long-run. In this situation, the amount of consumer surplus, producer surplus and dead-weight
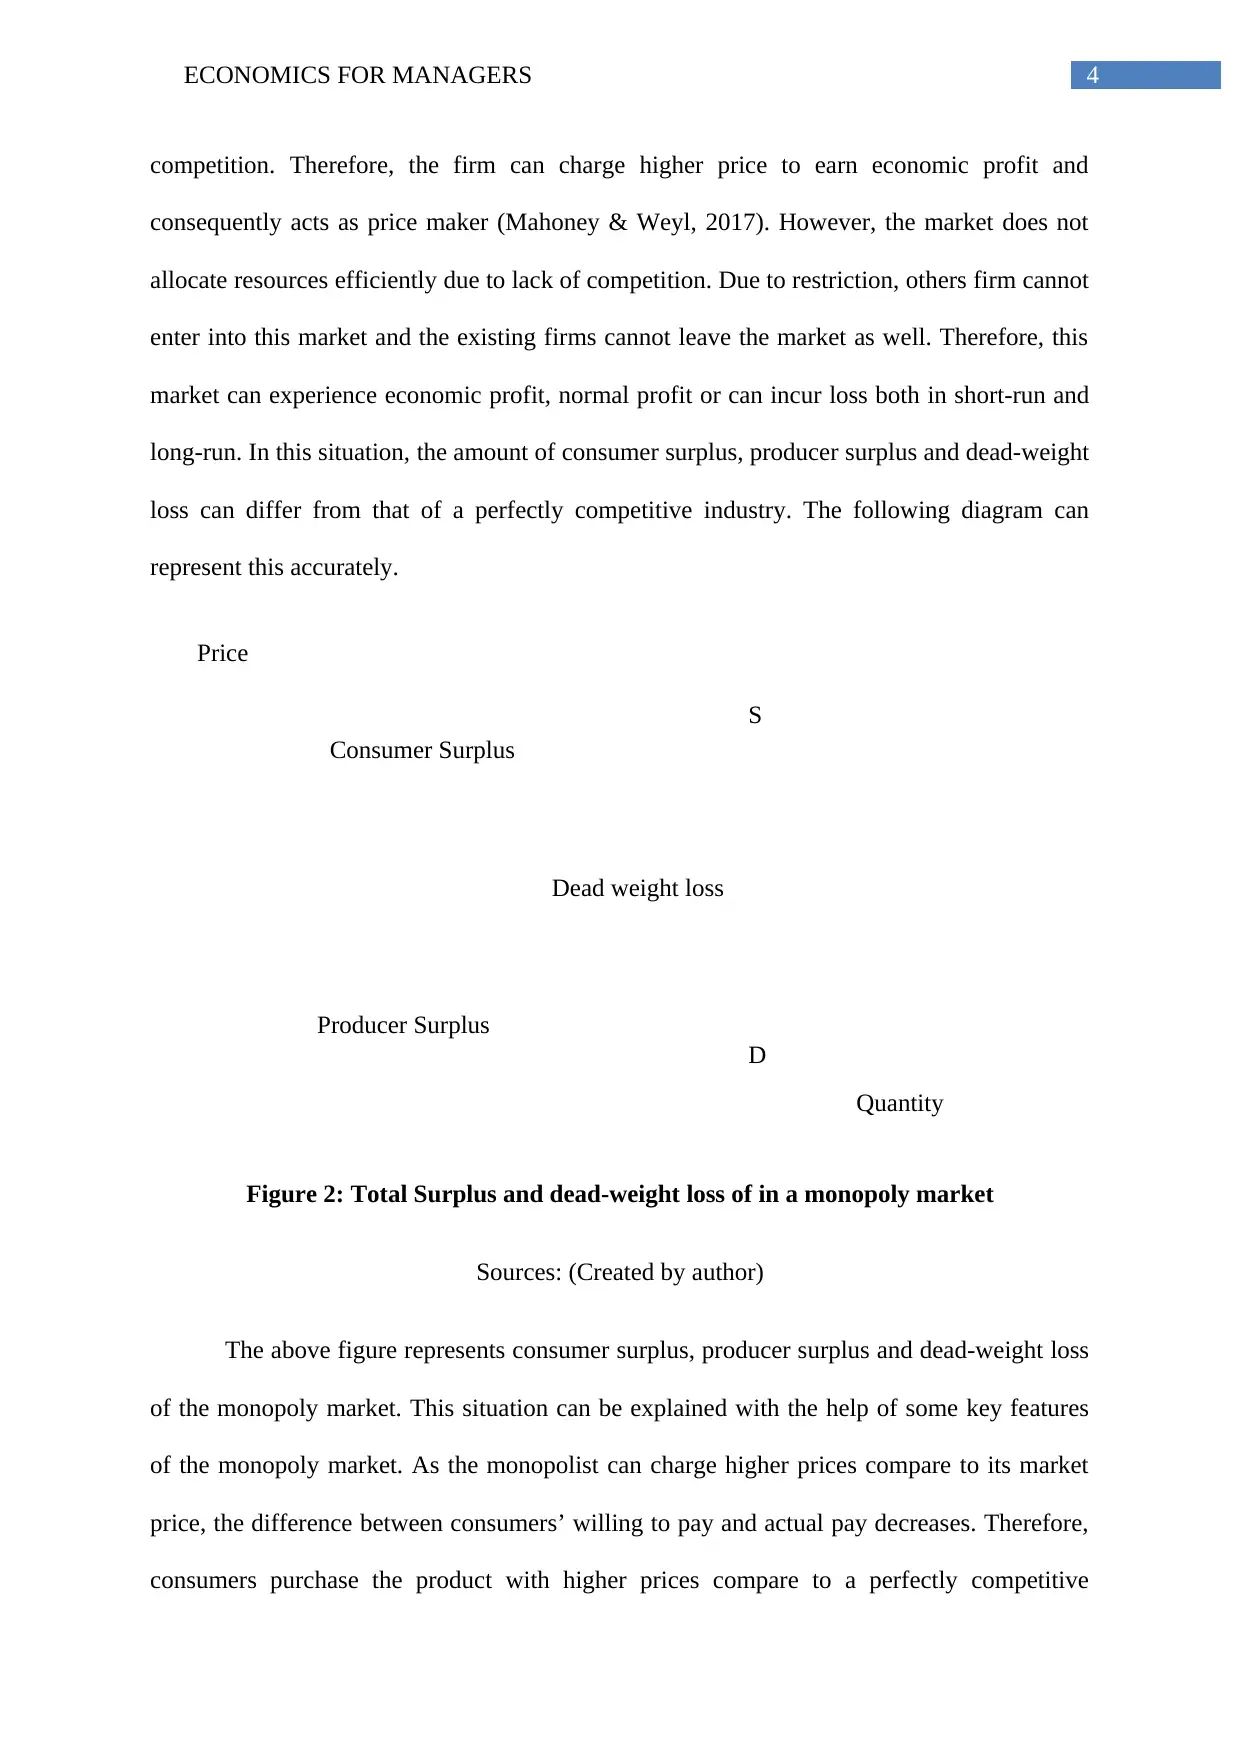
loss can differ from that of a perfectly competitive industry. The following diagram can
represent this accurately.
Figure 2: Total Surplus and dead-weight loss of in a monopoly market
Sources: (Created by author)
The above figure represents consumer surplus, producer surplus and dead-weight loss
of the monopoly market. This situation can be explained with the help of some key features
of the monopoly market. As the monopolist can charge higher prices compare to its market
price, the difference between consumers’ willing to pay and actual pay decreases. Therefore,
consumers purchase the product with higher prices compare to a perfectly competitive
Producer Surplus
Quantity
Price
S
D
Consumer Surplus
Dead weight loss
competition. Therefore, the firm can charge higher price to earn economic profit and
consequently acts as price maker (Mahoney & Weyl, 2017). However, the market does not
allocate resources efficiently due to lack of competition. Due to restriction, others firm cannot
enter into this market and the existing firms cannot leave the market as well. Therefore, this
market can experience economic profit, normal profit or can incur loss both in short-run and
long-run. In this situation, the amount of consumer surplus, producer surplus and dead-weight
loss can differ from that of a perfectly competitive industry. The following diagram can
represent this accurately.
Figure 2: Total Surplus and dead-weight loss of in a monopoly market
Sources: (Created by author)
The above figure represents consumer surplus, producer surplus and dead-weight loss
of the monopoly market. This situation can be explained with the help of some key features
of the monopoly market. As the monopolist can charge higher prices compare to its market
price, the difference between consumers’ willing to pay and actual pay decreases. Therefore,
consumers purchase the product with higher prices compare to a perfectly competitive
5ECONOMICS FOR MANAGERS
market. On the other side, the producer sells this product with higher prices than before and
this in turn increases the producer surplus (Erdogdu, 2016). In addition to this, allocative
inefficiency in the monopoly market creates dead weight loss in both short-run and long-run.
Answer b.
Three chief features can be observed in this market for which one can differentiate it
with other types of markets, such as perfectly competitive and monopolistic competitive one.
Unlike monopoly market, the number of sellers in an oligopoly market is more than two
though it remains limited. Therefore, the first characteristic states that small numbers of
large-scale firms dominate the entire industry (Lamantia & Radi, 2018). According to second
characteristic, firms in this industry sell identical or differentiated products, which are close
substitute. The last characteristic states that other firms experience significant restrictions to
enter into this market. These characteristics along with some others help the market to remain
an oligopolistic one instead of a monopolistic competitive market (Williams, 2016).
According to these other characteristics, interdependency can be observed within firms
during the process of decision making. In addition to this, advertisement plays significant
role. As each firm captures small size of entire industry, they start advertising campaign to
capture to capture the large market share through attracting customers. Furthermore,
oligopolistic firms follow group behaviour, where more than two firms form a group. In this
group, each firm knows that its actions can influence the activities of other firms of the same
group (Nabin et al., 2014).
The feature of oligopoly can be observed in Australian banking sector, where four
chief banks operate the entire industry. These major banks are National Australia Bank
(NAB), Commonwealth Bank (CBA), Australia and New Zealand Banking Group (ANZ) and
Westpac (McIlroy, 2018). As per the statistical data of 2017, CBA takes the first position
⊘ This is a preview!⊘
Do you want full access?
Subscribe today to unlock all pages.
Trusted by 1+ million students worldwide
6ECONOMICS FOR MANAGERS
with AUD 139.219 billion amount while Westpac ANZ and NAB take second, third and
fourth position respectively. These four banks form a cartel agreement, as they have a
common interest. The chief interest of each bank is to maximise individual profit and for this
they make such agreement. This in turn generates barriers for new banks to enter into this
industry. As a result, the Australian banking industry faces the highest barriers as new banks
cannot compete with these four existing banks due to higher cost and risk (Tyers, 2015). The
cartel agreement leads the market to experience very low pressure of competition. As a result,
the existing banks did not experience any difficulties during 2012 when interest rate
decreased significantly (Miller, 2018). Moreover, each of these four banks has large interest
margins as well as lower operational costs for which they can earn economic profits. In
addition to this, Australian banking sector receives supports from the government for which
they can regulate the entire industry with the help of proper policies and regulations.
In Australia, other sectors also operate under this oligopoly market structure, such as
retail industry. In this sector, two large supermarkets capture almost 70 percent of the total
market share. These are Coles and Woolworths, which together has make an oligopoly form
of market (Freebairn, 2018). In this market, advertisement plays a crucial role though its
effectiveness and efficiency depends entirely on product differentiation. These two retail
companies supply almost same kind of products and services to the same customers.
However, customers differentiate their preferences based on some characteristics that depend
entirely on individual brand of products. However, it is impossible for them to know about
these brand details without any advertisement.
Due to some reasons, the oligopolistic industries in Australia use advertisement by
large extend of compare the same of other countries. This can be explained briefly with some
instances. The retail sector is dominated by two large companies, which control the
innovators successfully through capturing supply chain. Due to lack of government
Paraphrase This Document
Need a fresh take? Get an instant paraphrase of this document with our AI Paraphraser
7ECONOMICS FOR MANAGERS
regulations in this type of market, each company tries to maximise profits through applying
advertisement strategies. In international market, competition has been considered as a major
issue where large firms generally dominate the entire markets (Chung, 2018). This further
increases prices as well as profits and reduces the number of suppliers. As a result, the global
economy experiences a slower growth rate of wages and productivity. On the contrary, weak
competition in oligopoly industries have promoted the concept of advertisement significantly.
Big firms do not play any dominating role. Moreover, less than 20 percent economy of
Australia is highly insulated and concentrated from trade competition (da Cruz, 2018). On the
contrary, some large scale oligopolies such as banking, supermarkets, wireless telecoms and
insurance sectors are concentrated maximum share of the economy compare to other sectors
of Australia. Therefore, less market power along with less competition influence these
companies to advertise their products and services in order to attract customers for making
profit. The power of large firms does not increase significantly in the large concentrated
sectors. For instance, the major banks have lost their market share by small amount after
absorbing BankWest and St George. In addition to this, the duopoly market in supermarkets
has also lost a small market share as well.
However, this lack of regulations has brought certain problems for each company,
which operates within this oligopolistic market. On other countries, however, strict
government rules and regulations protect this type of markets significantly. Therefore,
economists state that a well-written as well as well-regulated regulation is required to
maintain fair competition among companies.
Answer c:
People across the world come into Australia for the purpose of jobs or higher
education (Cheong & Li, 2018). As a result, the country experiences increasing rate of
8ECONOMICS FOR MANAGERS
immigration and population growth. Therefore, demand for houses is increasing significantly
over the years. On the contrary, supply of new houses does not increase the opportunities for
poor to obtain affordable houses. Housing affordability has been reduced since the beginning
of 1980s. According to the price to income ratio index of OECD, this affordability has
increases by 78 percent between 1980 and 2015 (Iwuagwu & Nwankwo, 2018). In Sydney,
housing prices have increased significantly over the years. According to the calculations of
Parliamentary Library, the ratio of average disposable income of households to the median
prices of house has increased from 1981 to 2015 by 4. However, this affordability rate differ
state and city wise. This increasing housing price reduces the levels of ownership of homes in
Australia. Based on the Household, Income and Labour Dynamics in Australia Survey of
2016 it is observed that 68.8 percent of total households in 2001 were occupied by home-
owners while in 2014 this percent were 64.9 percent (Daniel, Baker & Lester, 2018). This
trend decreased significantly in Victoria by 7.8 percent while in New South Wales this
percentage reduced by 4.3 percent. Moreover, housing affordability in South Australia was
reduced by 2.5 percent.
Furthermore, the affordability of renters also changed between 1994 and 2013-14.
The proportion of rental houses has increased from 26 percent to 31 percent during this year.
Moreover, the proportion of rents from private landlords has also increased from 18 percent
to 26 percent during this period. Therefore, private renters spend more shares from their gross
household income due to housing costs. According to the report of report of ABS, these
private renters have spent 20 percent of their household income due to housing costs during
2013-14 while others have spent 16 percent of household income for mortgage in the same
year. Therefore, housing affordability has become a major issue for the last 40 years, as
demand for new houses increase significantly compare to its supply (Landrigan, Kerr,
Dhaliwal & Pollard, 2019). Many people of Australia dream for having own home. This
⊘ This is a preview!⊘
Do you want full access?
Subscribe today to unlock all pages.
Trusted by 1+ million students worldwide
9ECONOMICS FOR MANAGERS
Price
Quantity
S
D1
D0
P1
P0
Q0 Q1
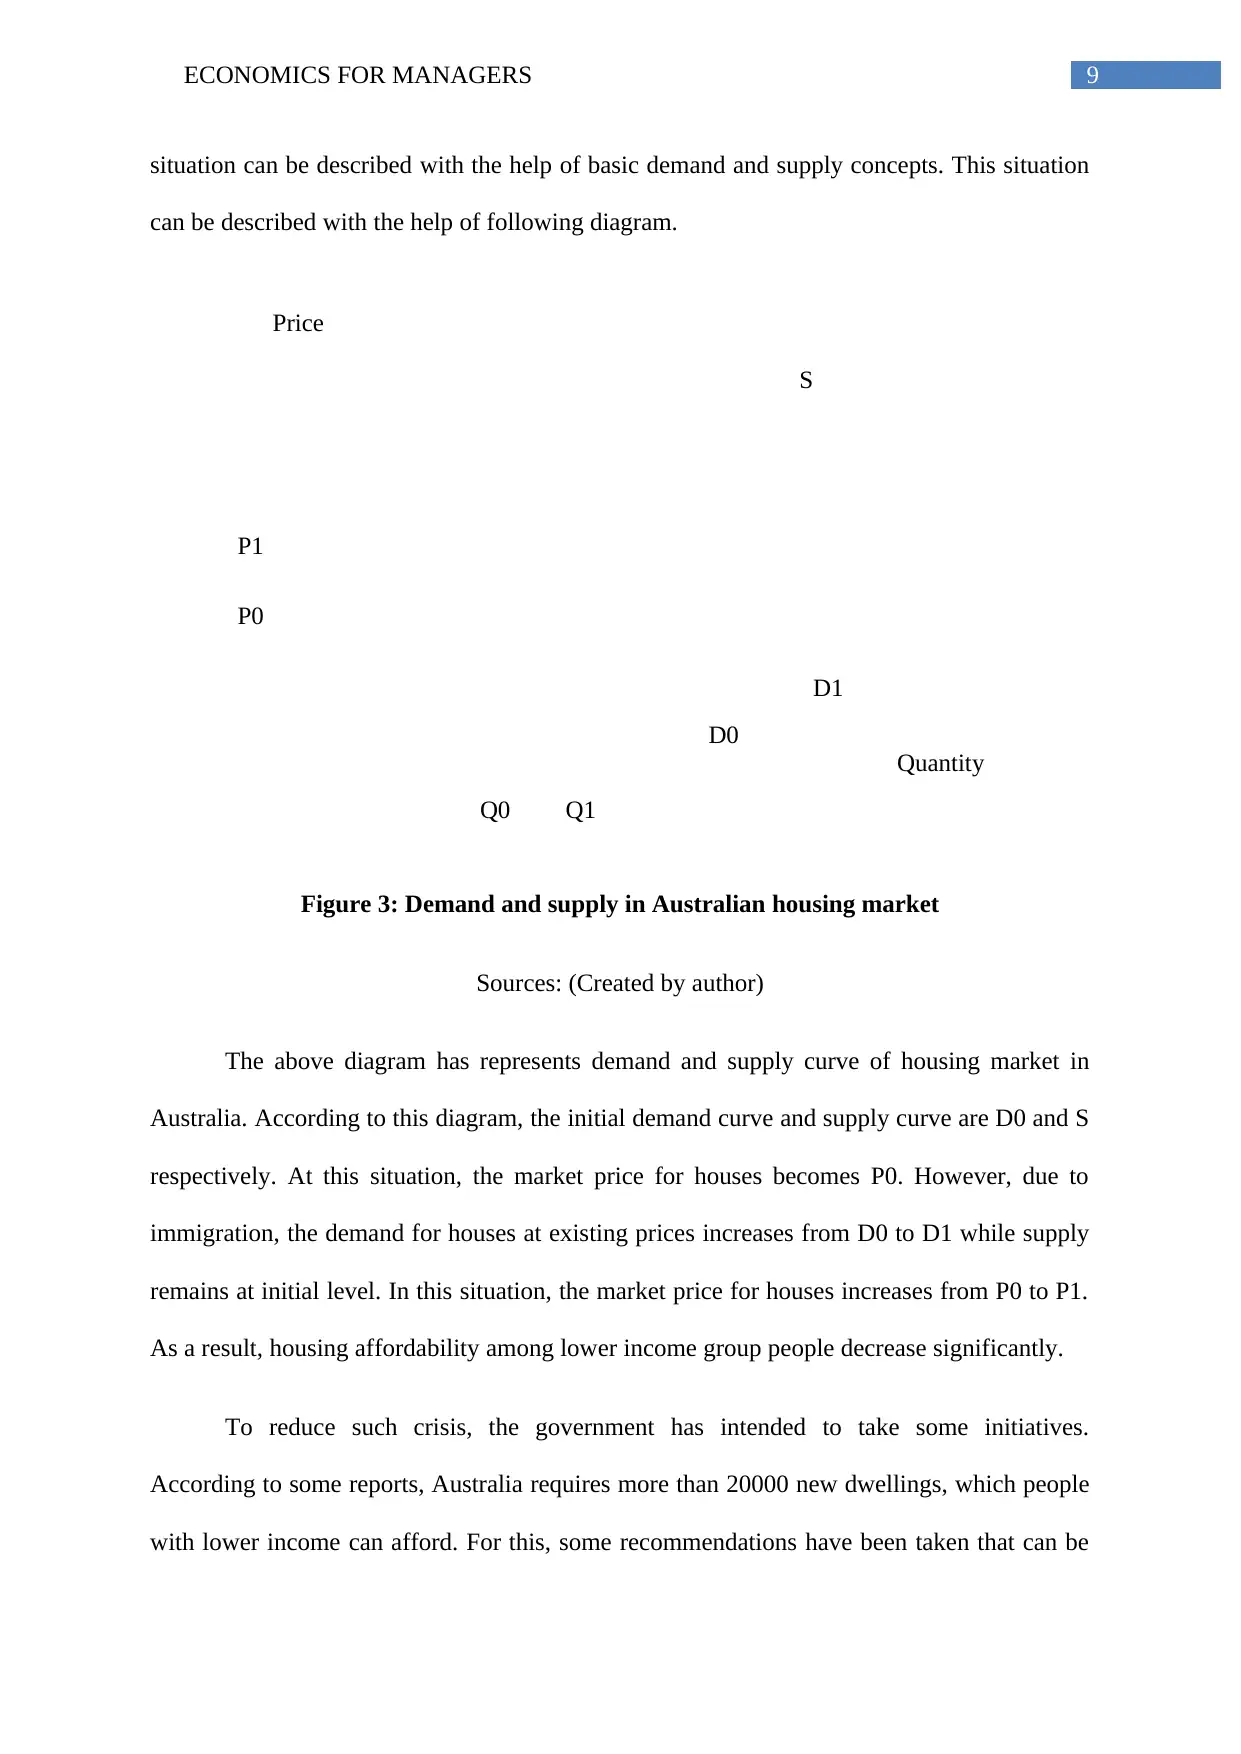
situation can be described with the help of basic demand and supply concepts. This situation
can be described with the help of following diagram.
Figure 3: Demand and supply in Australian housing market
Sources: (Created by author)
The above diagram has represents demand and supply curve of housing market in
Australia. According to this diagram, the initial demand curve and supply curve are D0 and S
respectively. At this situation, the market price for houses becomes P0. However, due to
immigration, the demand for houses at existing prices increases from D0 to D1 while supply
remains at initial level. In this situation, the market price for houses increases from P0 to P1.
As a result, housing affordability among lower income group people decrease significantly.
To reduce such crisis, the government has intended to take some initiatives.
According to some reports, Australia requires more than 20000 new dwellings, which people
with lower income can afford. For this, some recommendations have been taken that can be
Price
Quantity
S
D1
D0
P1
P0
Q0 Q1
situation can be described with the help of basic demand and supply concepts. This situation
can be described with the help of following diagram.
Figure 3: Demand and supply in Australian housing market
Sources: (Created by author)
The above diagram has represents demand and supply curve of housing market in
Australia. According to this diagram, the initial demand curve and supply curve are D0 and S
respectively. At this situation, the market price for houses becomes P0. However, due to
immigration, the demand for houses at existing prices increases from D0 to D1 while supply
remains at initial level. In this situation, the market price for houses increases from P0 to P1.
As a result, housing affordability among lower income group people decrease significantly.
To reduce such crisis, the government has intended to take some initiatives.
According to some reports, Australia requires more than 20000 new dwellings, which people
with lower income can afford. For this, some recommendations have been taken that can be
Paraphrase This Document
Need a fresh take? Get an instant paraphrase of this document with our AI Paraphraser
10ECONOMICS FOR MANAGERS
Price
Quantity
S
D1
D0
P1
P0
Q0 Q1
mentioned briefly. Firstly, the restrictions regarding council planning need to be relaxed and
become more consistent (Andersen et al., 2018). Furthermore, housing density is required to
enhance so that more people can accommodate in an apartment. Secondly, some changes are
required in tenancy laws for giving long-term certainty to renters. Thirdly, a movement will
be made for changing an annual land tax rather than changing transaction taxes. Furthermore,
the government decides to set new budget for providing subsidies to housing affordability so
that more people can purchase first houses at comparatively lower prices.
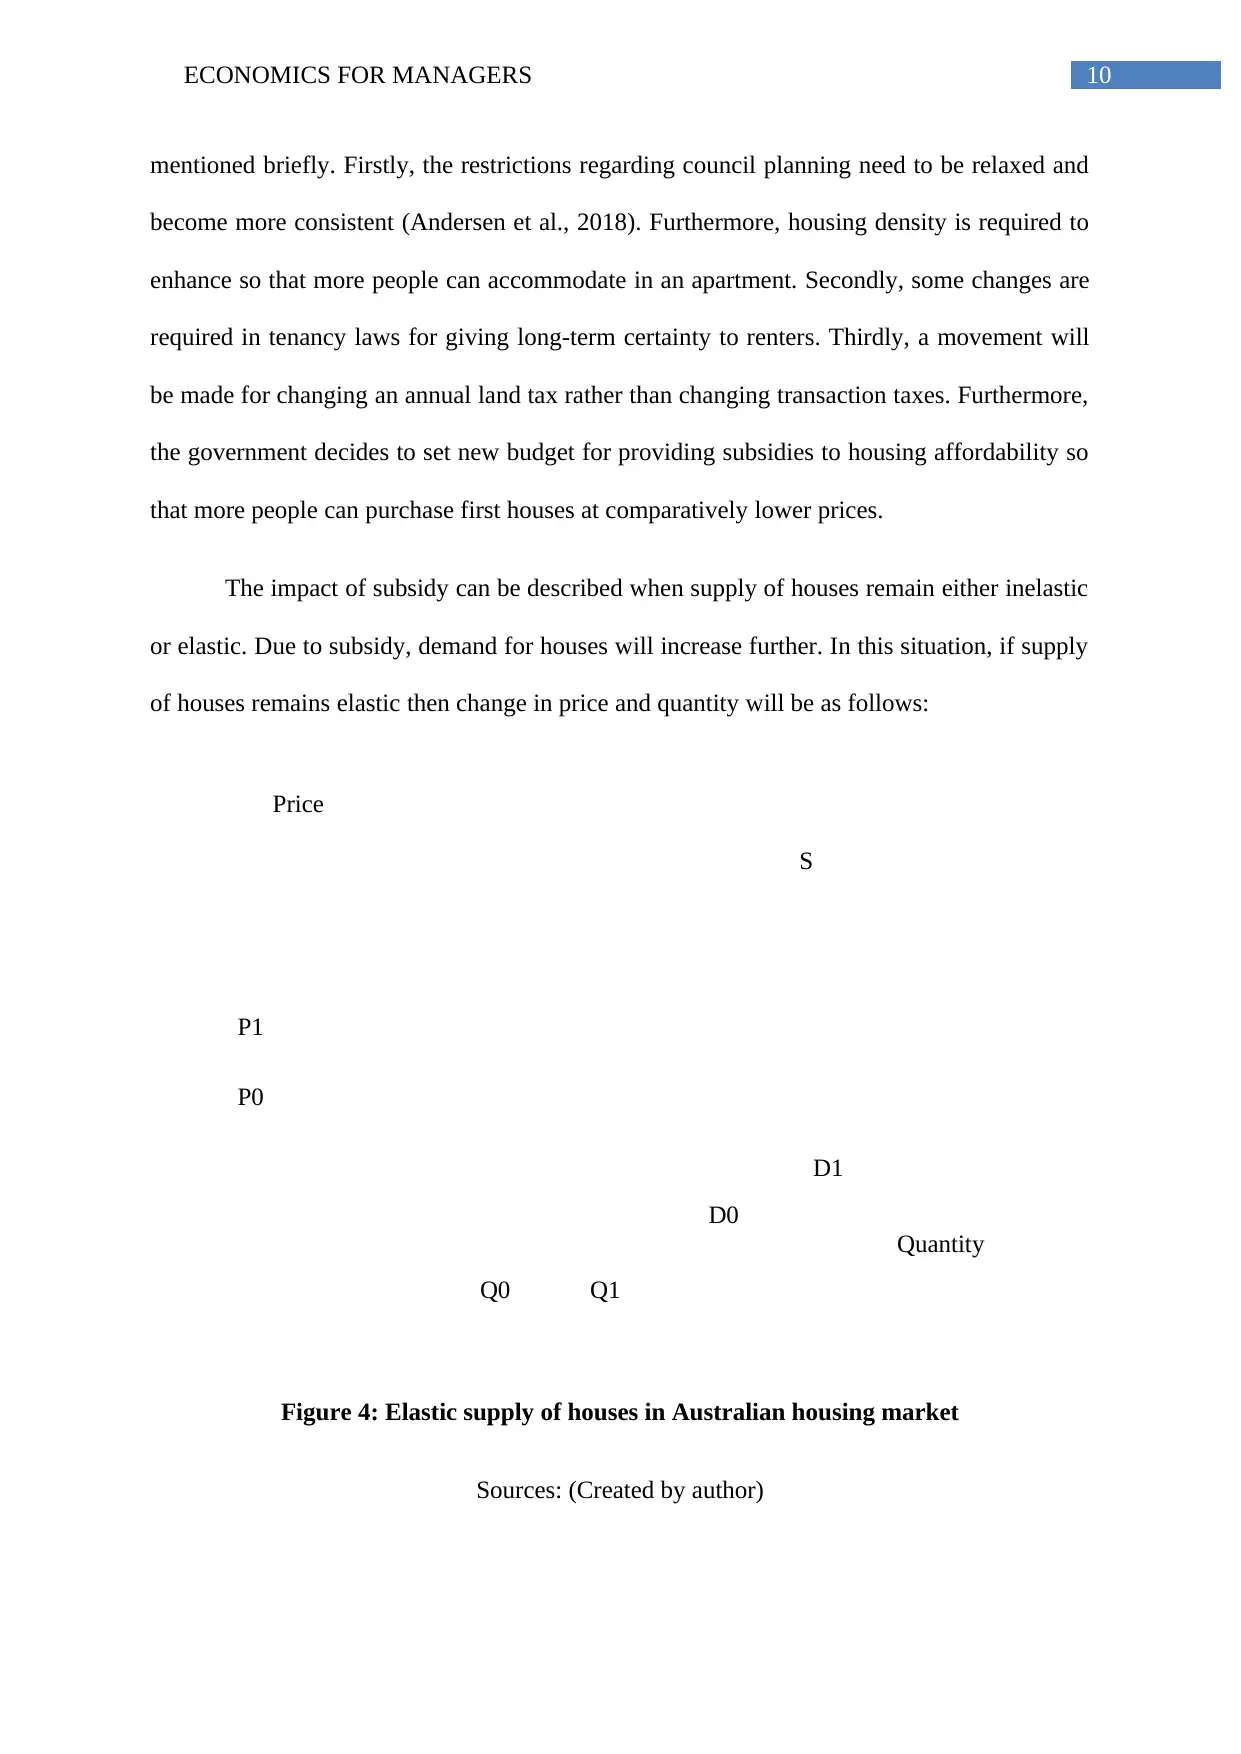
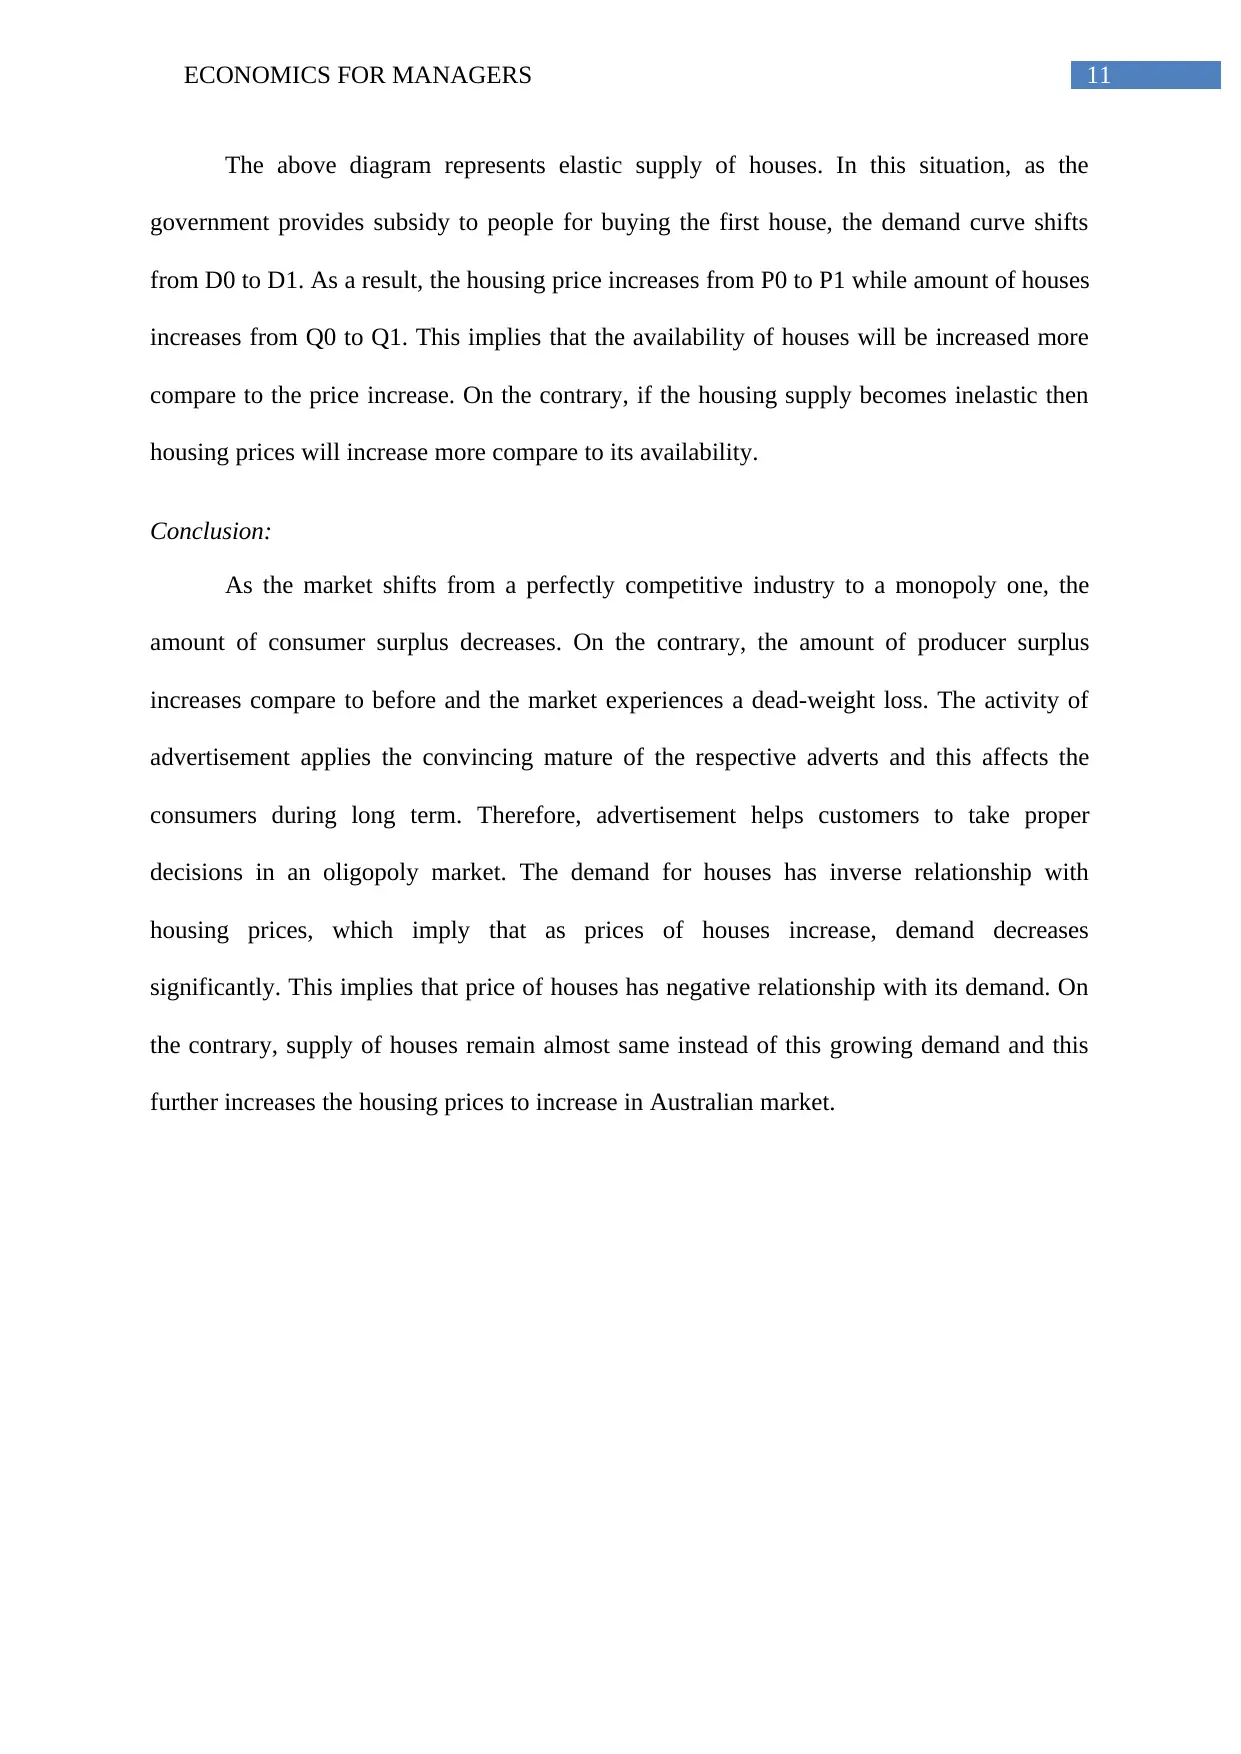
The impact of subsidy can be described when supply of houses remain either inelastic
or elastic. Due to subsidy, demand for houses will increase further. In this situation, if supply
of houses remains elastic then change in price and quantity will be as follows:
Figure 4: Elastic supply of houses in Australian housing market
Sources: (Created by author)
Price
Quantity
S
D1
D0
P1
P0
Q0 Q1
mentioned briefly. Firstly, the restrictions regarding council planning need to be relaxed and
become more consistent (Andersen et al., 2018). Furthermore, housing density is required to
enhance so that more people can accommodate in an apartment. Secondly, some changes are
required in tenancy laws for giving long-term certainty to renters. Thirdly, a movement will
be made for changing an annual land tax rather than changing transaction taxes. Furthermore,
the government decides to set new budget for providing subsidies to housing affordability so
that more people can purchase first houses at comparatively lower prices.
The impact of subsidy can be described when supply of houses remain either inelastic
or elastic. Due to subsidy, demand for houses will increase further. In this situation, if supply
of houses remains elastic then change in price and quantity will be as follows:
Figure 4: Elastic supply of houses in Australian housing market
Sources: (Created by author)
11ECONOMICS FOR MANAGERS
The above diagram represents elastic supply of houses. In this situation, as the
government provides subsidy to people for buying the first house, the demand curve shifts
from D0 to D1. As a result, the housing price increases from P0 to P1 while amount of houses
increases from Q0 to Q1. This implies that the availability of houses will be increased more
compare to the price increase. On the contrary, if the housing supply becomes inelastic then
housing prices will increase more compare to its availability.
Conclusion:
As the market shifts from a perfectly competitive industry to a monopoly one, the
amount of consumer surplus decreases. On the contrary, the amount of producer surplus
increases compare to before and the market experiences a dead-weight loss. The activity of
advertisement applies the convincing mature of the respective adverts and this affects the
consumers during long term. Therefore, advertisement helps customers to take proper
decisions in an oligopoly market. The demand for houses has inverse relationship with
housing prices, which imply that as prices of houses increase, demand decreases
significantly. This implies that price of houses has negative relationship with its demand. On
the contrary, supply of houses remain almost same instead of this growing demand and this
further increases the housing prices to increase in Australian market.
⊘ This is a preview!⊘
Do you want full access?
Subscribe today to unlock all pages.
Trusted by 1+ million students worldwide
1 out of 15
Related Documents


Your All-in-One AI-Powered Toolkit for Academic Success.
+13062052269
info@desklib.com
Available 24*7 on WhatsApp / Email
![[object Object]](/_next/static/media/star-bottom.7253800d.svg)
Unlock your academic potential
Copyright © 2020–2026 A2Z Services. All Rights Reserved. Developed and managed by ZUCOL.